Sample of Cataclysmic Variables from 400d X-ray Survey
R. A. Burenin, M. G. Revnivtsev, A. Yu. Tkachenko, V. S. Vorobyev, A., N. Semena, A. V. Meshcheryakov, S. N. Dodonov, M. V. Eselevitch, M. N., Pavlinsky

TL;DR
This paper identifies and characterizes a sample of cataclysmic variables from the 400d X-ray survey, providing new insights into their luminosity function at low X-ray luminosities and predicting their detectability in future surveys.
Contribution
It presents the first optical identification of CVs from the 400d X-ray survey and constrains their X-ray luminosity function at low luminosities, revealing a less steep slope than at higher luminosities.
Findings
Eight CVs identified, four newly discovered.
The CV X-ray luminosity function has a shallower slope at L_X ~ 10^29-10^30 erg s^-1.
Predicted detection of thousands of CVs in future X-ray surveys.
Abstract
We present a sample of cataclysmic variables (CVs) identified among the X-ray sources from the 400 square degree X-ray survey based on ROSAT pointing data (400d). The procedure of the CV selection among the X-ray sources using additional optical and infrared data from Sloan Digital Sky Survey and WISE survey is described. The results of the optical observations of the selected objects carried out mainly with the Russian-Turkish 1.5-m telescope (RTT-150) and the 6-m telescope of the Special Astrophysical Observatory of the Russian Academy of Sciences (BTA) are presented. Some observations have also been performed with the Sayan Observatory 1.6-m AZT-33IK telescope. Currently we selected eight CVs, four of which were found for the first time in our work. Based on this sample, we have obtained preliminary constraints on the CV X-ray luminosity function in the solar neighborhood in the low…
Click any figure to enlarge with its caption.
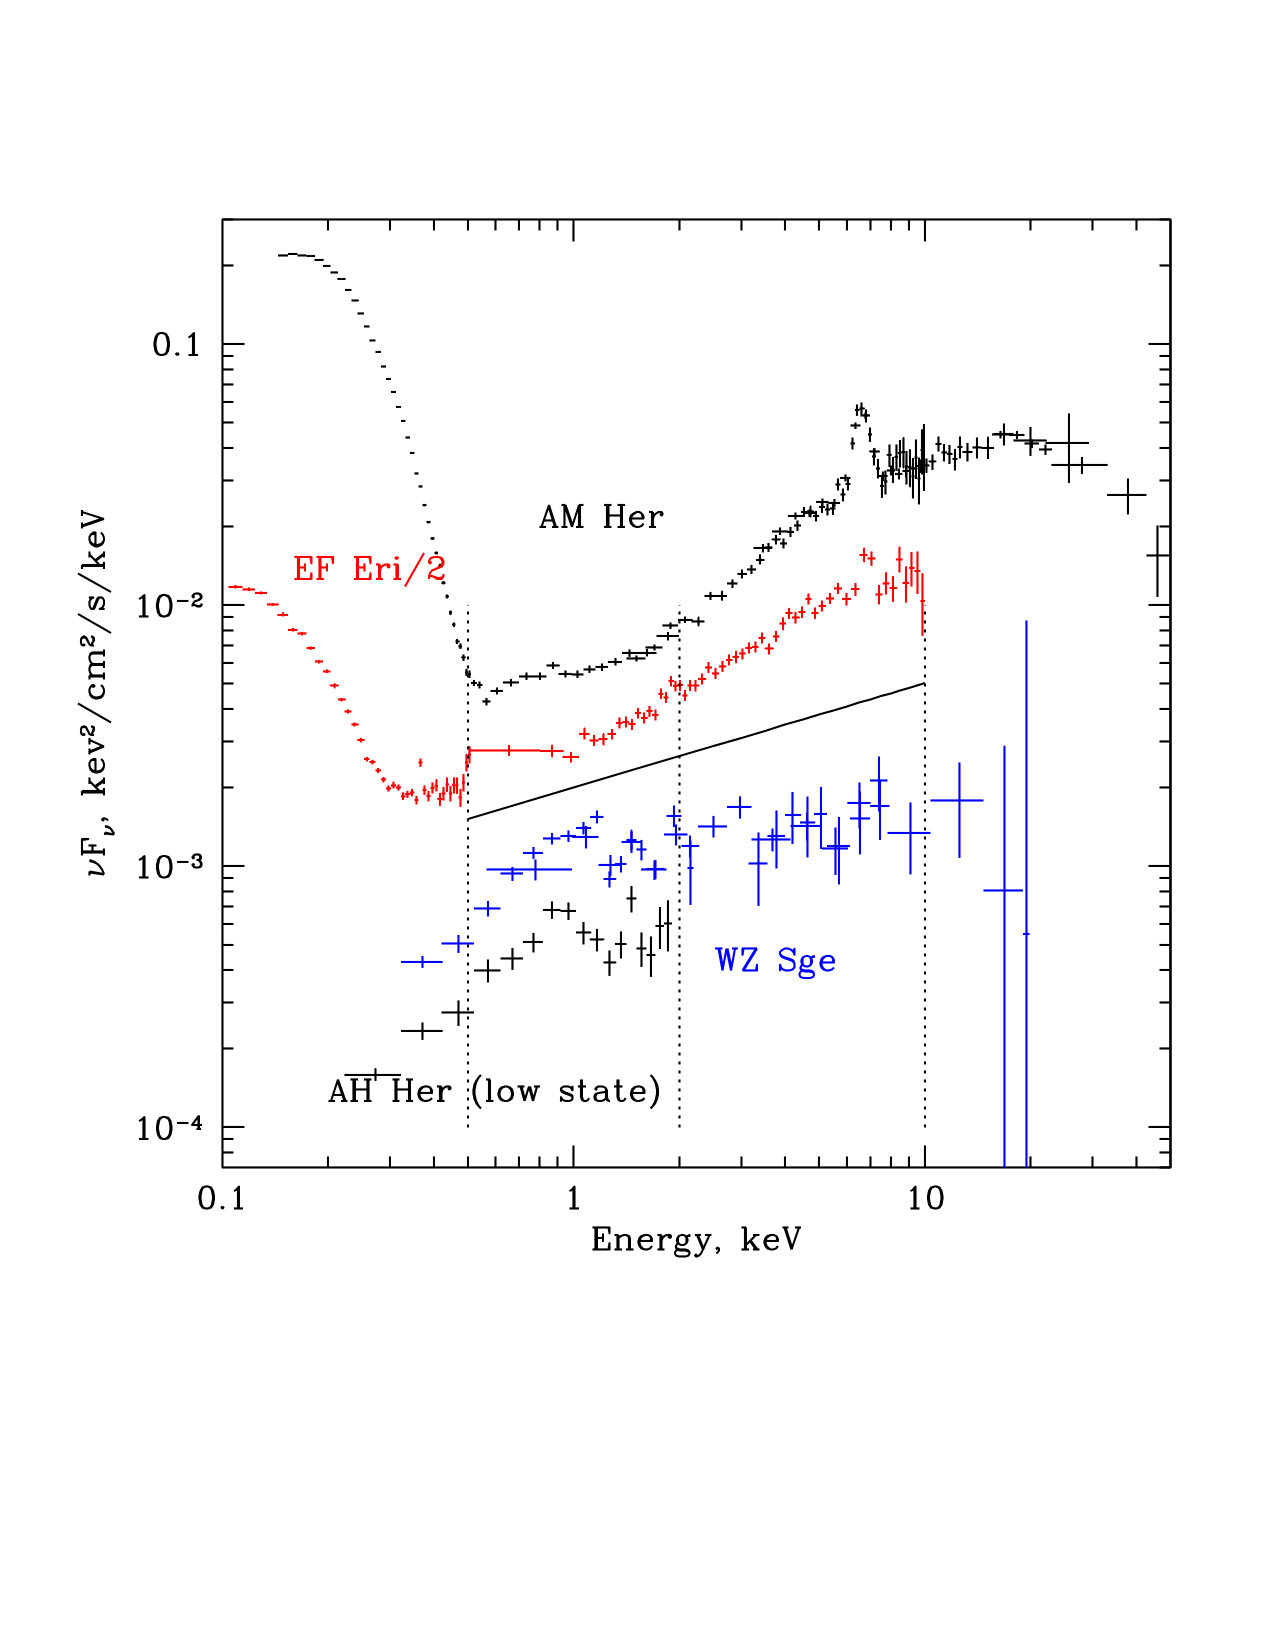 Figure 1
 Figure 2
 Figure 3
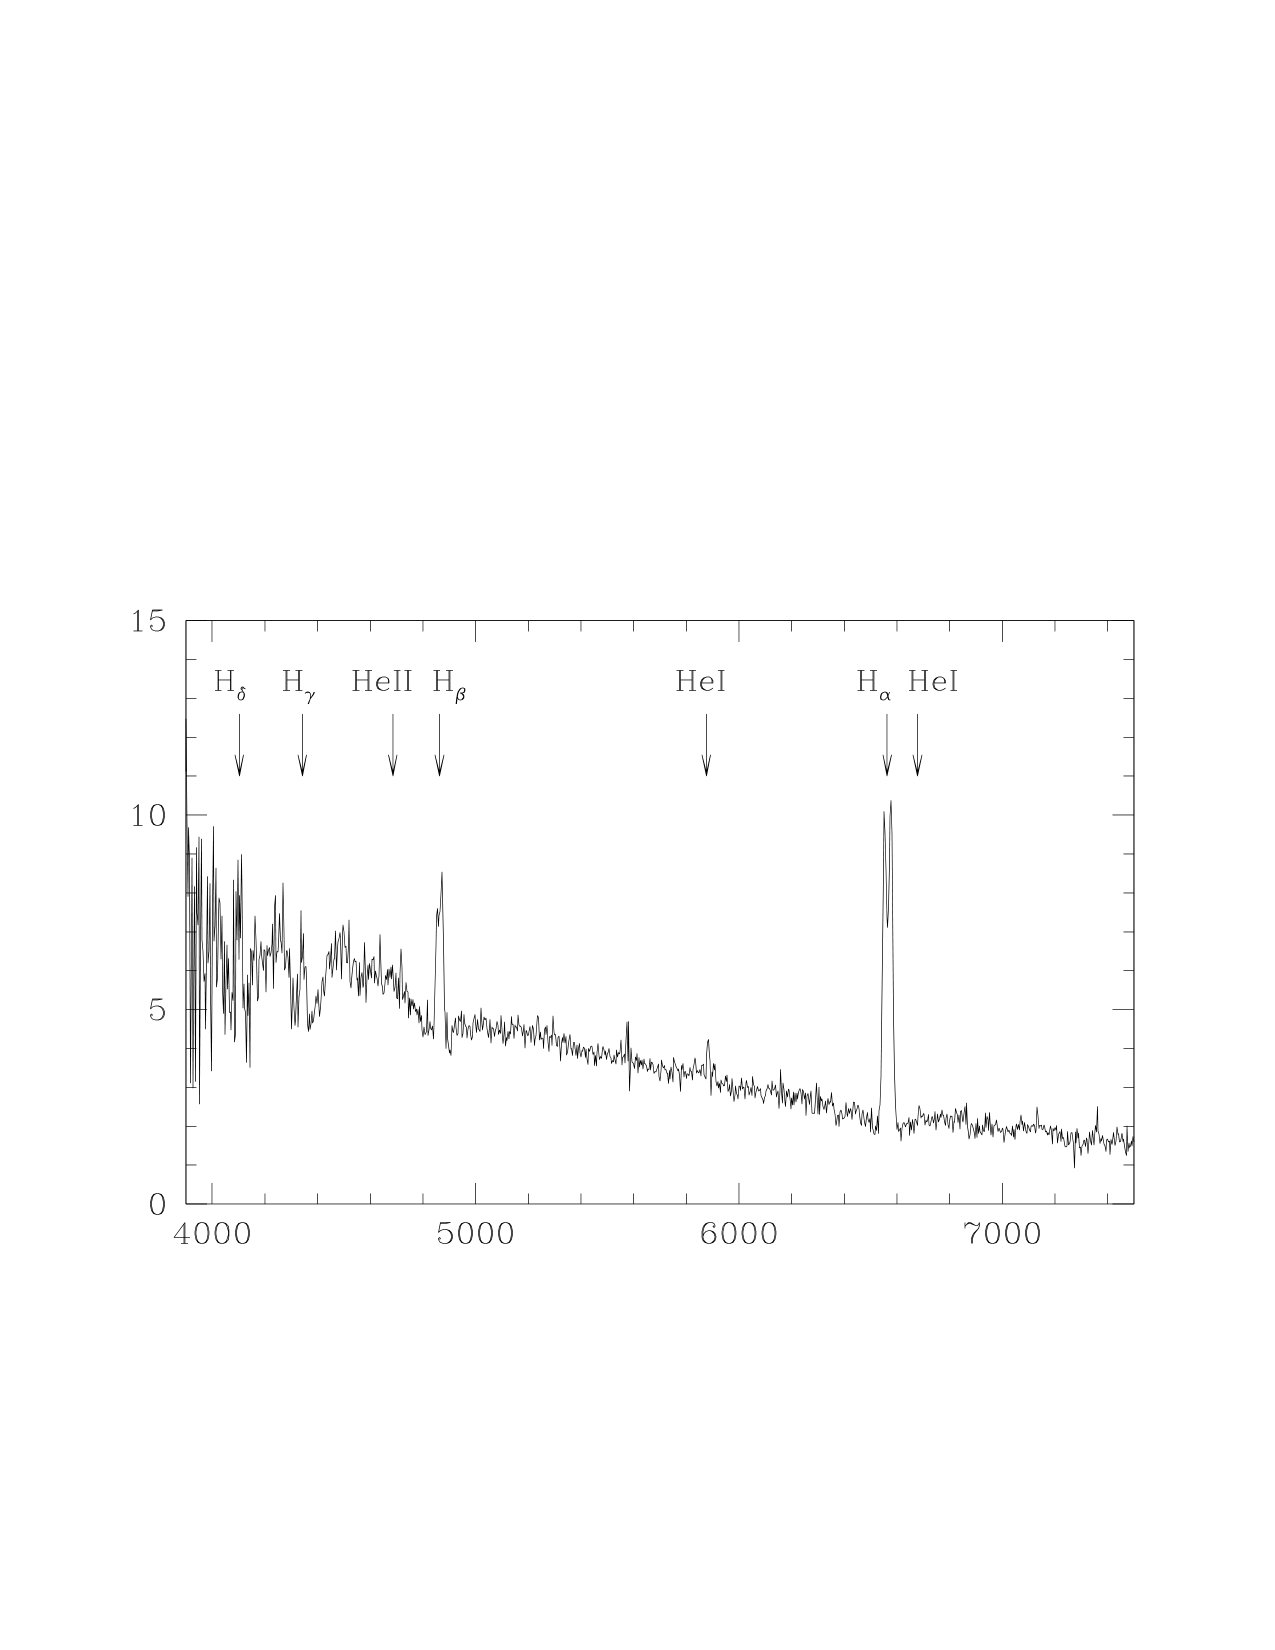 Figure 4
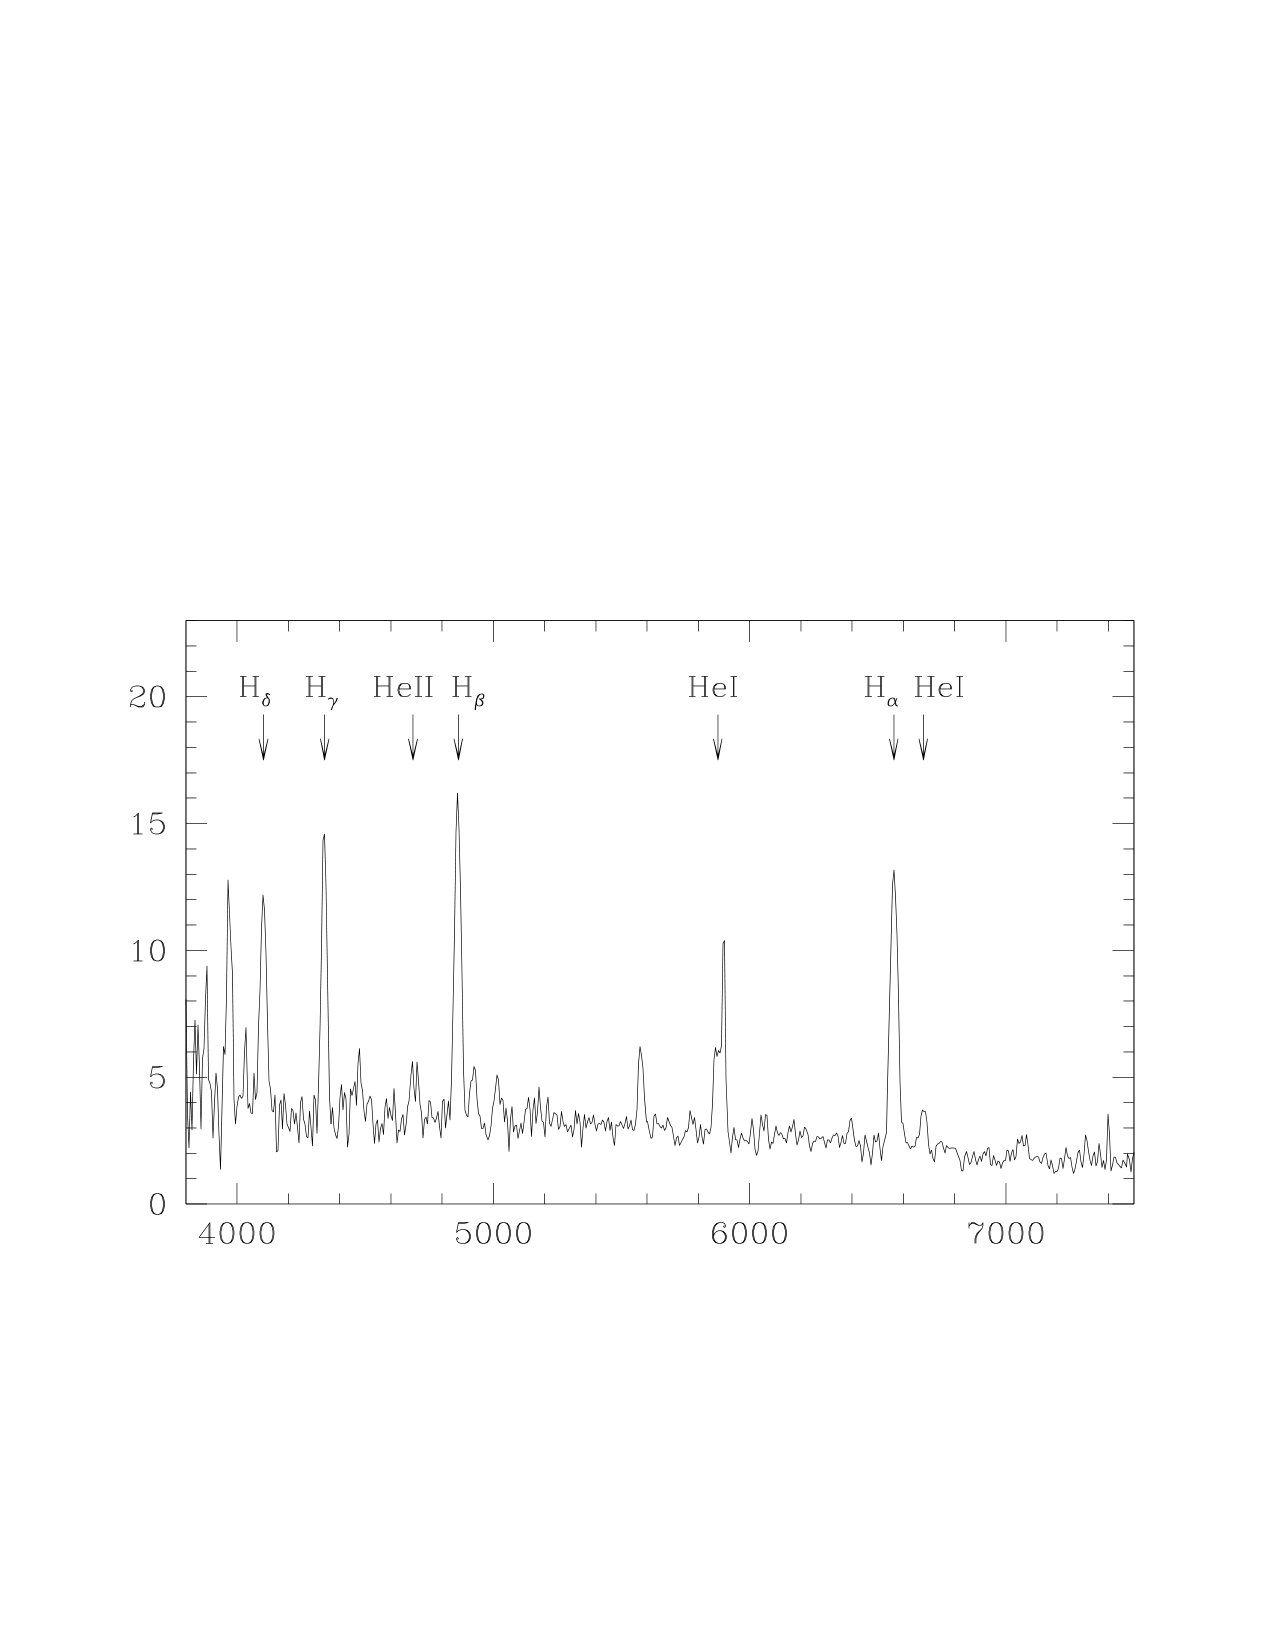 Figure 5
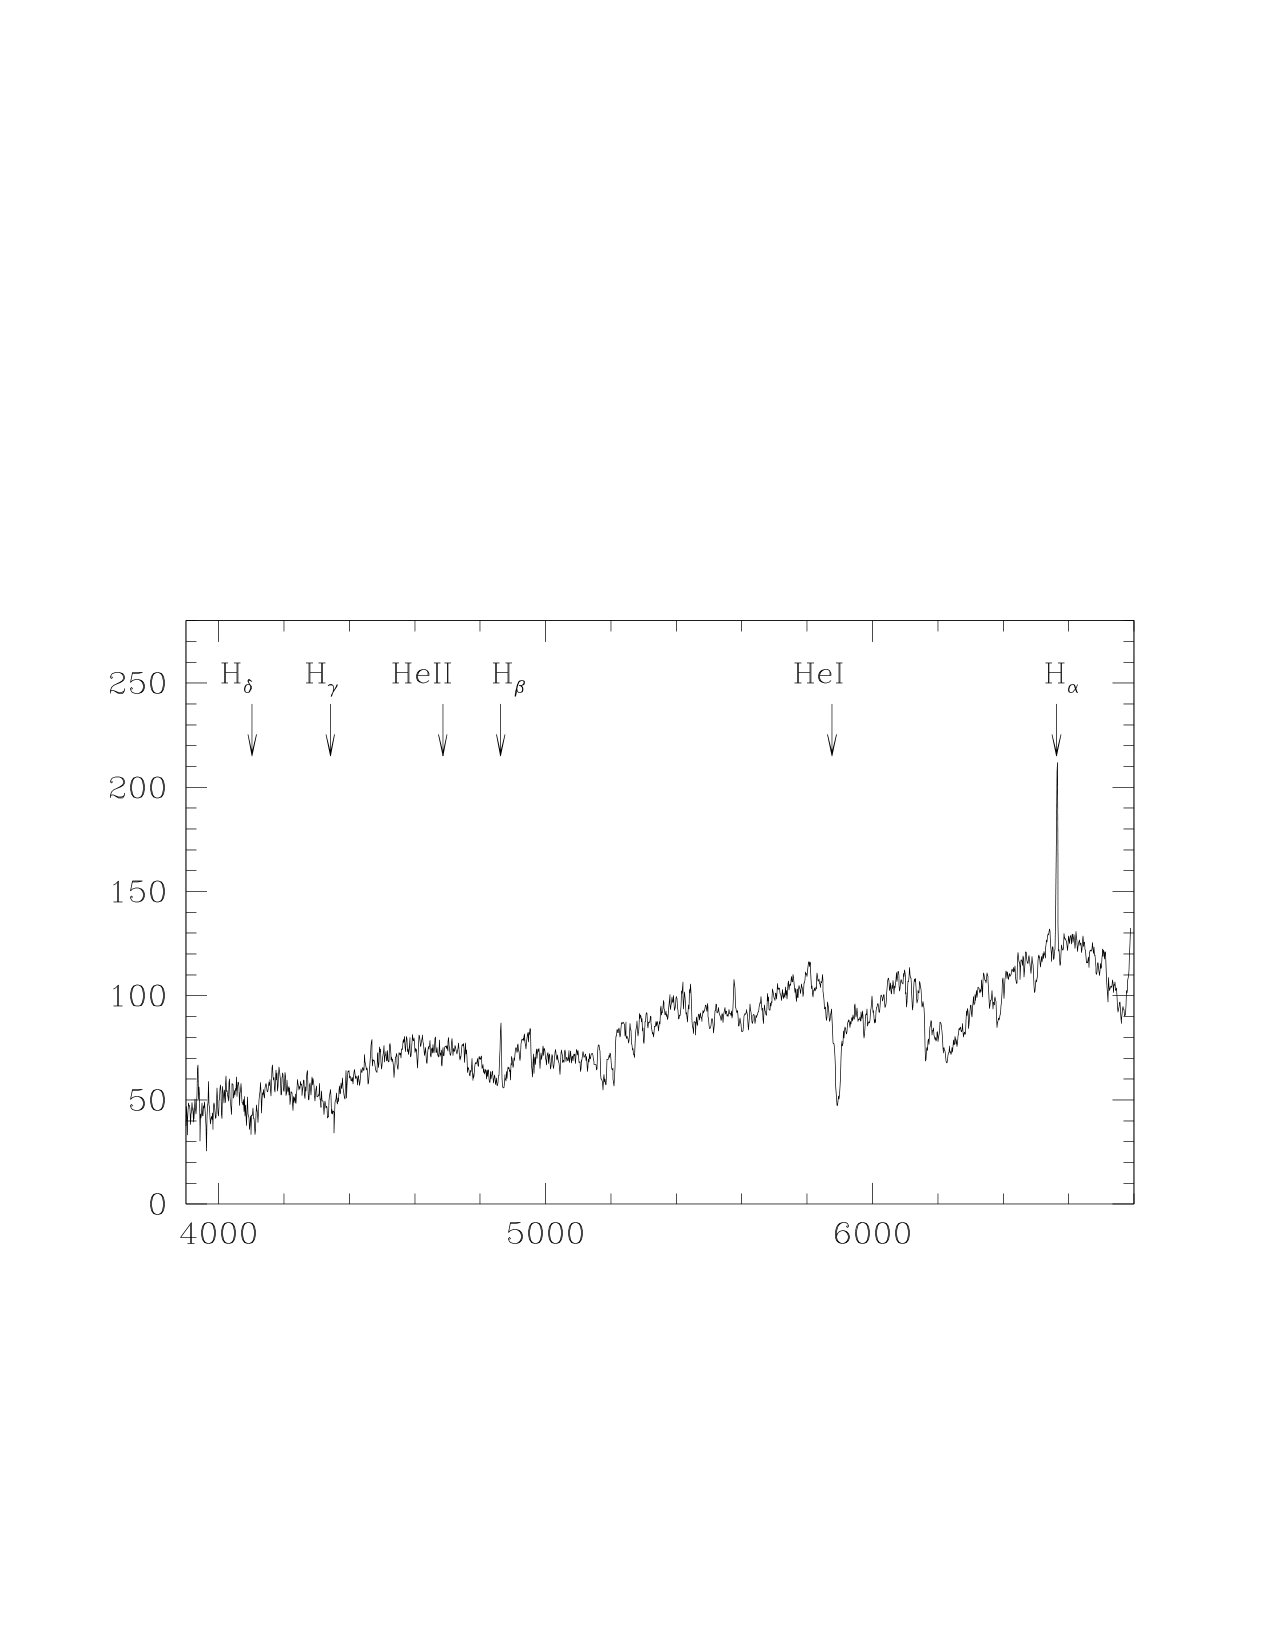 Figure 6
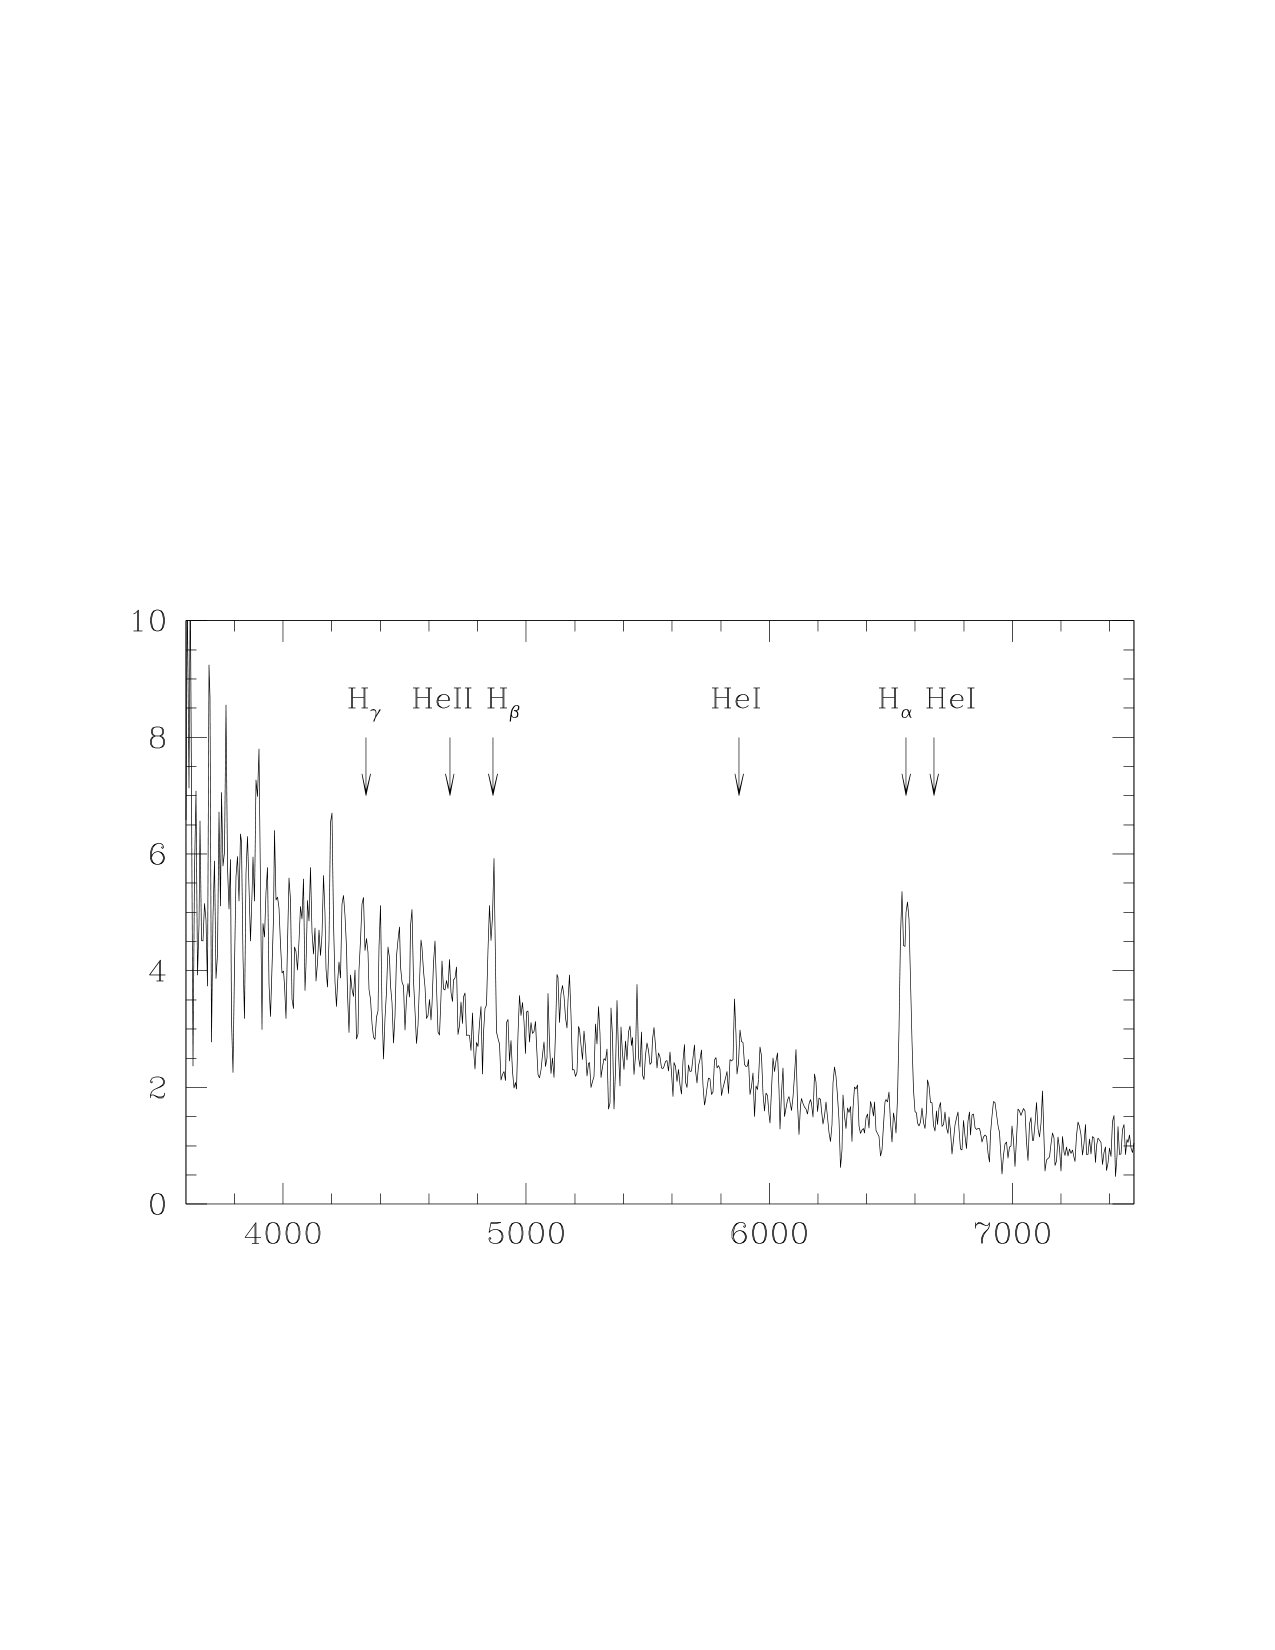 Figure 7
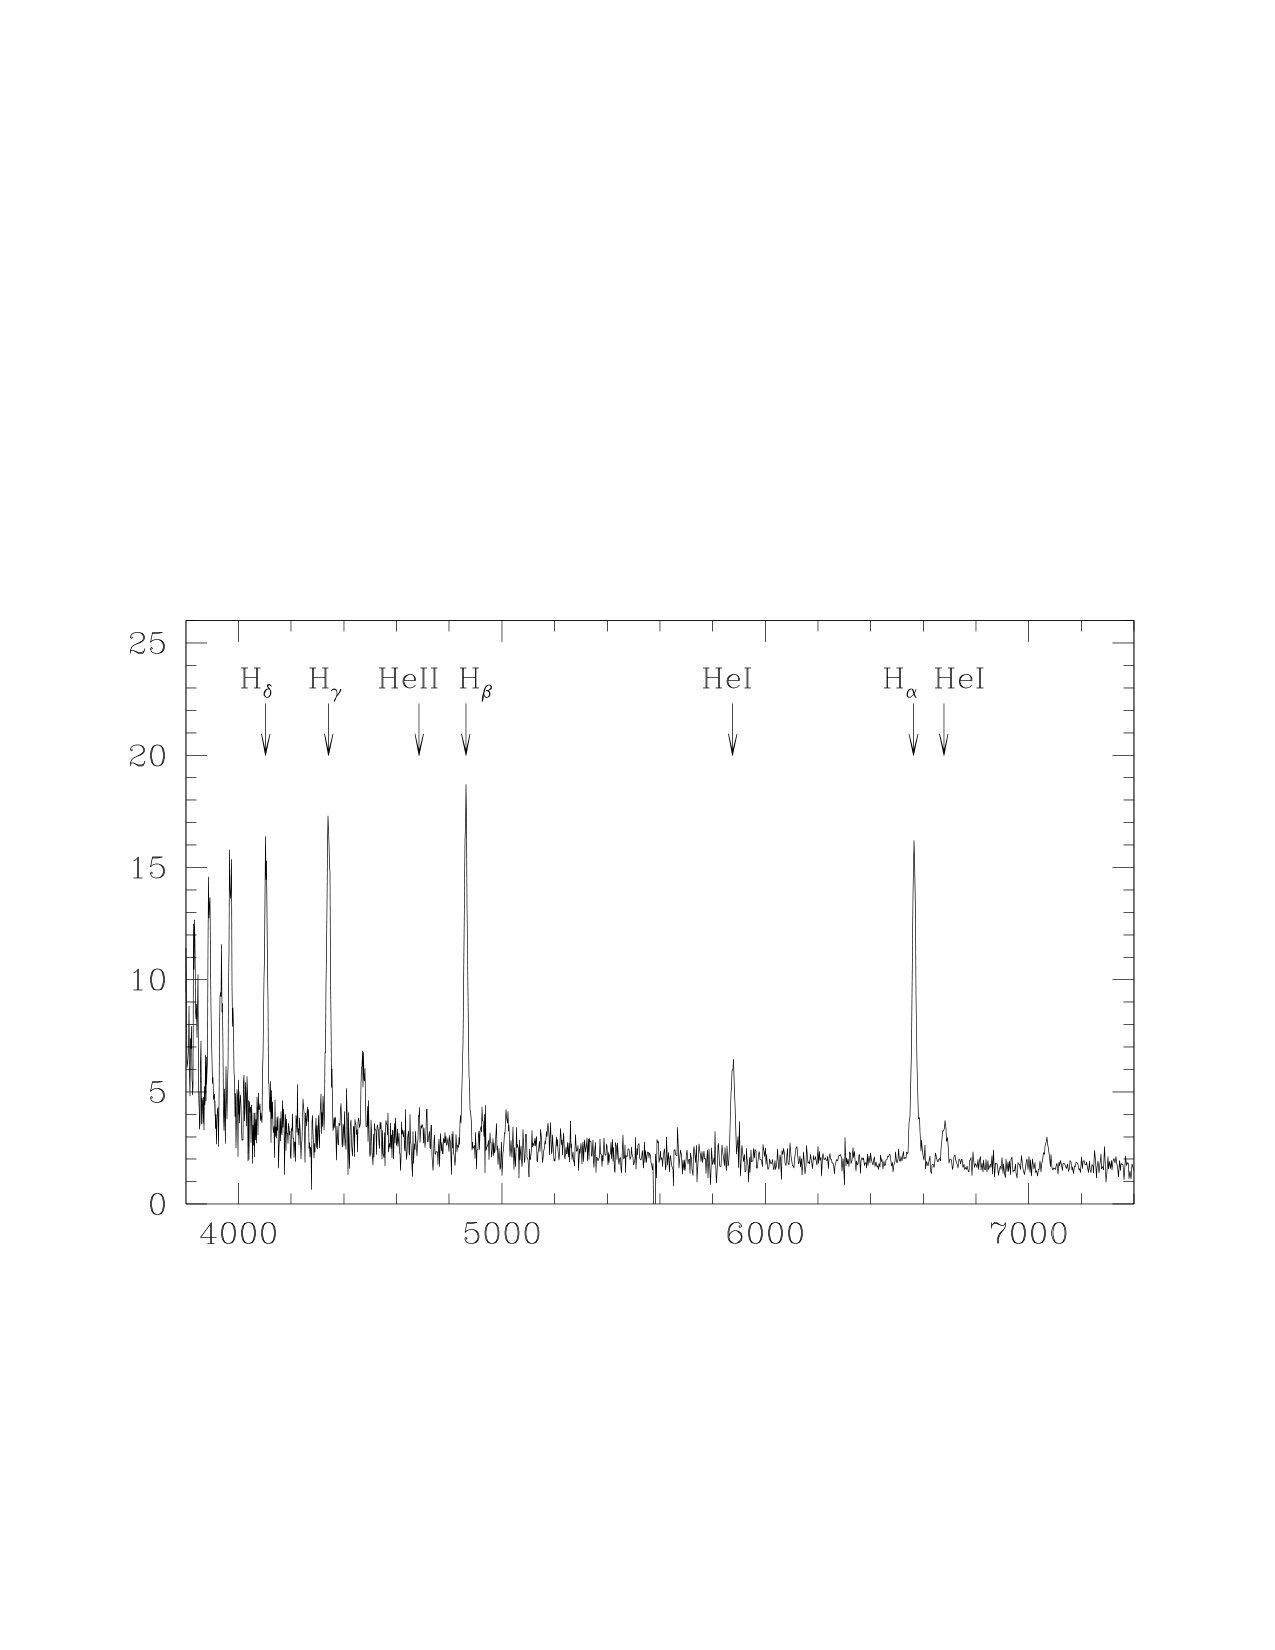 Figure 8
 Figure 9
| Name | (J2000) | (J2000) | , erg s-1cm-2 | , erg s-1 | Other name | |
|---|---|---|---|---|---|---|
| 400d j | SDSS J001912.58+220733.0 | |||||
| 400d j | HY Eri | |||||
| 400d j | 1E 1240.8+0312 | |||||
| 400d j | SDSS J152212.20+080340.9 | |||||
| 400d j | ||||||
| 400d j | VW CrB | |||||
| 400d j | ||||||
| 400d j | SDSS J204720.76+000007.7 |
Peer Reviews
No public reviews on file for this paper yet. If you reviewed it on a platform where reviews are public (OpenReview, ICLR, NeurIPS, ICML), you can paste yours below so the community can read it here.
Videos
No videos yet. Explain this paper in a talk, walkthrough, or lecture? Add one.
Sample of Cataclysmic Variables from 400d X-ray Survey
R. A. Burenin
1
M. G. Revnivtsev
1
A. Yu. Tkachenko
1
V. S. Vorobyev
1
A. N. Semena
1
A. V. Meshcheryakov
1
S. N. Dodonov
2
M. V. Eselevitch
3
M. N. Pavlinsky \addresstext1Space Research Institute RAS (IKI), Moscow, Russia \addresstext2Special Astrophysical Observatory RAS, Nizhnij Arkhyz, Russia \addresstext3Institute of Solar-Terrestrial Physics SB RAS, Irkutsk, Russia
1
Abstract
We present a sample of cataclysmic variables (CVs) identified among the X-ray sources from the 400 square degree X-ray survey based on ROSAT pointing data (400d). The procedure of the CV selection among the X-ray sources using additional optical and infrared data from Sloan Digital Sky Survey and WISE survey is described. The results of the optical observations of the selected objects carried out mainly with the Russian–Turkish 1.5-m telescope (RTT-150) and the 6-m telescope of the Special Astrophysical Observatory of the Russian Academy of Sciences (BTA) are presented. Some observations have also been performed with the Sayan Observatory 1.6-m AZT-33IK telescope. Currently we selected eight CVs, four of which were found for the first time in our work. Based on this sample, we have obtained preliminary constraints on the CV X-ray luminosity function in the solar neighborhood in the low luminosity range, – erg s*-1* (0.5–2 keV). We show that the logarithmic slope of the CV X-ray luminosity function in this luminosity range is less steep than at erg s*-1*. From our CV X-ray luminosity function estimates it follows that few thousand CVs will be detected in the Spectrum-Röntgen-Gamma (SRG) observatory all-sky X-ray survey at high Galactic latitudes, which will allow to obtain much more accurate measurements of CV X-ray luminosity function in the luminosity range – erg s*-1*.
keywords:
cataclysmic variables, X-ray surveys, luminosity function
††journal: ApJS††journal: Information Bulletin on Variable Stars††journal: \ptp††journal: ApJ††journal: \pazh††journal: Balt. Astr.††journal: MNRAS††journal: \advspres††journal: A&A††journal: ApJS††journal: \pazh††journal: \astl††journal: A&A††journal: ApJ††journal: MNRAS††journal: \asp††journal: AJ††journal: ApJ††journal: MNRAS††journal: ApJS††journal: A&A††journal: MNRAS††journal: ApJS††journal: ApJ††journal: Information Bulletin on Variable Stars††journal: \aca††journal: PASP††journal: MNRAS††journal: MNRAS††journal: A&A††journal: MNRAS††journal: A&A††journal: A&A††journal: \nature††journal: \pazh††journal: A&A††journal: AJ††journal: A&A††journal: AJ††journal: AJ††journal: ApJ††journal: AJ††journal: AJ††journal: \pazh††journal: \astl††journal: ApJ††journal: ApJ††journal: AJ††journal: A&A
\journalinfo
2016424240[250]
\submitted
November 24, 2015
1 Introduction
Studies of samples of binary systems with accreting white dwarfs (cataclysmic variables, CVs) provide important information on physical processes in these systems that are difficult or even impossible to investigate by other means. For example, it turns out that the main mechanism of angular momentum losses for CVs with periods shorter than 2–3 h is the emission of gravitational waves (Faulkner, 1971; Paczynski, 1981). This prediction is confirmed by characteristic features in the properties of the CV population, such as the minimum in the distribution of orbital periods, min (Gänsicke et al., 2009), which agree well with the improved theoretical estimates of this quantity for the case of angular momentum losses trough gravitational radiation in binary system (Knigge et al., 2011).
Nevertheless, there are also some discrepancies between observations and theoretical views. For example, theoretical modeling of the CV population shows that most of them must be in a state with a low accretion luminosity, and their companions must be degenerate objects (the so-called “post-bounce” CVs, e.g., Kolb, 1993; Howell et al., 2001; Knigge et al., 2011). However, only a small number of possible post-bounce CV candidates are known to date (see, e.g., Littlefair et al., 2008; Aviles et al., 2010). Among the problems that can be solved using studies of the statistically complete samples of CVs, there is a question of how and at what rate the masses of the white dwarfs (WDs) in these systems grow (e.g., Zorotovic et al., 2011). Since accreting white dwarfs are apparently the progenitors of type Ia supernovae, all such questions appear to be closely related to the studies of the properties of type Ia supernovae, which are used as “standard candles” for cosmological measurements.
It is also turns out that CVs contribute significantly to the Galactic ridge X-ray emission (Revnivtsev et al., 2009) and to the total X-ray luminosity of the Galaxy and other galaxies after the subtraction of the contribution from low-mass X-ray binaries (Sazonov et al., 2006; Revnivtsev et al., 2008a). To obtain more accurate measurements of the contribution from the CV population to the total X-ray luminosity of galaxies, the studies of the statistically complete samples of these objects and the data that allow to measure the X-ray luminosity function are also required.
The selection of the statistically complete CV samples in X-rays is one of the most natural approaches to obtain unbiased CV samples, because the X-ray emission is generated in the accretion flow near the WD surface and, therefore, is a property of all types of CVs (for a more detailed discussion, see below). Such samples can be obtained in various X-ray sky surveys. The X-ray luminosity functions of CVs were measured earlier using the data from the RXTE all-sky survey (Sazonov et al., 2006) and the ROSAT North Ecliptic Pole survey (Pretorius et al., 2007b; Pretorius and Knigge, 2012) as well as in harder X-ray band, using INTEGRAL (Revnivtsev et al., 2008b) and Swift (Pretorius and Mukai, 2014) data.
Almost all the objects detected in these surveys have X-ray luminosities111Here and below all X-ray fluxes and luminosities are given in 0.5–2 keV energy band. erg s*-1*. Since the CV X-ray luminosity function increases toward lower luminosities, the measurements of the CV number density at luminosities erg s*-1* should allow to refine the contribution from the CV population to the total X-ray luminosity of the Galaxy. In addition, at those low luminosities, one could expect to detect the large number of post-bounce CVs.
Thus, the CV X-ray luminosity function measurements at low X-ray luminosities erg s*-1* are of great interest. To obtain these measurements one should use deeper X-ray surveys, with flux limits – erg s*-1cm-2*. In this work for these purposes we used the 400 square degree (400d) X-ray survey, based on ROSAT pointing data, which were used earlier to detect galaxy clusters (Burenin et al., 2007). More than 37 000 point X-ray sources with fluxes above erg s*-1cm-2* were detected in this survey; about 22 000 of these sources were detected in the ROSAT fields overlapped with Sloan Digital Sky Survey (Burenin et al., 2016b). The optical observations with the aim to search the CVs among the X-ray sources from this survey were started by our group earlier (Tkachenko et al., 2015); in this paper, we discuss the sample of CVs obtained to date.
Below, we describe the procedure of the CV selection among the ROSAT X-ray sources using additional optical and infrared data from SDSS and WISE surveys. We provide a list of CVs selected in the 400d survey to date and discuss the properties of these objects. We also discuss the preliminary constraints on the X-ray luminosity function of CVs in the solar neighborhood obtained using this sample.
2 CV Selection in X-rays and optical
X-ray surveys provide one of the most efficient methods to select CVs. Indeed, all types of CVs appear to be the sources of X-ray emission associated with the optically thin plasma emission of the accretion flow heated near the WD surface (see, e.g., Aizu, 1973). Depending on the specific physical picture of accretion, the fraction of the X-ray emission at energies above 0.5 keV in the bolometric luminosity of CVs can differ significantly, but it always remains fairly large, at least % (see, e.g., Beuermann and Thomas, 1993).
The spectrum of CVs at the energies above 0.5 keV is dominated mainly by the optically thin plasma emission that originates either in an accretion column or in an optically thin boundary layer near the WD surface. The hot region near the WD surface is significantly inhomogeneous in temperature, but the bulk of the X-ray emission is generated at temperatures of 1–20 keV, producing a spectrum with a characteristic power-law slope . It is shown in Fig. 1, where the examples of CV X-ray spectra from ROSAT, ASCA, and RXTE data are presented.
Fig. 1 shows the spectra of the magnetized WDs EF Eri and AM Her (the latter in two states: in the high state, in which a powerful soft component with a temperature of about 60 eV is seen, and in the low state, when there is no such component in the spectrum) as well as the spectrum of WZ Sge, an accreting WD without a strong magnetic field. A more detailed discussion of the X-ray spectra for accreting WDs with a weak magnetic field can be found, for example, in Byckling et al. (2010). It is clearly seen that the CV spectra in the 0.5–10 keV energy band look approximately similar in shape, irrespective of the CV type and state, and that the general form of these spectra can be approximately described by a power law within a photon index of .
2.1 X-ray data
In our work we used the ROSAT pointed data in the 0.5–2 keV energy band, at high galactic latitudes, which were used earlier to search for distant galaxy clusters (400d survey, Burenin et al., 2007). In 400d survey point X-ray sources were detected only in the central part of the ROSAT field of view at distances from its center, where ROSAT angular resolution is better than (PSF FWHM). The positional accuracy for an X-ray source is, on average, is better than (at 95% confidence). We used 1605 ROSAT pointings at high Galactic latitudes . The CVs nearest to the Sun located within the Galactic disk must be observed at such latitudes.
The geometric area of the 400d survey for point sources is 436.7 sq. deg. The geometric area of the 400d survey overlapping with SDSS photometric fields is 262.3 sq. deg. Since the exposure distribution of ROSAT pointings is wide, the flux limit turns out to be different in different fields of the survey. Half and 5% of the geometric area are gathered at X-ray flux of and erg s*-1* cm*-2*, respectively (Burenin et al., 2016b).
2.2 Optical and Infrared data
As it was discussed above, in total more than 37 000 X-ray sources were detected in the 400d survey, about 22 000 of them — in the fields where there is an overlap with SDSS photometric fields. Obviously, the complete optical identification of all X-ray sources from the 400d survey is too difficult, and additional data are required to select CVs. For these purposes, we used the data from the 12-th release of the SDSS (Alam et al., 2015) and the WISE infrared all-sky survey (Wright et al., 2010).
The stellar companions of the WDs in CVs are mostly low-mass () main-sequence stars (Knigge, 2006). However, the WD in a CV and the accretion disk around it have a temperature no lower than K (see, e.g. Townsley and Gänsicke, 2009), and, hence, are blue in the optical band. In the blue part of the optical spectrum and in the near ultraviolet, the CV spectrum must be always dominated by the emission from the WD and the accretion disk; therefore, this property can be used to select CVs in the optical band (see, e.g., Green et al., 1982; Szkody et al., 2002). For the selection of CV candidates, we used the criterion , which was used previously among other criteria in the SDSS to eliminate the WDs from the spectroscopic sample of quasars (Richards et al. 2002).
To eliminate a large number of quasars, which strongly contaminate the CV sample, we additionally discarded the objects with colors , where and are the photometric bands of the WISE infrared all-sky survey with central wavelengths of 3.4 and 4.6 m (Wright et al., 2010). For the vast majority of stars (except for the cool T dwarfs) and, consequently, for the vast majority of CVs, this spectral range corresponds to the Rayleigh-Jeans part of the spectrum; therefore, the CV color must be . The criterion we used is fairly conservative; it should allow the possible contribution of the companion star to be taken into account even if it is an L-type dwarf (see, e.g., Schmidt et al., 2015).
For the subsequent additional optical observations, we selected CV candidates with magnitudes . Even when the contribution of the accretion disk is small and the WD contribution dominates in the spectra of CVs, their absolute magnitudes are (Gänsicke et al., 2009; Revnivtsev et al., 2014). Therefore, the magnitude for such systems corresponds to a distance of pc, which is approximately equal to the thickness of the Galactic disk. The minimum absolute magnitude of CVs depends strongly on the WD mass and can reach for a WD with a mass of (Revnivtsev et al., 2014). Even for such systems the magnitude limit corresponds to a distance of pc, which also provides an appreciable search volume.
There are 53 objects satisfying the criteria discussed above in the 400d survey. Some of them (four objects) turned out to be previously known CVs. To identify the nature of the remaining objects, we carried out additional optical observations.
3 Optical observations of CV candidates
The additional optical observations were carried out with the Russian–Turkish 1.5-m telescope (RTT-150) using the medium- and low-resolution TFOSC spectrograph and the 6-m (BTA) telescope at the Special Astrophysical Observatory of the Russian Academy of Sciences, where the SCORPIO-2 spectrograph (Afanasyev, Moiseev, 2005, 2011) was used for the observations. Recently, beginning in the fall of 2015, the observations have also been carried out with the 1.6-m AZT-33IK telescope at the Sayan Observatory of the Institute of Solar-Terrestrial Physics, the Siberian Branch of the Russian Academy of Sciences, using the new medium- and low-resolution ADAM spectrograph (Afanasyev et al., 2016; Burenin et al., 2016a). In all cases, we used grisms or volume phase holographic gratings optimized for a range 4000–6000Å, which also includes the blue part of the spectrum starting from 3500–3700Å. The spectral resolution was from 7Å for SCORPIO-2 at the BTA telescope to 12Å for TFOSC at the RTT-150.
The spectroscopic observations of objects from this programme were carried out during the last few years. We observed 38 objects, four of which turned out to be new, previously unknown CVs. The spectra for two of them (400d j and 400d j) were later also obtained in the SDSS. The remaining objects turned out to be quasars at various redshifts, typically, at –. Examples of the spectra for such quasars are given in Tkachenko et al. (2015). The spectra of CV found in our work are presented in Fig. 2. The spectra of 15 objects with magnitudes were not measured to date; this work will be continued.
The reference list from the paper itself. Each links out to its DOI / PubMed record.
- 1Alam et al. (2015)
- 2[2] 219122015
- 3Antipin (1996)
- 4[4] 434311996
- 5Aizu (1973)
- 6[6] 4911841973
- 7Aviles et al. (2010)
- 8[8] 7113892010