Surface charging of thick porous water ice layers relevant for ion sputtering experiments
A. Galli, A. Vorburger, A. Pommerol, P. Wurz, B. Jost, O. Poch, Y., Brouet, M. Tulej, N. Thomas

TL;DR
This study investigates how thick porous water ice layers charge under ion and electron bombardment, affecting sputtering processes relevant to understanding the exospheres of Jupiter's icy moons.
Contribution
It provides new measurements of surface charging and electric conductivity of thick porous ice, highlighting their impact on sputtering and exosphere formation.
Findings
Electron irradiation influences surface charging significantly.
Sputtering yields are comparable to previous compact ice experiments.
Surface charging timescales affect sputtering efficiency.
Abstract
We use a laboratory facility to study the sputtering properties of centimeter-thick porous water ice subjected to the bombardment of ions and electrons to better understand the formation of exospheres of the icy moons of Jupiter. Our ice samples are as similar as possible to the expected moon surfaces but surface charging of the samples during ion irradiation may distort the experimental results. We therefore monitor the time scales for charging and dis- charging of the samples when subjected to a beam of ions. These experiments allow us to derive an electric conductivity of deep porous ice layers. The results imply that electron irradiation and sputtering play a non-negligible role for certain plasma conditions at the icy moons of Jupiter. The observed ion sputtering yields from our ice samples are similar to previous experiments where compact ice films were sputtered off a…
Click any figure to enlarge with its caption.
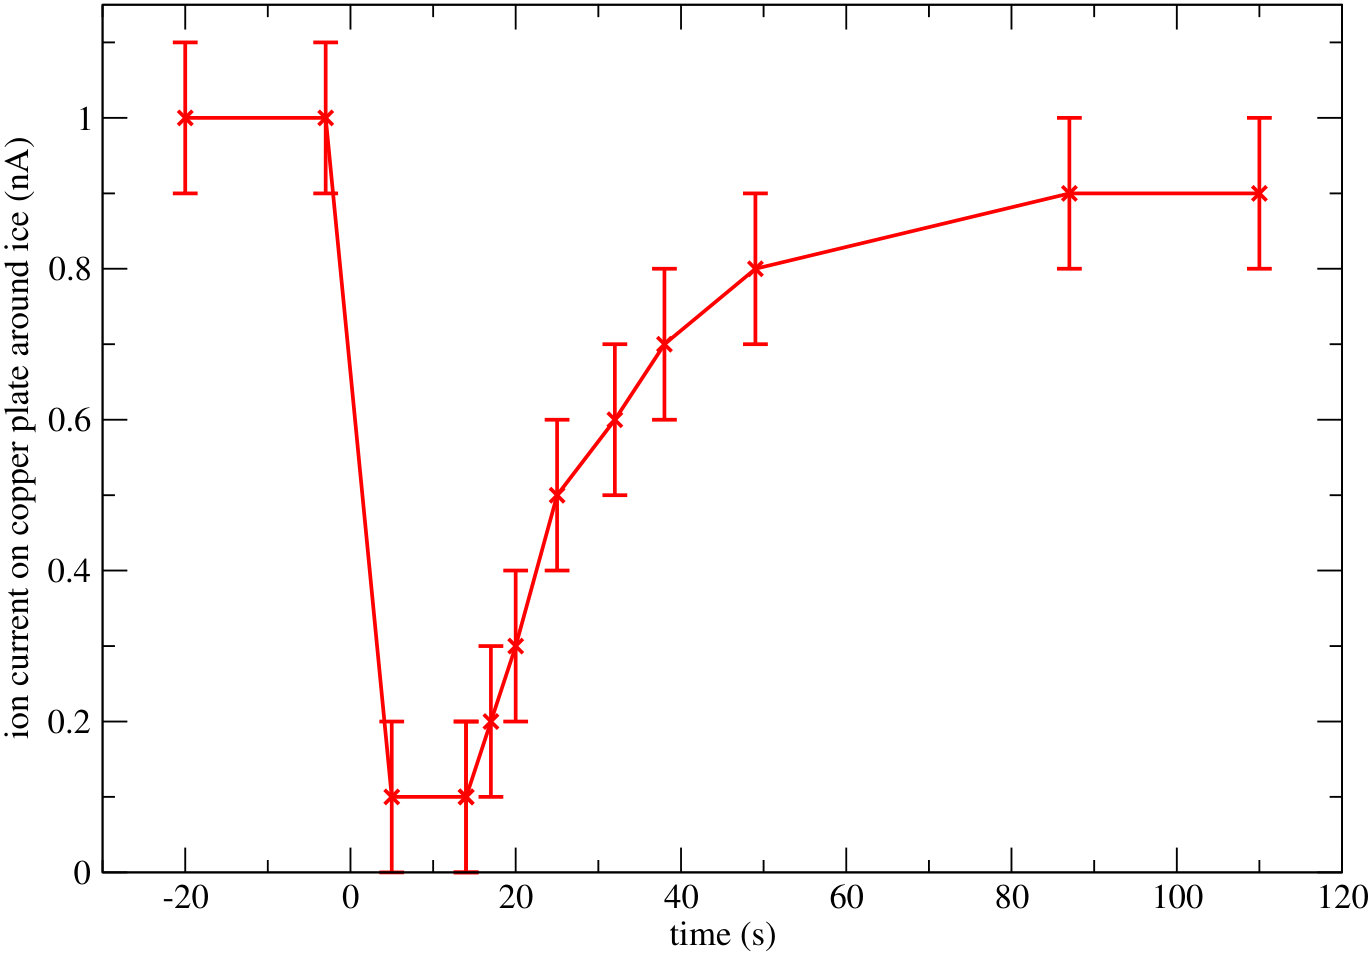 Figure 1
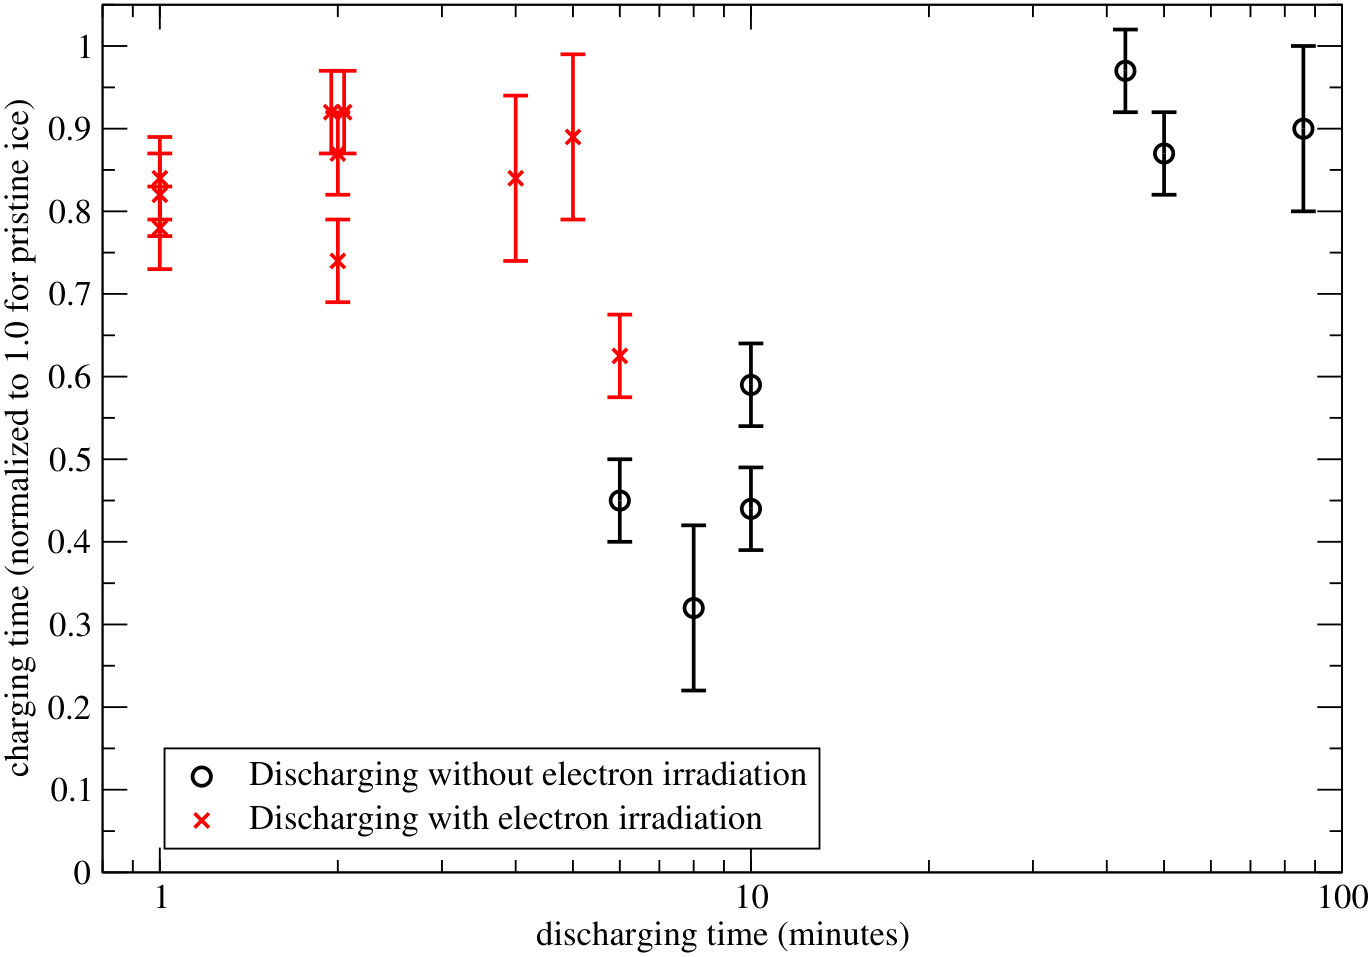 Figure 2
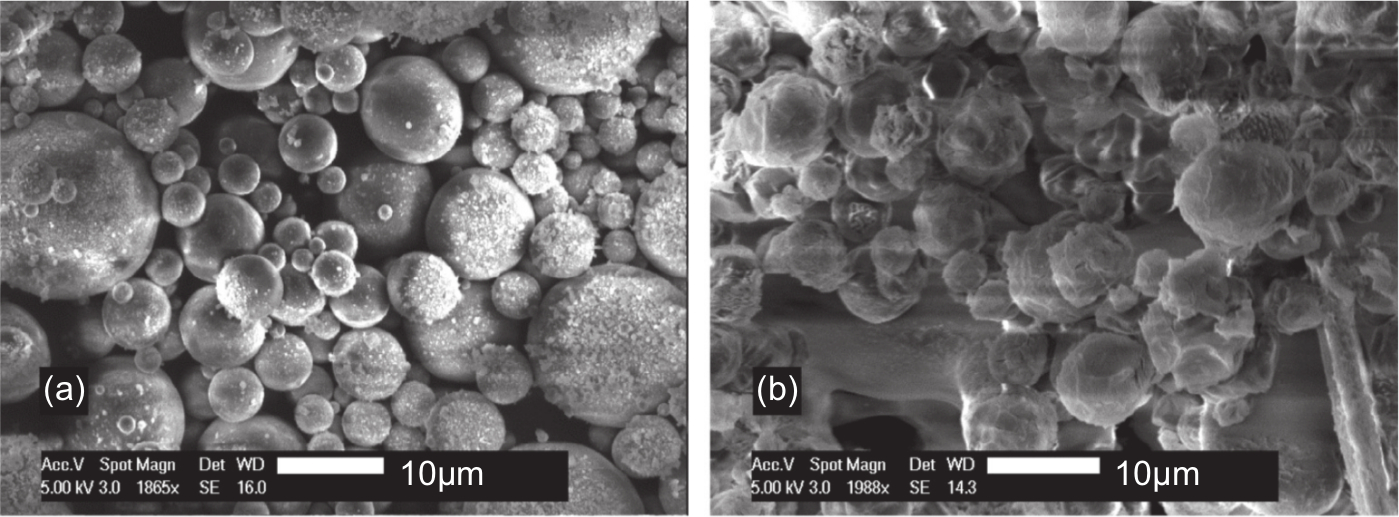 Figure 3
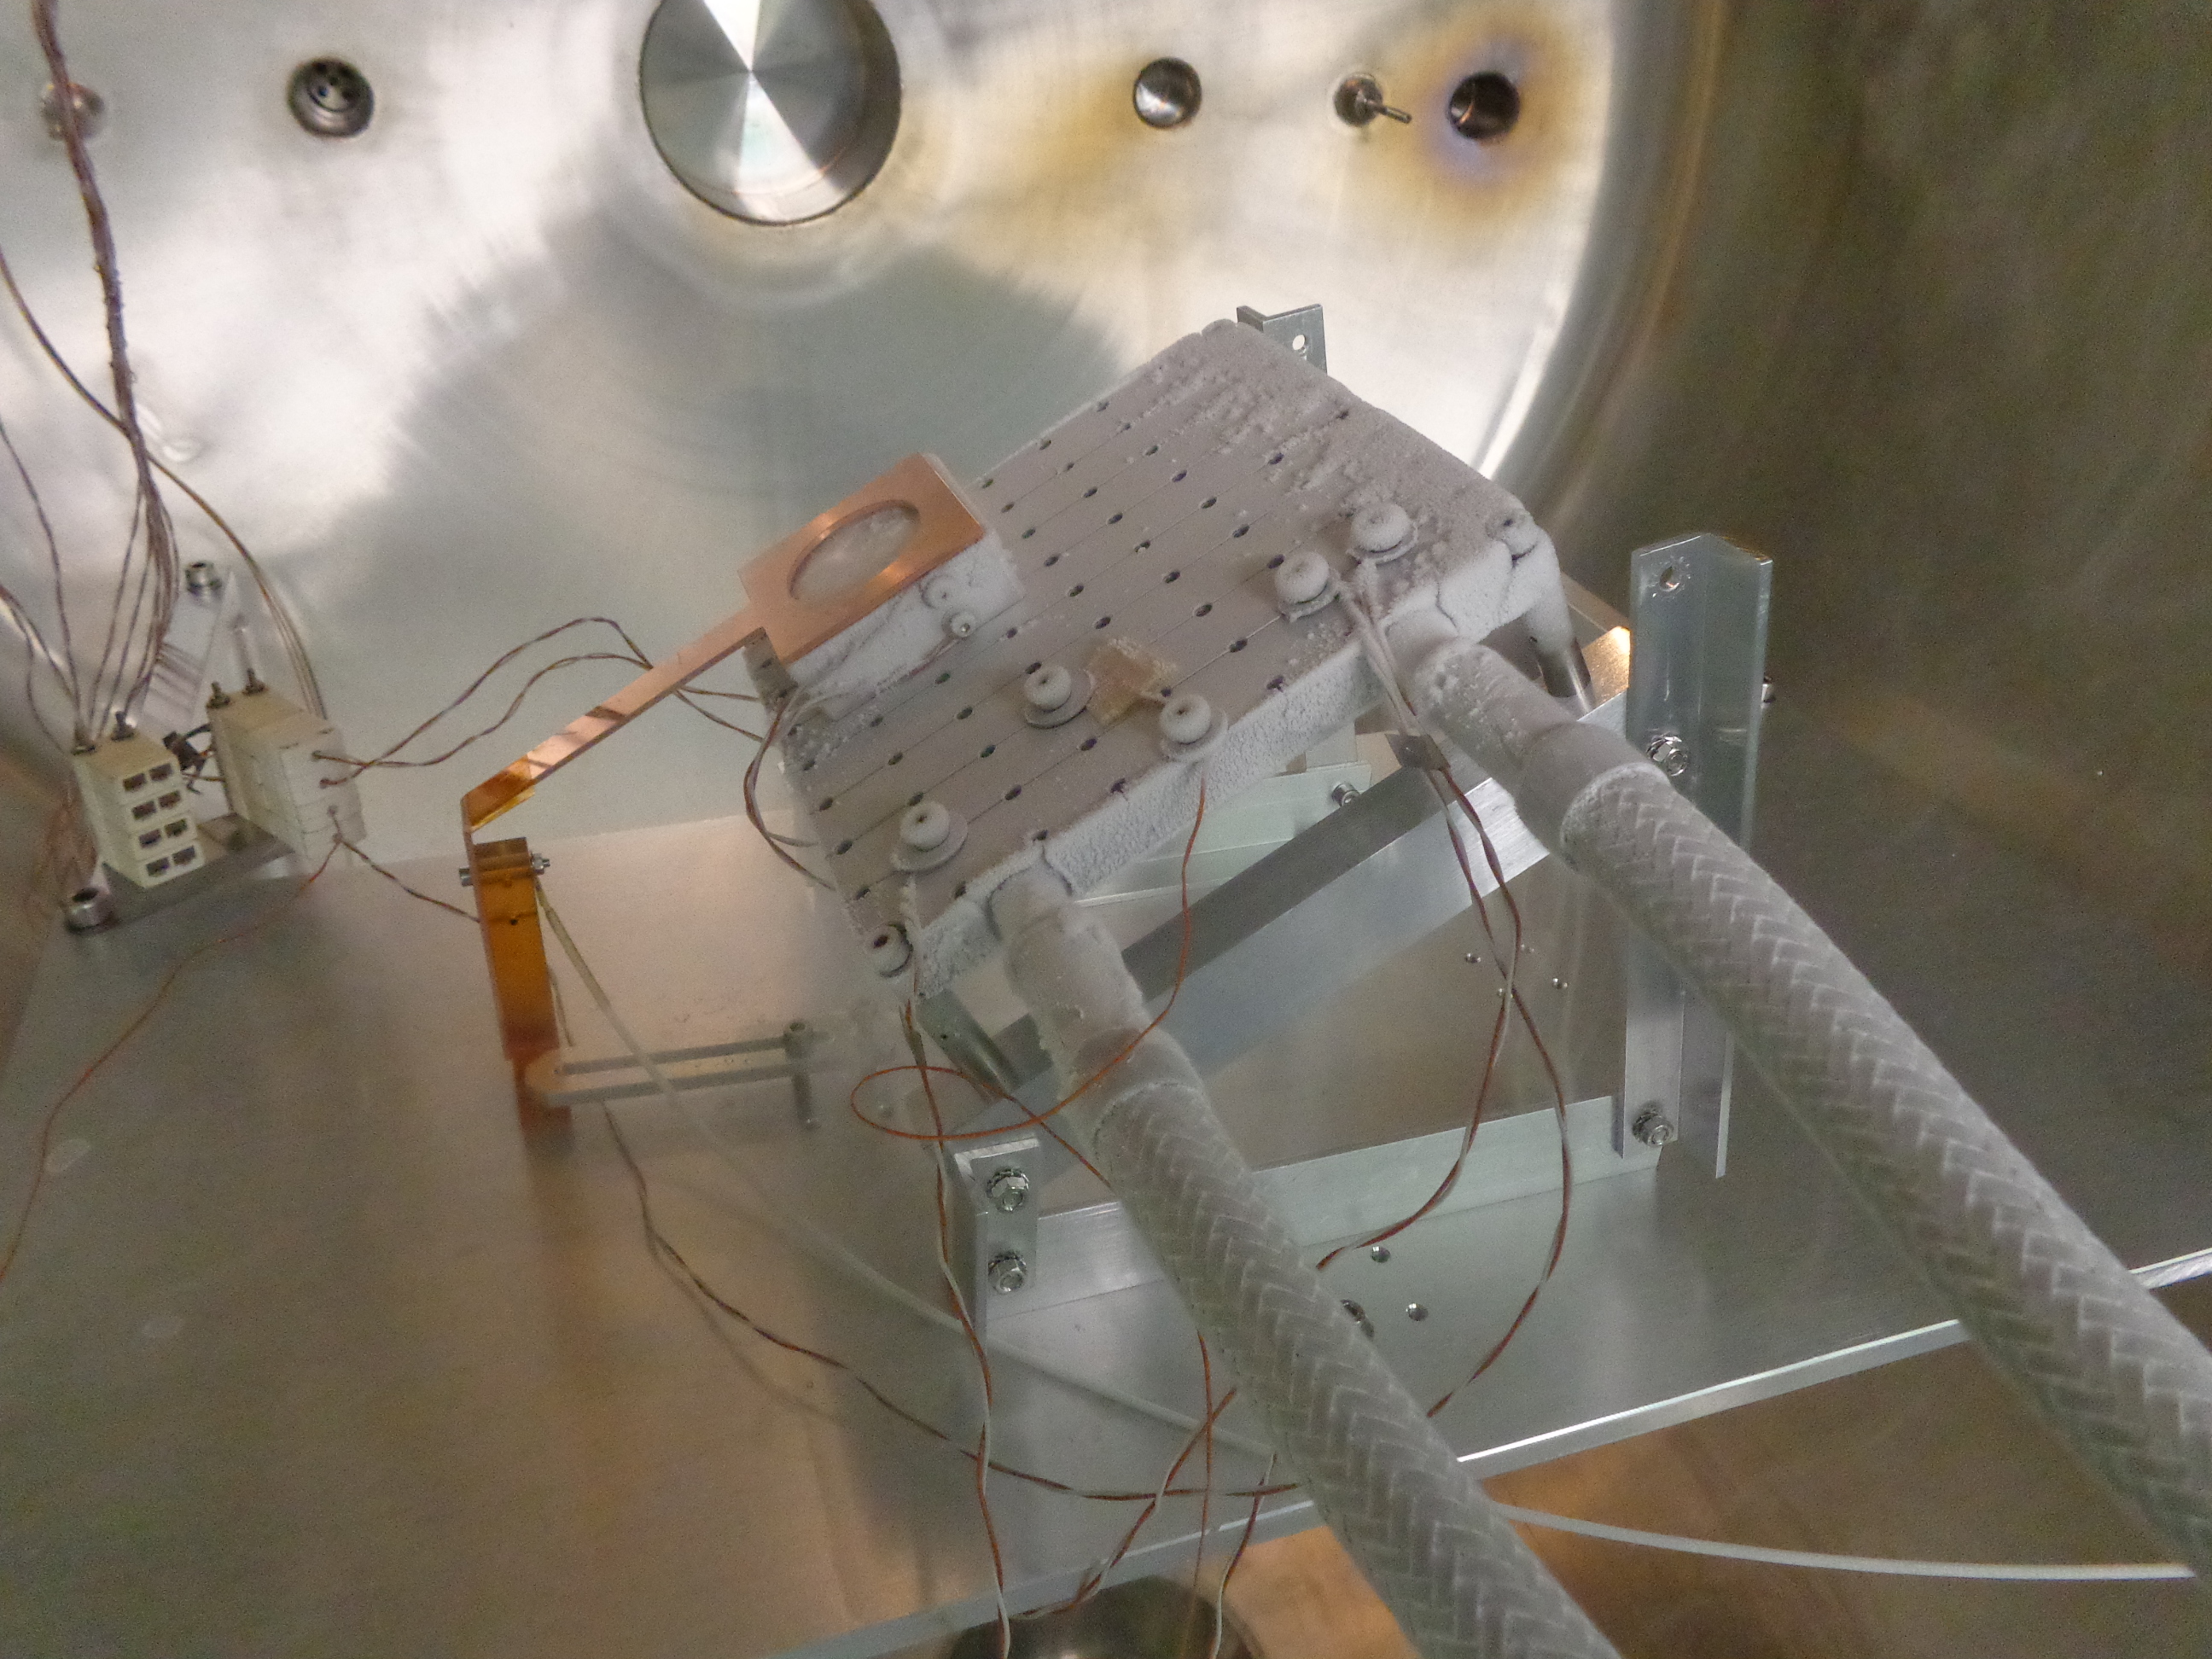 Figure 4
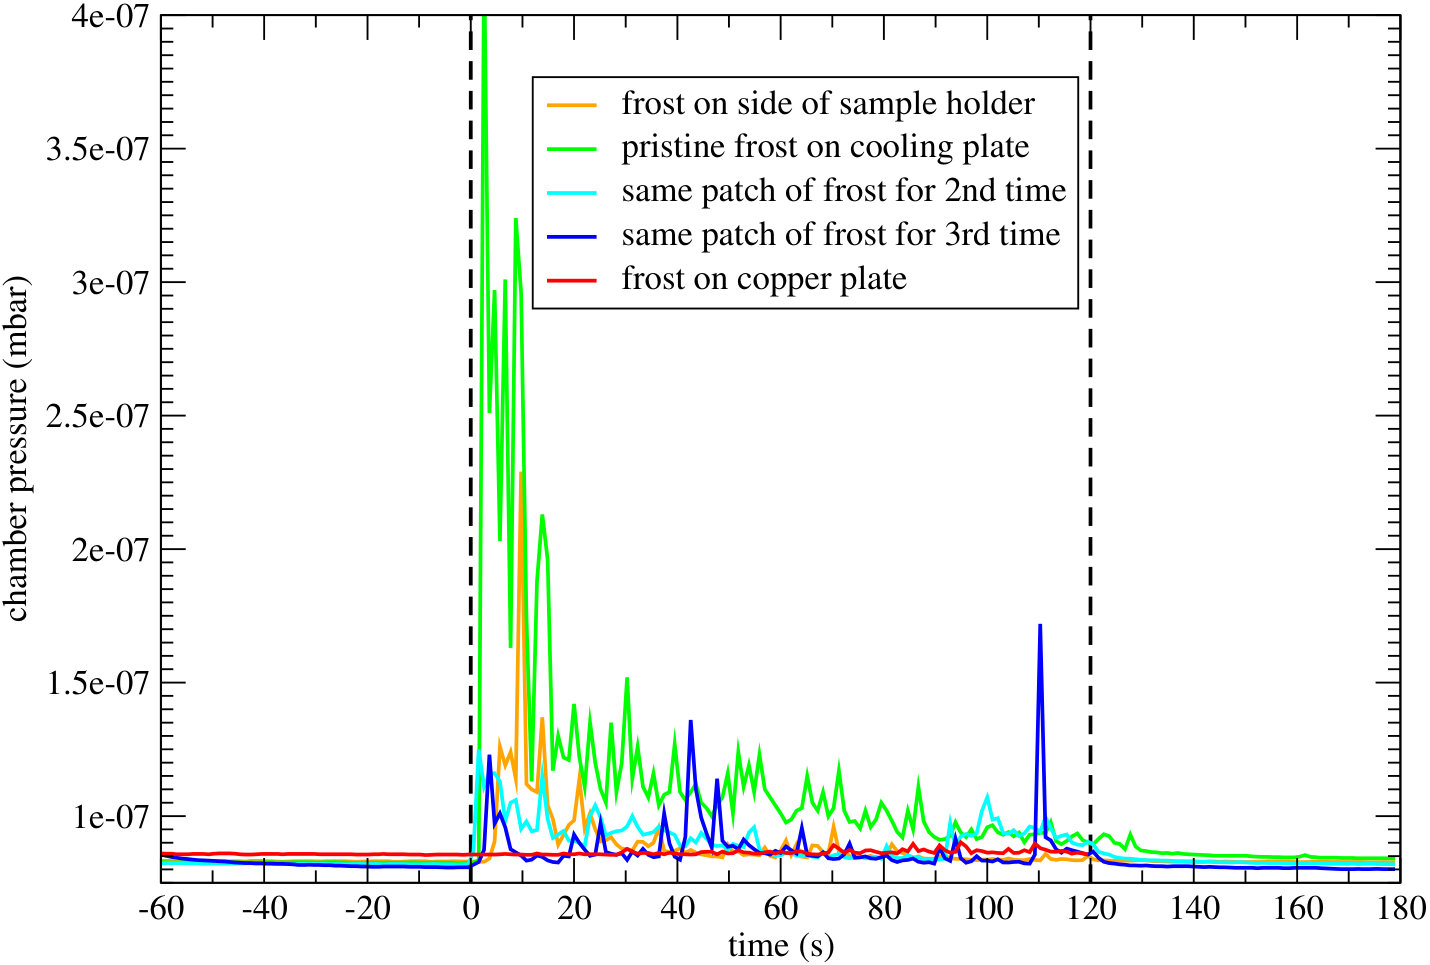 Figure 5
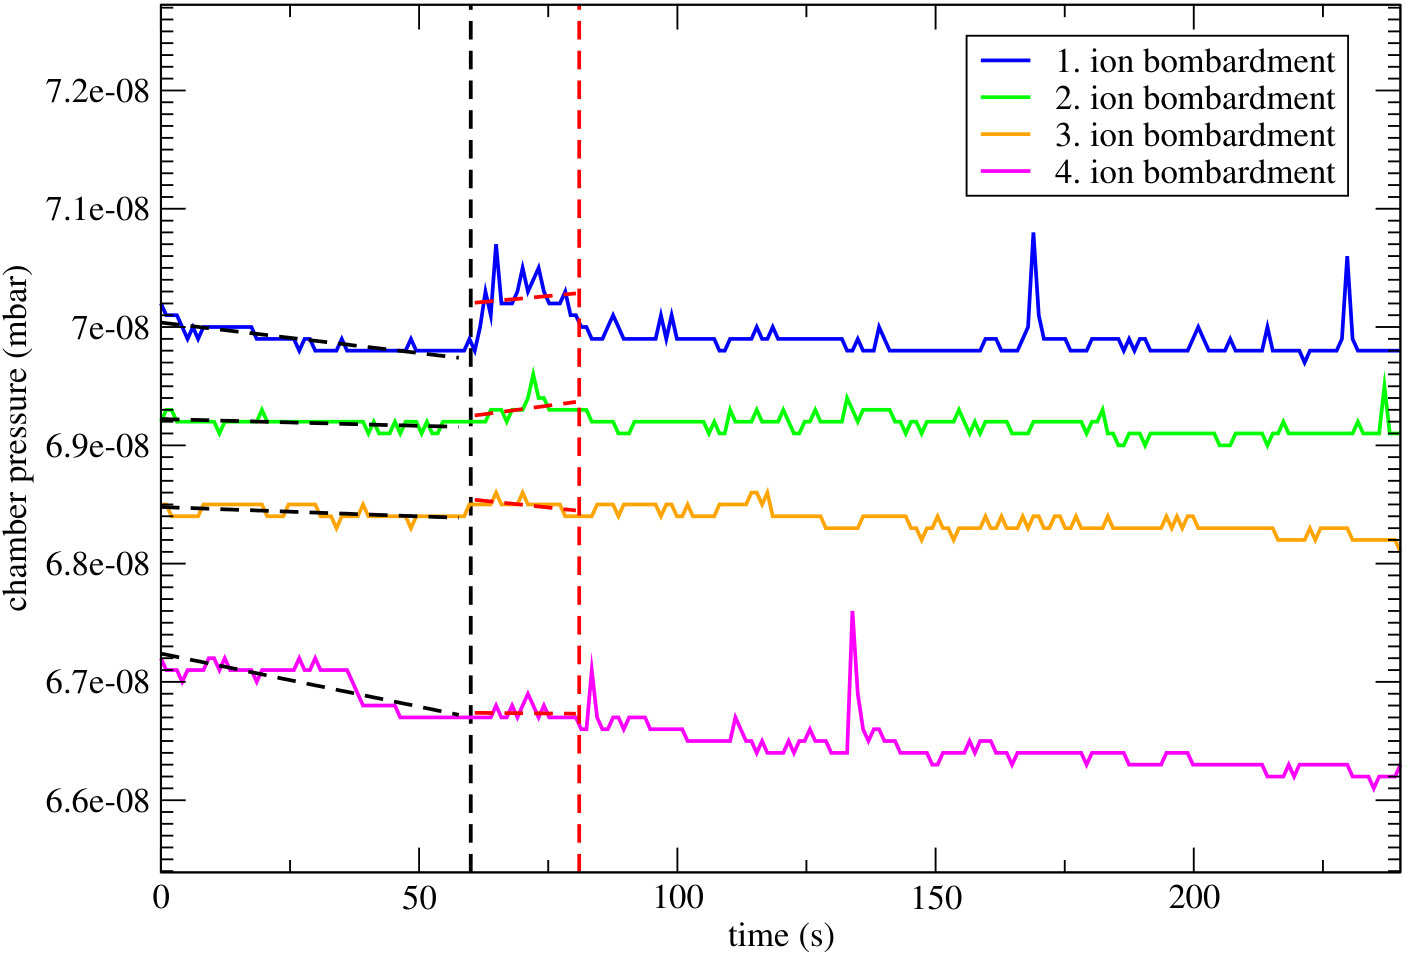 Figure 6
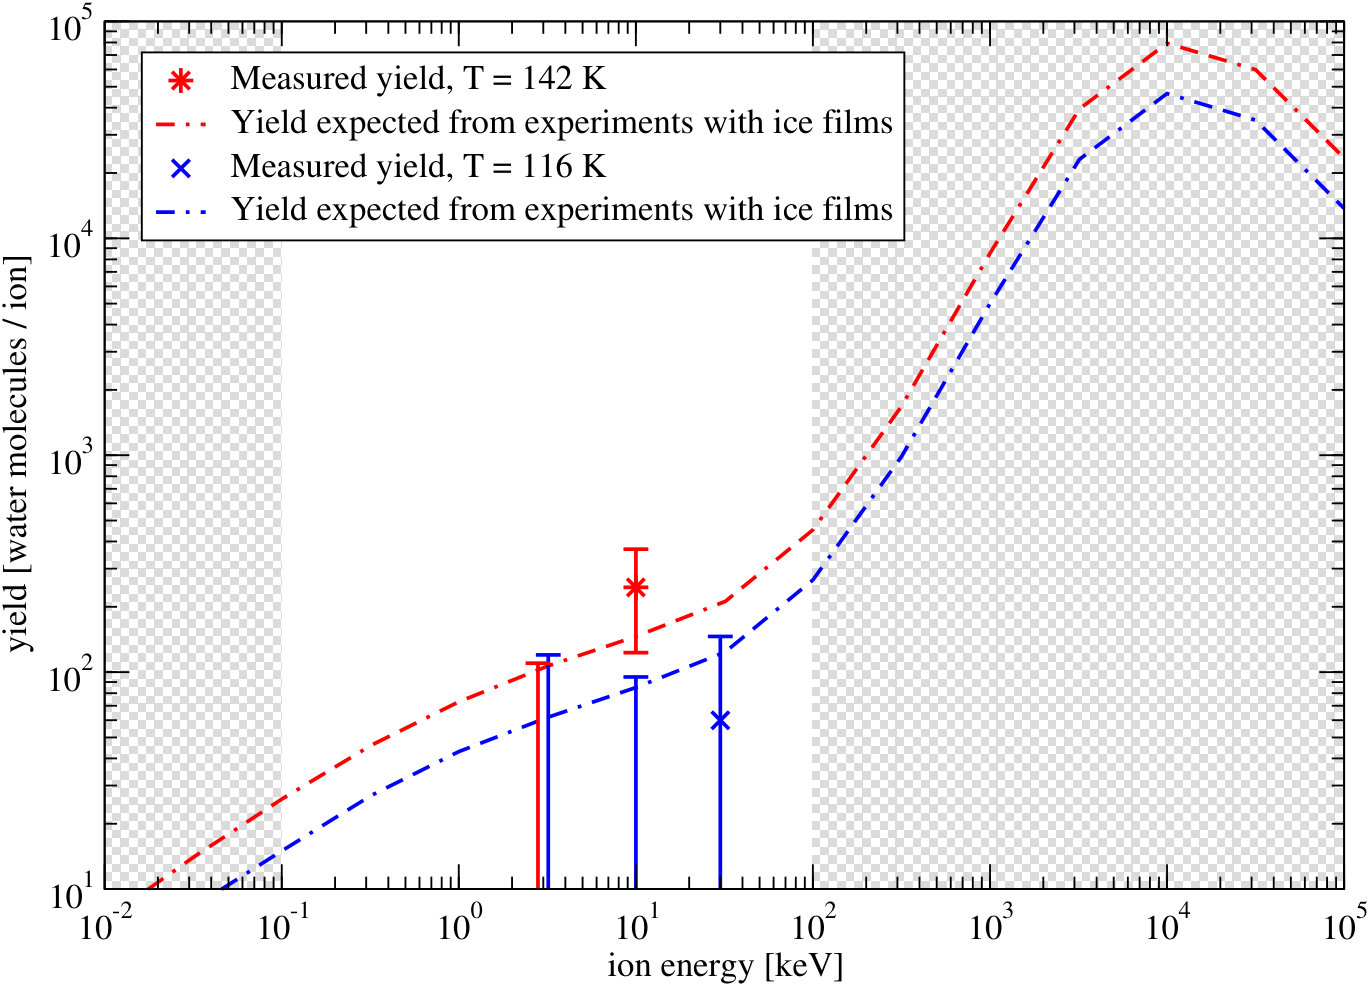 Figure 7
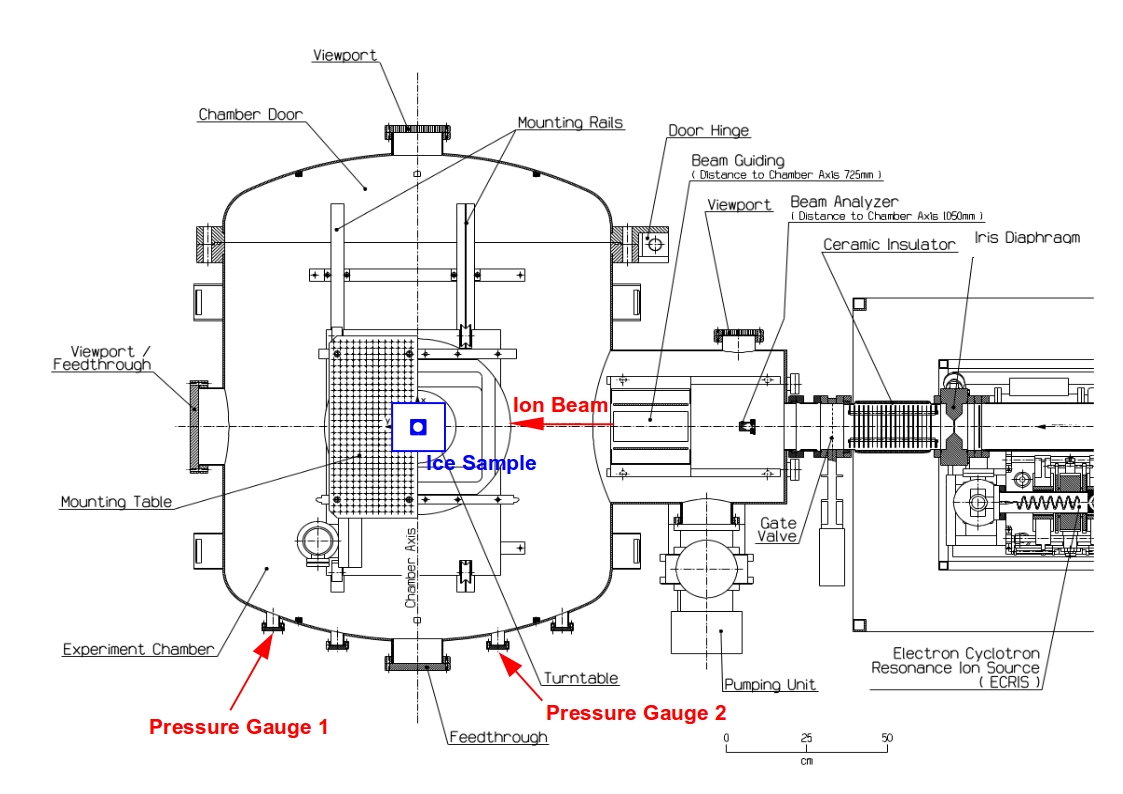 Figure 8
| (keV) | (nA) | (K) | (g cm-3) | (s) | |
|---|---|---|---|---|---|
| 3 | 0.2 | ||||
| 10 | 0.2 | ||||
| 3 | 0.29 | ||||
| 10 | 0.29 | ||||
| 30 | 0.29 |
| (K) | (g cm-3) | (minutes) |
|---|---|---|
| 0.2 | ||
| 0.29 | ||
| 0.29 |
Peer Reviews
No public reviews on file for this paper yet. If you reviewed it on a platform where reviews are public (OpenReview, ICLR, NeurIPS, ICML), you can paste yours below so the community can read it here.
Videos
No videos yet. Explain this paper in a talk, walkthrough, or lecture? Add one.
Surface charging of thick porous water ice layers relevant for ion sputtering experiments
A. Galli111Corresponding author, E-mail address: [email protected]
A. Vorburger
A. Pommerol
P. Wurz
B. Jost
O. Poch
Y. Brouet
M. Tulej
N. Thomas
Physikalisches Institut, University of Bern, Bern, Switzerland
Abstract
We use a laboratory facility to study the sputtering properties of centimeter-thick porous water ice subjected to the bombardment of ions and electrons to better understand the formation of exospheres of the icy moons of Jupiter. Our ice samples are as similar as possible to the expected moon surfaces but surface charging of the samples during ion irradiation may distort the experimental results. We therefore monitor the time scales for charging and discharging of the samples when subjected to a beam of ions. These experiments allow us to derive an electric conductivity of deep porous ice layers. The results imply that electron irradiation and sputtering play a non-negligible role for certain plasma conditions at the icy moons of Jupiter. The observed ion sputtering yields from our ice samples are similar to previous experiments where compact ice films were sputtered off a micro-balance.
keywords:
Ices, Jupiter satellites, Experimental techniques, Surface charging, Sputtering
††journal: Planetary and Space Science
1 Introduction
The vast majority of celestial objects in the outer Solar System are bodies with ice-rich surfaces. This includes icy moons like Europa, Ganymede, Callisto, Enceladus, Triton, but also the Trans-Neptunian Objects and comets. The surface of these objects directly interacts with the space environment, resulting in sputtering, radiolysis, and sublimation. These processes lead to a tenuous, surface-bound atmosphere. For the Galilean icy moons, it is often referred to as ‘exosphere’ since the mean free path length usually is larger than the atmospheric scale height (Marconi, 2007; Plainaki et al., 2012). A few species of these atmospheres have been measured by remote sensing techniques. At Callisto, only CO2 has been detected so far, with a surface pressure as low as 10*-8* mbar (Carlson, 1999). For Ganymede and Europa, Hall et al. (1998) reported the detection of oxygen airglow, implying atmospheric O2 pressures on the order of 10*-8* mbar (column densities of several 1014 cm*-2*). Atomic oxygen, one to two orders of magnitude more tenuous, was observed by Hall et al. (1995) at Europa. The O and O2 column densities of Europa were later confirmed during the CASSINI flyby with the Ultraviolet Imaging Spectrograph (Hansen et al., 2005). A tenuous Na and K atmosphere around Europa was detected with ground-based observation in the visible spectral range (Brown and Hill, 1996; Brown et al., 2001). Barth et al. (1997) reported the detection of atomic hydrogen in Ganymede’s atmosphere with the Galileo ultraviolet spectrometer, whereas Spencer et al. (1995) and Noll et al. (1996) reported the detection of condensed or trapped O2 and O3 in the surface of Ganymede. The latter discovery showed that the atmospheric oxygen species are indeed surface-bound.
Unfortunately, properties of ices at low pressures and temperatures, such as the sputtering efficiency due to ion bombardment, are difficult to predict theoretically and it is not always clear how results from laboratory experiments should be applied to real ice surfaces in the Solar System (Johnson et al., 2004). This limits the predictive capability of any surface and atmosphere model. The JUICE mission (ESA, 2014), scheduled to visit Europa, Ganymede, and Callisto in the years 2030–2032, will allow to directly sample the particles ejected from the surface and also to observe the atmosphere at infrared, visible, and ultraviolet wavelengths. The design of instruments would benefit from better constrained parameters for surface release processes.
Over the last two decades, several laboratory experiments simulating particle irradiation of water ice on the surface of icy moons have been performed (Shi et al., 1995; Orlando and Sieger, 2003; Famá et al., 2008; Shi et al., 2012), and these data have been put into the context of planetary science (Johnson et al., 2004; Cassidy et al., 2010). Most approaches aimed at deriving the sputtering yields, i.e., the ratio of ejected water ice molecules per impinging ion or electron as a function of impactor energy. The favourite technique used so far consists of vapour depositing a thin film ( nm) of compact (density g cm*-3*) amorphous ice onto a quartz microbalance (Famá et al., 2008; Shi et al., 2012). The ice film is then gradually sputtered and the observed frequency change of the quartz crystal allows to deduce the sputtering yield. In contrast, we experiment with ions impacting a 0.9 cm thick sample of porous water ice to simulate the regolith on the surface of an icy moon. “Porosity” in this study always implies macroporosity, i.e., micron-sized gaps between grains, as opposed to nano-scale pores within a grain (Rodriguez-Nieva et al., 2011). Our approach allows us to produce samples with chemical impurities and to study the impact of porosity on release processes. So far, sputtering models disagree whether the sputtering yield from a porous solid should be substantially lower (Johnson, 1989; Cassidy and Johnson, 2005) or similar (Cassidy et al., 2013) compared to the same non-porous solid.
Experimental difficulties arising from sputtering experiments with a cm-thick ice sample include a strong surface charging due to ion irradation and a more urgent need to characterize the sample (for instance density, chemical alterations, and possible temperature gradients between the bottom and the surface). Our first sputtering experiments with H*+, O+, O, and Ar+* ions (Galli et al., 2015) indicated that surface charging of the ice sample could affect estimates of the sputtering yield. The charging also limited the number of unbiased experiments per day since the discharging times exceeded one hour for cold ( K) ice if no countermeasures were employed. Our improved set-up for sputtering experiments with porous ice allows us to detect and counteract surface charging caused by ion irradiation. This paper describes the new set-up and presents the first Ar*+* sputtering results obtained with it.
2 Experiment set-up
The MEFISTO test facility for space instrument calibration has been developed over more than a decade (Marti et al., 2001; Hohl, 2002; Hohl et al., 2005). It consists of a vacuum chamber and an electron-cyclotron-resonance ion source. Wieser et al. (2016) examined the charge exchange of an ion beam on an ice surface in MEFISTO to prepare for an energetic neutral atom imaging instrument on board JUICE. We present here how the same test facility and a similar set-up can be used to simulate ion sputtering of porous icy material in space.
2.1 Sample preparation
We prepared porous water ice with the SPIPA (Setup for the Production of Icy Planetary Analogs) setup described as Method #1 by Jost et al. (2016). An ultrasonic nebulizer produces micrometer sized droplets of salty water (99% weight percent de-ionized water and 1% NaCl). We added the NaCl to discriminate sputtering of the salty ice from sputtering of the top frost layer originating from exposure to air. The water droplets were frozen and piled up in a cooled bowl (C) as spherical ice particles with diameters of m (left panel in Fig. 1). Once enough ice was produced, we poured liquid nitrogen into the bowl and stirred up the suspension with a spoon. This method prevented the grains from sintering and allowed us to pour the ice into the sample holder. A microscope image of ice grains after this step is shown in the right panel of Fig. 1. We then compressed the ice in the sample holder with the spoon until we had a smooth surface at the same level as the metal rim. We did this to improve the temperature conductivity compared to the very porous ice in the ice bowl. The bulk density of the final ice sample ranged between 200 and 300 kg m*-3*, corresponding to an average porosity of 75%.
The ice in the sample holder is a realistic approximation for surfaces on the icy moons of Jupiter, considering the limited knowledge about these surfaces. The temperature of the ice in the sample holder was kept at temperatures between 90 and 140 K, representative for the surfaces of Ganymede (Marconi, 2007) and Europa (Rodriguez et al., 2009). The Na content of our ice is representative for ice-rich areas on Europa’s surface (the average mass abundance of Na on Europa’s ridged plains calculates to 2% (Shirley et al., 2010)). Domingue and Verbiscer (1997) assume porosities ranging between 0.4 to almost 1.0 for the Galilean moons to fit solar phase curve reflectances. The authors conclude with respect to Europa: “The high porosity for Europa is consistent with a medium to fine-grained water frost.” The grain size on the surface of the Galilean moons probably is somewhat larger than in our unsintered ice. Calvin et al. (1995) use typically 100 m sized ice grains to fit infrared spectra. When the ion sputtering experiment in the vacuum chamber starts, the ice grains will have undergone sintering to a small degree because of the residence time in the freezer and in the vacuum chamber before the latter is cooled down to experiment temperatures. Moreover, the sample is covered with a thin water frost layer. However, sintering and frost deposition are also considered to reproduce infrared spectra of icy satellites (Grundy et al., 1999).
2.2 Experiment procedure
Figures 2 and 3 show a drawing and a photograph of our experiment set-up. The porous ice is inside an aluminum sample holder with a circular mound (radius 2 cm and depth 0.9 cm). The sample holder itself is screwed onto a steel plate which is being cooled with liquid nitrogen throughout the entire experiment. The ion beam impacts the ice sample at a flat angle of (from the left hand side in Fig. 3). This angle could not be varied during the suite of experiments described here as we tested a simplified set-up without a maneuverable mounting table. We will vary the ion incidence angle in future experiments because the sputtering yield is expected to decrease at steeper angles (see Section 3). Electrostatic deflection plates (labelled “Beam Guiding” in the sketch in Fig. 2) between the beam exit and the ice serve to direct the ion beam to any target area on the ice, the copper ring, or on the cooling plate around it. The copper ring around the ice acts as a Faraday cup measuring the current of impacting ions and electrons. The Faraday cup is operated at a positive potential of 18 V to prevent escaping secondary electrons from distorting the measurement. An electron gun (nominal energy range 100 eV to 10 keV, manufacturer: Kimball Physics) and a mass spectrometer (HAL quadrupole gas analyser, manufacturer: Hiden Analytical) are mounted to the ceiling of the vacuum chamber, 80 cm above the ice sample. The electron gun is necessary to counter the surface charging effect due to ions. The photograph in Fig. 3 was obtained at the start of the experiment when water frost from the ambient air had condensed on all cold surfaces. Afterwards we closed the chamber and started fast evacuation. A close-up image of the ice sample obtained with a webcam was saved in a regular interval. Because the electron gun, the mass spectrometer, and the ion beam require a vacuum pressure of mbar or lower we started sputtering experiments only after pumping and cooling for roughly 20 hours. The experiment usually ran during one week.
Throughout the measurements we relied on temperature sensors to monitor the temperature of the chamber wall, the cooling plate, and of the ice sample holder (note the wires attached to screws in Fig. 3). The surface temperature of the ice cannot be measured with a sensor as the latter would introduce a heat source to the porous ice and commercial infrared radiometers are usually not sensitive to surface temperatures below 170 K (Brocard, 2008). Nevertheless, the effective surface temperature during sputtering experiments must have been close to the temperature measured on the sample holder for the following reason: The saturation vapour pressure for water frost at 153 K is mbar (Andreas, 2007). The chamber pressure reached this level after 20 hours and the measured temperature was 143 K. We did not observe sublimation of the ice in the sample holder during 8.5 hours at these conditions. The true surface temperature of the ice therefore must have matched the measured temperature of the sample holder to better than 10 K.
Due to surface charging, an ion beam that is initially directed at the centre of the ice is deflected sideways until it hits the copper ring. We either waited for the ice in the sample holder to discharge on its own or we switched on the electron gun to neutralize the charged surface. We continuously monitored the temperature sensors, the chamber pressure, and the current on the Faraday cup above the ice. From the timeseries of the current we derived the charging and discharging timescales of the ice sample at different temperatures. Two different pressure gauges at different places were used to measure the chamber pressure. Pressure Gauge 1 in Fig. 2 is a Stabil-Ion pressure gauge measuring at an accuracy of 10% and at a time resolution of 1 s, whereas Pressure Gauge 2 is a less precise baffled cold cathode gauge. Sputtering of the water ice leads to a pressure rise in the vacuum chamber. To detect the small pressure increase due to ion sputtering, only the Stabil-Ion pressure gauge was found to be precise enough. The pressure rise due to electron irradiation could be detected by both pressure gauges because the electron flux was orders of magnitude higher than the ion flux.
3 Theory
3.1 Surface charging and discharging
Since water ice is an excellent insulator, irradiation with positively charged ions will cause a positive surface charge in spite of the added NaCl salt. If the electric field created by the implanted ions on the ice surface is homogeneous, the ice in the sample holder can be considered a parallel plate capacitor and the charging time calculates to
[TABLE]
In the above equation, is the ion current, F m*-1* is the vacuum permittivity, is the relative permittivity of cold porous ice, = 0.009 m is the thickness of the ice layer, and = = 0.0013 m2 is the ice surface area inside the sample holder. Upon irradiation with ions, the ice surface will charge up to an average surface potential that will deflect any additional ion onto the copper ring around the ice. If we again use the parallel plate capacitor as a model, this surface potential is related to the acceleration voltage of the ions via
[TABLE]
with the incidence angle between the ion beam and the ice plane. The other unknown in Equation 1 is . In this study, we will only consider the real part of , since its imaginary part is orders of magnitude lower (Mätzler et al., 2006). Shi et al. (2012) adopted the value of from Wang et al. (2008) for compact water ice. A similar value of is recommended by Mätzler et al. (2006) for ordinary water ice (Ih) below K. The permittivity of water ice hardly varies with temperature for the range of 90 to 140 K considered in our study (Mätzler et al., 2006). The density of our ice samples closely resembles dry snow. We will therefore rely on Sugiyama et al. (2010) who measured at microwave frequencies for dry snow with a density of 300 kg m*-3*. This agrees with the value given by Brouet et al. (2016) for pure porous water ice with 300 kg m*-3* bulk density. Equations 1 and 2 then yield s and a surface potential of kV for an ion beam with nA and an energy keV.
Shi et al. (2010, 2012) directly measured the surface potential of amorphous water ice films with a Kelvin probe. They vapour deposited ice films with hundreds to thousands of nm thickness onto the tip of a microbalance cooled to temperatures between 20 K and 160 K. They found that the surface potential increased asymptotically to an equilibrium during irradiation with an Ar*+* beam. The timescale to charge the ice surface was hundreds of seconds. The formulae describing the charging of the ice derived by Shi et al. (2010, 2012) cannot be directly applied to our experiments because of the different types of samples and the completely different dimensions. In particular, the ice surface potential derived by Shi et al. (2010) contains the distance between the trapped charges, i.e., ionization depth, and the metal substrate underneath the ice. The formula describes well the charging of ice layers whose thickness has the same order of magnitude as the ionization depth (200 nm for 100 keV Ar*+*). In our case, however, this distance would be on the order of 0.9 cm and the asymptotic potential would be much larger than the corresponding energy of the ions. In reality, the surface potential will increase to the fraction of the ion acceleration voltage sufficient to deflect subsequent ions away from the ice onto the surrounding metal surfaces.
When the ion bombardment is stopped, the surface discharges in the most simple case with a decay constant ,
[TABLE]
If the ice surface is interpreted again as a parallel plate capacitor (see Eq. 1), the observed time constant for discharging is related to the static conductivity of the porous ice via
[TABLE]
Petrenko (1993) performed a meta-study of previous conductivity measurements for ordinary water ice (Ih). The conductivity depends on temperature, , with the activation energy ranging from 0 to 0.7 eV. The value is dominated by the chemical impurities (Cl*-* concentrations for instance) inside the ice; the more pure the ice, the larger and the smaller . Because these impurities are hard to quantify and control, the static conductivity of water ice varies by orders of magnitude ( to S m*-1* at K for single crystals) between different studies (Petrenko, 1993). Likewise, Stillman et al. (2013) report to S m*-1* for meteoric ice cores from Antarctica and Greenland for temperatures between 210 and 220 K.
Shi et al. (2012) created amorphous water ice films of 1000 to 3000 monolayers (corresponding to 300 to 900 nm thickness) on a microbalance and verified that the ice did not charge up when the ion penetration depth reached the ice layer thickness, i.e., the energetic ions traversed the ice and hit the gold substrate of the microbalance underneath the ice. For ice films thick enough to charge up, the authors found that the discharging followed an exponential decrease with two different decay constants, representing deep and shallow charges in the ice. The half-life of the shallow charges ( s) was independent of ice temperature, but the much longer half-life of the deep charges decreased with temperature. Bu and Baragiola (2015) studied the surface potential and proton transport in similar water ice films and found a constant permittivity for the ice between 30 and 95 K. In some cases Shi et al. (2012) also observed a dielectric breakdown once the surface voltage exceeded hundreds of Volt. We do not expect this phenomenon for our experiments because our ice sample is 10,000 times thicker. Such breakdowns may, however, contribute to the strong signals of frost being detached from metal surfaces (see Section 4.5).
3.2 Ion sputtering yield
The experiment set-up (Fig. 2) allows us to assess the sputtering yield from the ion beam hitting the ice surface by monitoring the total pressure in the vacuum chamber. If we assume that a constant particle source in addition to the residual outgassing rate is activated at time and turned off again at time we expect the following evolution of the chamber pressure :
[TABLE]
[TABLE]
with m3 the volume of the chamber and antechamber in Fig. 2, s*-1* the effective pumping speed of the turbomolecular pump, and the temperature of the chamber walls K. Ejected particles that happen to re-impact a cold surface (the cooling plate or the nitrogen-conducting tubes) will be cold trapped and thus not appear in the observed pressure rise. We neglected this effect since the ratio of cooled surfaces to surfaces at 300 K amounts to less than 2%. The time scale established from Eq. 6 is s. The new equilibrium pressure reached due to sputtering, , is linked to the sputtering yield (ratio of ejected molecules per impacting ions) by the ideal gas law:
[TABLE]
The number of impacting ions is easily measured via the ion beam current and denotes the elementary charge.
To relate our sputtering yields to previous experimental studies we will rely on the semi-empirical formula derived by Famá et al. (2008). It serves as a summary of previous sputtering experiments with compact water ice films. For ion energies below 1 keV, the sputtering yield of ions in water ice can be described by a cascade of elastic collisions, whereas at higher ion energies the so-called electronic sputtering dominates. The total sputtering yield (water molecules per incident ion) is the sum of the two contributions. Famá et al. (2008) derived an expression including both contributions, which fit their laboratory measurements and results of other research groups (Johnson and Liu, 2010) for H*+, He+, N+, O+, Ne+, and Ar+* beams:
[TABLE]
Equation 8 quantifies the sputtering yield as a sum of elastic and electronic sputtering, described by the nuclear stopping power and the electronic stopping power . The sputtering yield depends on energy , mass of impactor , atomic number of impactor , the incidence angle from the surface normal ( in our experiment set-up), and temperature . For the sublimation energy of water, , Famá et al. (2008) assumed 0.45 eV. The effective cross-section for low energy recoils, Å2, the activation energy, eV, and are constants. The parameter describing the angular dependence calculates to for Ar*+. From the angular dependence in Eq. 8 one expects an order of magnitude higher sputtering yields at ion incidence angles around 80∘* than for perpendicular ion impacts. The condition is that the ice sample is microscopically smooth. Küstner et al. (1998) studied graphite surfaces of varying roughness on a m scale and found that the sputtering yield increased only by a factor of 2.5 when the ion incidence angle increased from 0*∘* to 80*∘. For a smooth graphite surface, they confirmed that increases by more than a decade. In the following section, we will compare our new experiment results for Ar+* to the predictions in Eq. 8.
4 Results and discussion
We first describe the measured charging and discharging time scales for the ice before proceeding to our first results on the ion and electron sputtering.
4.1 Surface charging
When the ion beam was directed at the centre of the ice sample, the ion current measured on the copper ring initially dropped to zero. After a few seconds, depending on the temperature of the ice, the ion current increased to reach a stable value of 80% to 90% of the ion current measured when the beam was directed at the copper ring. This indicated that most ions were deflected by the surface potential off their original line of flight onto the copper ring. Figure 4 shows a typical example of this surface charging for a 10 keV Ar*+* beam with a total current of nA directed at ice of K. The measured charge versus time can be described by an exponential increase
[TABLE]
with the charging time constant . Table 1 lists the half-life times = for ions to charge the ice sample for the five combinations of ice temperatures and ion energies studied. The half-life was defined by the time when half of the ion beam current was measured on the copper ring surrounding the ice. The ice sample with higher porosity and temperature took significantly longer to charge up.
The fraction of the ion beam not hitting the ice follows Equation 1 for a plane parallel capacitor charging up. However, the linear increase of charging time with ion energy expected from Equation 2 was not observed in measurements. The asymptotic rise to an equilibrium also agrees with the observations by Shi et al. (2010, 2012) for compact water ice films. The observed charging timescales on the order of 10 seconds are similar to our simple model of a capacitor, in contrast to the 100–1000 s observed for a water ice film (Shi et al., 2010). The results in Table 1 are ambiguous because the change in timescale could be attributed to the density or the temperature change. But since the permittivity of dry snow increases with density (Mätzler et al., 2006), we would expect that more compact ice should take longer to charge up (Equation 1). We therefore deem it more likely that the temperature difference between the two ice samples caused the different charging timescale. Such a temperature effect on electric properties of the ice does not follow from observations of compact water ice (Mätzler et al., 2006). Since we cannot quantitatively predict this effect, the target area of the ion beam had to be monitored simultaneously during all ion sputtering experiments. The signal caused by ion sputtering (see Section 4.4) had to be determined in the first seconds () during ion bombardment.
4.2 Discharging of the ice sample
The ice surface must be discharged if we want to perform unbiased ion sputtering experiments. The electron gun achieved this task, 60 seconds at an electron energy of 50 or 100 eV proved sufficient to completely discharge the surface. Subjecting the ice surface to a longer time of electron irradiation did not have an impact on the behaviour of measured ion beam current versus time in subsequent ion sputtering experiments. We also studied the natural discharge time of the ice sample without electron irradiation. The discharging time increased at low temperatures, as found by Shi et al. (2012) for compact water ice films. The decay times observed for thick porous ice were the same order of magnitude as the short decay component found by Shi et al. (2012). Our measurements did not allow the distinction of two separate decay constants as described by Shi et al. (2012).
Since we could not measure the ice potential directly, we had to resort to an indirect measurement. After fully charging the ice surface we waited for 1 to 100 minutes before directing the ion beam again at the ice. If the surface had been completely discharged in the meanwhile, the new charging time was identical to the one observed for pristine ice. Otherwise the new charging time was only a fraction (0.0 to 1.0) of the original charging time. Figure 5 illustrates the natural discharge times without simultaneous electron irradiation (black circles) and the effect of electron irradiation on discharging (red “x” symbols). In both cases, charging times are plotted against the discharging times in minutes. The charging times are normalized to 1.0 for pristine ice. The results of the discharging experiments without electron irradiation are summarized in Table 2. The experiments at cold temperatures (89 K) were performed without the copper ring around the ice sample, therefore the surface charging properties could not be measured accurately. This value for the discharging time is only an upper limit.
Our results imply via Equation 4 that the static conductivity of porous water ice decreases from S m*-1* at 142 K to S m*-1* at 116 K. By comparison, the conductivity of pure deionized water at room temperature is on the order of S m*-1* and the mean conductivity of the oceans on Earth is 3.27 S m*-1* (Kaye & Laby, 2005). If we assume that the conductivity of the porous ice depends on temperature according to (Stillman et al., 2013; Petrenko, 1993), this implies an activation energy of 0.08 eV. At temperatures representative for the Galilean moons, the static conductivity of a frost-covered porous ice surface is on the order of S m*-1* or even lower. This means that an icy moon without ionosphere can be considered a non-conducting obstacle to the surrounding plasma. If such a moon has neither an intrinsic magnetic field nor slows down the plasma by mass loading (Jia, 2015), it would create a lunar-type of wake in the plasma (Halekas et al., 2015). Ganymede, however, has a magnetic field (Kivelson et al., 1997) and Europa, Ganymede, and Callisto also have ionospheres with to m*-3* peak electron density close to the surface (Kliore et al., 1997; Eviatar et al., 2001; Kliore et al., 2002). The surface charging observed in laboratory experiments therefore will not take place on a macroscopic scale on these moons. Any spot exposed to ion irradiation will also be exposed to electrons and solar UV light. The actual surface potential will be determined by the balance of incoming and outgoing currents.
4.3 Electron sputtering
The signal caused by electrons sputtering the water frost on the metal surface was well visible via a pressure rise in the chamber. The height of the pressure rise depended on the energy and the flux of the electrons. The signal implied water molecules per incident electrons at 100 eV via Equation 7. The pressure rise observed with the cold cathode gauge at a lower precision (see Section 2.2) yielded . This independent measurement at another place in the vacuum chamber confirmed the validity of the pressure rise approach. However, we did not yet quantify the electron sputtering yield as a function of electron energy. We also will have to narrow the electron beam to compare the sputtering signal from the ice sample against the signal from the frost on metal surfaces. This comparison will decide if the electron sputter behaviour depends on ice properties. In the present study, we used a completely defocused electron beam to ensure surface neutralization. Contrary to ion irradiation, the sputtering caused by electrons does not choke itself off because of the secondary electrons emitted from the surface. For electron energies between roughly 50 eV and 10 keV the sputtering yield of secondary electrons is larger than 1.0 (Jurac et al., 1995), thus more electrons will leave the ice than impacting the ice and newly arriving electrons will not be deflected off the surface. The (positive) surface potential due to electron irradiation will not exceed a few Volt because secondary electrons have energies around a few eV almost independent of the energy of the impactors (Jurac et al., 1995). This remaining potential is irrelevant for a subsequent sputtering experiment with keV-energy ions. They cause a positive surface potential three orders of magnitude higher (see Section 3.1) than the few Volt due to secondary electrons.
4.4 Ion sputtering
The surface charging must be taken into account for an unbiased ion sputtering experiment. When the ice surface is charged the majority of the ions will not hit the ice sample but rather the metal surfaces and frost around the sample. To measure ion sputtering we directed the ion beam at the ice until the surface potential had reached an equilibrium, discharged the ice during one minute with electrons and repeated the measurement. This way we avoided waiting times of one hour after each experiment (see Table 2).
For the cold ice ( K), the charging timescale was too short and the sputtering yield was too low to observe a rise of the chamber pressure significantly higher than the precision of the pressure gauge for all ion energies. From Equation 7 it follows that molecules per ion (see last column in Table 1).
For warmer temperatures ( K) and 10 keV ion energy, we observed a pressure rise in nine consecutive observations. It occurred within the first 3 seconds after the onset of ion sputtering. Figure 6 shows four of these nine measurements as chamber pressure versus time. The black vertical line indicates the moment when the ion beam was directed at the centre of the ice, the red vertical line indicates the time when one charging half-life (21 s) has passed. After that time mark, irregular pressure spikes could occur as long as the ion beam was active. We explain this effect by the ion beam being deflected off the sample and hitting frost deposited on metal surfaces (see Section 4.5 for more details). We could not verify the shape of the pressure rise predicted in Equation 5 because the precision of the pressure gauge of mbar was close to the pressure rise . But linear regressions to the pressure versus time in the minute before ion sputtering (black dashed lines) and for the first 21 seconds during ion sputtering (red dashed lines) allowed us to estimate the needed in Equation 7.
From Fig. 6 we obtain an average mbar for all nine measurements. This implies a sputtering yield of according to Equation 7. The probability that we mistook random fluctuations in chamber pressure for a signal nine times in a row is . For the lower energy of 3 keV, we only could derive an upper limit of . In Fig. 7 we plot the observed sputtering yields or their upper limits against the sputtering yields expected from previous ice sputtering experiments performed with water ice films on a microbalance (Equation 8). Our results are consistent with the notion that sputtering from porous regolith ice is similar to sputtering from compact monolayers of amorphous water ice.
The basic limitation of the current set-up is that only intense sputtering signals with a yield larger than 100 can be detected due to the limits imposed by the residual pressure in the chamber and the precision of the pressure measurement. This means we can only identify sputtering yields for ion energies larger than 10 keV at ice temperatures considered here. Higher ice temperatures would result in a higher sputtering yield, but to simulate the icy moons of Jupiter, temperatures between 80 K and 150 K are mandatory (see Section 3). In future experiments we will combine our set-up with a cooled microbalance opposite the ice sample to collect sputtered material and thus to enlarge our measurement range. Addition of a microbalance will also allow us to directly compare our results to previous ice sputtering experiments with thin water ice layers on a microbalance (Shi et al., 1995; Orlando and Sieger, 2003; Johnson et al., 2004; Famá et al., 2008; Cassidy et al., 2010; Shi et al., 2012).
4.5 Sputtering of irregular frost on metal surfaces
We emphasize the importance of studying and monitoring surface charging of ice during any ion sputtering experiment. Figure 6 demonstrated the danger of mis-interpreting strong signals of detached frost as the regular ice sputtering signal. This became more obvious when we directed the ion beam from the beginning at the copper ring or other frost covered metal surfaces. Figure 8 shows the chamber pressure for five of those cases, the ion beam starts hitting the frost covered metal surfaces at the time . The pressure spikes appear within the first few seconds afterwards and may be up to 1000 times stronger than the nominal sputtering signal if the frost on the cooling plate is targeted. The frost signal from the copper ring is much weaker (red line in Fig. 8) but still stronger than the sputtering signal from the ice sample. The pressure fluctuates rapidly, but the spikes tend to become weaker during ion bombardment and if the same experiment is repeated for the same patch of frost on metal. Our interpretation is that entire flakes of frost are detached from the metal surfaces by electrostatic repulsion. The quadrupole mass spectrometer shows that the pressure rise during such incidences is solely due to H2O molecules. The process sets in too fast and shows too large variations to be attributed to the ion beam warming up the frost. This type of intense frost sputtering does not apply to the surfaces of icy moons because there is no conducting metal surface directly underneath the top frost layer. Given these observations, we consider a thick ice layer crucial for sputtering experiments to electrically decouple the ion charges from the metal surfaces underneath.
5 Conclusions
We have presented first experimental studies of ion sputtering in thick and porous water ice representative for the surface of icy moons. We have shown that the surface charging of the ice must be monitored during the experiment to correctly interpret the observed sputtering yield. The apparent signal obtained when a thin or irregular frost layer is detached from a metal surface due to electrostatic repulsion may be orders of magnitude larger than the actual sputtering rate of water ice. Electric conductivity of porous water ice regolith at temperatures close to 100 K is very low, on the order of S m*-1*, even if NaCl is present.
Since a thick and porous ice layer cannot be attached to the tip of a microbalance we resorted in these first experiments to monitoring the rise and fall of the chamber pressure during sputtering experiments. This pressure rise method leads to sputtering yields similar to previous laboratory experiments performed with thin water ice films sputtered off a microbalance. Our results are thus consistent with the notion that sputtering from porous regolith ice is similar to compact monolayers of water ice. But more experiments at various energies, incidence angles, and different ion species are required to make a stronger statement. The residual pressure in the chamber and the measurement precision prevent us from measuring sputter yields less than 100. As a result, we only obtain upper limits for the sputtering yield at energies below 10 keV.
Our experiments have, with the limitations stated above, three main implications for surface and exosphere models of the Galilean moons. So far, the sputtering yields implemented in exosphere models need not be changed. However, plasma models must take into account that the electric conductivity of the surface is very low. As a consequence, electron irradiation may have to be included explicitly in exosphere models.
Acknowledgements
The work by A. Galli and A. Pommerol at the University of Bern has been supported by the Swiss National Science Foundation. The work in this paper has been partially performed in the context of the activities of the ISSI International Team Nr. 322, www.issibern. ch/teams/exospherejuice/. We also would like to thank G. Bodmer, J. Gonseth, and A. Etter for their relentless support of the scientific work at the MEFISTO facility and two anonymous referees whose comments helped improve the paper.
References
- Andreas (2007) Andreas, E.L., 2007. New estimates for the sublimation rate for ice on the Moon. Icarus 186, 24–30.
- Barth et al. (1997) Barth, C.A., Hord, C.W., Stewart, A.I.F., Pryor, W.R., Simmons, K.E., McClintock, W.E., Ajello, J.M., Naviaux, K.L., and Aiello, J.J., 1997. Galileo ultraviolet spectrometer observations of atomic hydrogen in the atmosphere of Ganymede. Geophysical Research Letters, 24, 2147.
- Brocard (2008) Brocard, E. 2008. Ground-based remote sensing of the troposphere in the thermal infrared. PhD thesis, Philosophisch-Naturwissenschaftliche Fakultät, University of Bern, Bern, Switzerland.
- Brouet et al. (2016) Brouet, Y. et al. 2016. Measurements of permittivity of porous water ice. Submitted to Journal of Geophysical Research.
- Brown and Hill (1996) Brown, M.E., Hill, R.E., 1996. Discovery of an extended sodium atmosphere around Europa. Nature 380, 229.
- Brown et al. (2001) Brown, M.E., 2001. Potassium in Europa’s atmosphere. Icarus 151, 190.
- Bu and Baragiola (2015) Bu, C., Baragiola, R.A. Proton transport in ice at 30–140 K: Effects of porosity. The Journal of Chemical Physics 143, 074702.
- Calvin et al. (1995) Calvin, W.M., Clark, R.N., Brown, R.H., Spencer, J.R., 1995. Spectra of the icy Galilean satellites from 0.2 to 5 m: A compilation, new observations, and a recent summary. Journal of Geophysical Research, 100, 19041–19048.
- Carlson (1999) Carlson, R.W., 1999. A Tenuous Carbon Dioxide Atmosphere on Jupiter’s Moon Callisto. Science, 283, 820.
- Cassidy and Johnson (2005) Cassidy, T.A., Johnson R.E., 2005. Monte Carlo model of sputtering and other ejection processes within a regolith. Icarus 176, 499–507.
- Cassidy et al. (2010) Cassidy, T., Coll, P., Raulin, F., Carlson, R.W., Johnson, R.E., Loeffler, M.J., Hand, K.P., Baragiola, R.A., 2010. Radiolysis and Photolysis of Icy Satellite Surfaces: Experiments and Theory. Space Science Reviews. doi:10.1007/s11214-009-9625-3.
- Cassidy et al. (2013) Cassidy, T.A., Paranicas, C.P., Shirley, J.H., DaltonIII, J.B., Teolis, B.D., Johnson, R.E., Kamp, L., Hendrix, A.R., 2013. Magnetospheric ion sputtering and water ice grain size at Europa. Planetary and Space Science 77, 64–73.
- Domingue and Verbiscer (1997) Domingue, D.L., Verbiscer, A., 1997. Re-analysis of the solar phase curves of the icy Galilean satellites. Icarus 128, 49–74.
- ESA (2014) ESA, 2014. JUpiter ICy moons Explorer – Exploring the emergence of habitable worlds around gas giants – Definition Study Report. ESA/SRE(2014)1, September 2014, http://sci.esa.int/juice/54994-juice-definition-study-report.
- Eviatar et al. (2001) Eviatar, A., Vasyliunas, V.M., Gurnett, D.A., 2001. The ionosphere of Ganymede. Planetary and Space Science 49, 327–336.
- Famá et al. (2008) Famá, M., Shi, J., Baragiola, R.A., 2008. Sputtering of ice by low-energy ions. Surface Science 602, 156.
- Galli et al. (2015) Galli, A., Pommerol, A., Wurz, P., Jost, B., Scheer, J.A., Vorburger, A., Tulej, M., Thomas, N., Wieser, M., Barabash, S., 2015, Realistic ice sputtering experiments for the surfaces of Galilean moons, EPSC Abstracts, 10, EPSC2015-771-1.
- Grundy et al. (1999) Grundy, W.M., Buie, M.W., Stansberry, J.A., Spencer, J.R., 1999. Near-Infrared Spectra of Icy Outer Solar System Surfaces: Remote Determination of H2O Ice Temperatures. Icarus 142, 536–549.
- Halekas et al. (2015) Halekas, J.S., Brain, D.A., Holmström, M. 2015. Moon’s Plasma Wake. In: Keiling, A., Jackman, C.A., Delamere P.A. (Eds.), Magnetotails in the Solar System. Geophysical Monograph 207, American Geophysical Union and John Wiley & Sons, Inc., Washington D.C., USA.
- Hall et al. (1995) Hall, D.T., Strobel, D.F, Feldman, P.D., McGrath, M.A., Weaver, H.A., 1995. Detection of an oxygen atmosphere on Jupiter’s moon Europa. Nature 373, 677.
- Hall et al. (1998) Hall, D.T., Feldman, P.D., McGrath, M.A., Strobel, D.F., 1998. The Far-Ultraviolet Oxygen Airglow of Europa and Ganymede. The Astrophysical Journal 499, 475.
- Hansen et al. (2005) Hansen, C.J., Shemansky, D.E., Hendrix, A.R., 2005. Cassini UVIS observations of Europa’s oxygen atmosphere and torus. Icarus 176, 305.
- Hohl (2002) Hohl, M., 2002. MEFISTO II: design, setup, characterization and operation of an improved calibration facility for solar plasma instrumentation. PhD Thesis, University of Bern.
- Hohl et al. (2005) Hohl, M., Wurz, P., Bochsler, P., 2005. Investigation of the density and temperature of electrons in a compact 2.45 GHz electron cyclotron resonance ion source plasma by x-ray measurements. Plasma Sources Science and Technology 14, 692–699. doi:10.1088/0963-0252/14/4/008.
- Jia (2015) Jia, X. 2015. Satellite Magnetotails. In: Keiling, A., Jackman, C.A., Delamere P.A. (Eds.), Magnetotails in the Solar System. Geophysical Monograph 207, American Geophysical Union and John Wiley & Sons, Inc., Washington D.C., USA.
- Johnson (1989) Johnson, R.E., 1989. Application of Laboratory Data to the Sputtering of a Planetary Regolith. Icarus 78, 206–210.
- Johnson et al. (2004) Johnson, R.E., Carlson, R.W., Cooper, J.F., Paranicas, C., Moore, M.H., Wong, M.C., 2004. Radiation effects on the surfaces of the Galilean satellites. In: Bagenal, F. (Ed.), Jupiter: Atmosphere, Satellites and Magnetosphere. University of Arizona Press, Tucson, USA.
- Johnson and Liu (2010) Johnson, R.E. and Liu, M., 2010. Sputtering of Surfaces, Sputtering Data for H2O ice, http://people.virginia.edu/ rej/h2o.html
- Jost et al. (2016) Jost, B., Pommerol, A., Poch, O., Gundlach, B., Leboeuf, M., Dadras, M., Blum, J., Thomas, N., 2016. Experimental characterization of the opposition surge in fine-grained water-ice and high albedo analogs, Icarus 264, 109–131.
- Jurac et al. (1995) Jurac, S., Baragiola, R.A., Johnson, R.E., and Sittler Jr., E.C., 1995. Charging of ice grains by low-energy plasmas: Application to Saturn’s ring. Journal of Geophysical Research 100, A8, 14821–14831.
- Kaye & Laby (2005) Kaye & Laby Online, 2005. Tables of Physical & Chemical Constants (16th edition 1995). 2.1.4 Hygrometry, Version 1.0, www.kayelaby.npl.co.uk.
- Kivelson et al. (1997) Kivelson, M.G., Khurana, K.K., Coronoti, F.V., Joy, S., Russell, C.T., Walker, R.J., Warnecke, J., Bennett, L., Polanskey, C., 1997. The magnetic field and magnetosphere of Ganymede. Geophysical Research Letters 24, 2155–2158.
- Kliore et al. (1997) Kliore, A.J., Hinson, D.P., Flasar, F.M., Nagy, A.F., Cravens, T.E., 1997. The Ionosphere of Europa from Galileo Radio Occultations. Science 277, 355.
- Kliore et al. (2002) Kliore, A.J., Anabtawi, A., Herrera, R.G., Asmar, S.W., Nagy, A.F., Hinson, D.P., Flasar, F.M., 2002. Ionosphere of Callisto from Galileo radio occultation observations. Journal of Geophysical Research 107, 1407.
- Küstner et al. (1998) Küstner, M., Eckstein, W., Dose, V., Roth, J, 1998. The influence of surface roughness on the angular dependence of the sputter yield. Nucl. Instrum. Methods B 145, 320–331.
- Marconi (2007) Marconi, M.L., 2007. A kinetic model of Ganymede’s atmosphere. Icarus 190, 155.
- Marti et al. (2001) Marti, A., Schletti, R., Wurz, P., Bochsler, P., 2001. Calibration facility for solar wind plasma instrumentation. Review of Scientific Instruments 72, 1354. doi:10.1063/1.1340020.
- Mätzler et al. (2006) Mätzler, C., Ellison, W., Thomas, B., Sihvola, A., Schwank, M., 2006. Dielectric properties of natural media. In: Mätzler, C. (Ed.), Thermal Microwave Radiation: Applications for Remote Sensing”. The Institution of Engineering and Technology, London, UK.
- Noll et al. (1996) Noll, K.S., Johnson, R.E., Lane, A.L., Domingue, D.L., Weaver, H.A., 1996. Detection of Ozone on Ganymede. Science, 273, 341.
- Orlando and Sieger (2003) Orlando, T.M., Sieger, M.T., 2003. The role of electron-stimulated production of O2 from water ice in the radiation processing of outer solar system surfaces. Surface Sciences 528, 1.
- Petrenko (1993) Petrenko, V.F., 1993. Electrical Properties of Ice. Thayer School of Engineering, Dartmouth College, Hanover, NH, USA.
- Plainaki et al. (2012) Plainaki, C., Milillo, A., Mura, A., Orsini, S., Massetti, S., Cassidy, T., 2012. The role of sputtering and radiolysis in the generation of Europa exosphere. Icarus 218, 956.
- Rodriguez et al. (2009) Rodriguez, N.J., Rathbun, J.A., Spencer, J.R., 2009. Europa’s thermal surface from Galileo PPR. Lunar and Planetary Science Conference, Abstract, 2166.
- Rodriguez-Nieva et al. (2011) Rodriguez-Nieva, J.F., Bringa, E.M., Cassidy, T.A., Johnson, R.E., Caro, A., Famá, M., Loeffler, M.J., Baragiola, R.A., Farkas, D., 2011. Sputtering from a porous material by penetrating ions. The Astrophysical Journal Letters 743, L5. doi:10.1088/2041-8205/743/1/L5.
- Shi et al. (1995) Shi, M., Baragiola, R.A., Grosjean, D.E., Johnson, R.E., Jurac, S., Schou, J., 1995. Sputtering of water ice surfaces and the production of extended neutral atmospheres. Journal of Geophysical Research 100, 26387.
- Shi et al. (2010) Shi, J., Famá, M., Teolis, B.D., Baragiola, R.A., 2010. Ion-induced electrostatic charging of ice. Nucl. Instrum. Methods B 268, 2888–2891.
- Shi et al. (2012) Shi, J., Famá, M., Teolis, B.D., Baragiola, R.A., 2012. Ion-induced electrostatic charging of ice at 15–160 K. Physical Review B 85, 035424.
- Shirley et al. (2010) Shirley, J.H., Dalton III, J.B., Prockter, L.M., Kamp, L.W., 2010. Europa’s ridged plains and smooth low albedo plains: Distinctive compositions and compositional gradients at the leading side–trailing side boundary. Icarus, 210, 358–384.
- Spencer et al. (1995) Spencer, J.R., Calvin, W.M., Person, M.J., 1995. Charge-coupled device spectra of the Galilean satellites: Molecular oxygen on Ganymede. Journal of Geophysical Research 100, 19049.
- Stillman et al. (2013) Stillman, D.E., MacGregor, J.A., Grimm, R.E., 2013. The role of acids in electrical conduction through ice. Journal of Geophysical Research 118, 1–16.
- Sugiyama et al. (2010) Sugiyama, S., Enomoto, H., Fujita, S., Fukui, K., Nakazawa, F., Holmlund, P., 2010. Dielectric permittivity of snow measured along the route traversed in the Japanese-Swedish Antarctic Expedition 2007/08. Annals of Glaciology 51, 55.
- Wang et al. (2008) Wang, H.F., Bell, R.C., Iedema, M.J., Schenter, G.K., Wu, K., and Cowin, J.P., 2008. Pyroelectricity of water ice. Journal of Physical Chemistry B, 112, 6379–6389.
- Wieser et al. (2016) Wieser, M., Futaana, Y., Barabash, S., Wurz, P., 2016. Emission of energetic neutral atoms from ice under Ganymede surface like conditions. Icarus 269, 91–97.
The reference list from the paper itself. Each links out to its DOI / PubMed record.
- 1Andreas (2007) Andreas, E.L., 2007. New estimates for the sublimation rate for ice on the Moon. Icarus 186, 24–30.
- 2Barth et al. (1997) Barth, C.A., Hord, C.W., Stewart, A.I.F., Pryor, W.R., Simmons, K.E., Mc Clintock, W.E., Ajello, J.M., Naviaux, K.L., and Aiello, J.J., 1997. Galileo ultraviolet spectrometer observations of atomic hydrogen in the atmosphere of Ganymede. Geophysical Research Letters, 24, 2147.
- 3Brocard (2008) Brocard, E. 2008. Ground-based remote sensing of the troposphere in the thermal infrared. Ph D thesis, Philosophisch-Naturwissenschaftliche Fakultät, University of Bern, Bern, Switzerland.
- 4Brouet et al. (2016) Brouet, Y. et al. 2016. Measurements of permittivity of porous water ice. Submitted to Journal of Geophysical Research .
- 5Brown and Hill (1996) Brown, M.E., Hill, R.E., 1996. Discovery of an extended sodium atmosphere around Europa. Nature 380, 229.
- 6Brown et al. (2001) Brown, M.E., 2001. Potassium in Europa’s atmosphere. Icarus 151, 190.
- 7Bu and Baragiola (2015) Bu, C., Baragiola, R.A. Proton transport in ice at 30–140 K: Effects of porosity. The Journal of Chemical Physics 143, 074702.
- 8Calvin et al. (1995) Calvin, W.M., Clark, R.N., Brown, R.H., Spencer, J.R., 1995. Spectra of the icy Galilean satellites from 0.2 to 5 μ 𝜇 \mu m: A compilation, new observations, and a recent summary. Journal of Geophysical Research, 100, 19041–19048.