Stellar population synthesis based modelling of the Milky Way using asteroseismology of dwarfs and subgiants from Kepler
Sanjib Sharma, Dennis Stello, Daniel Huber, Joss Bland-Hawthorn,, Timothy R. Bedding

TL;DR
This study revisits asteroseismic data of Kepler dwarf and subgiant stars to understand discrepancies in stellar mass distributions, revealing model inaccuracies and the impact of scaling relation corrections on the results.
Contribution
It provides a detailed analysis of Milky Way models using asteroseismology, highlighting the effects of model inaccuracies and scaling relation corrections on stellar mass distribution predictions.
Findings
TRILEGAL predicts more massive and bluer stars than Galaxia.
Both models fail to accurately reproduce the observed space distribution.
Applying corrections to scaling relations narrows the mass distribution without shifting the mean.
Abstract
Early attempts to apply asteroseismology to study the Galaxy have already shown unexpected discrepancies for the mass distribution of stars between the Galactic models and the data; a result that is still unexplained. Here, we revisit the analysis of the asteroseismic sample of dwarf and subgiant stars observed by Kepler and investigate in detail the possible causes for the reported discrepancy. We investigate two models of the Milky Way based on stellar population synthesis, Galaxia and TRILEGAL. In agreement with previous results, we find that TRILEGAL predicts more massive stars compared to Galaxia, and that TRILEGAL predicts too many blue stars compared to 2MASS observations. Both models fail to match the distribution of the stellar sample in space, pointing to inaccuracies in the models and/or the assumed selection function. When corrected for this mismatch…
Click any figure to enlarge with its caption.
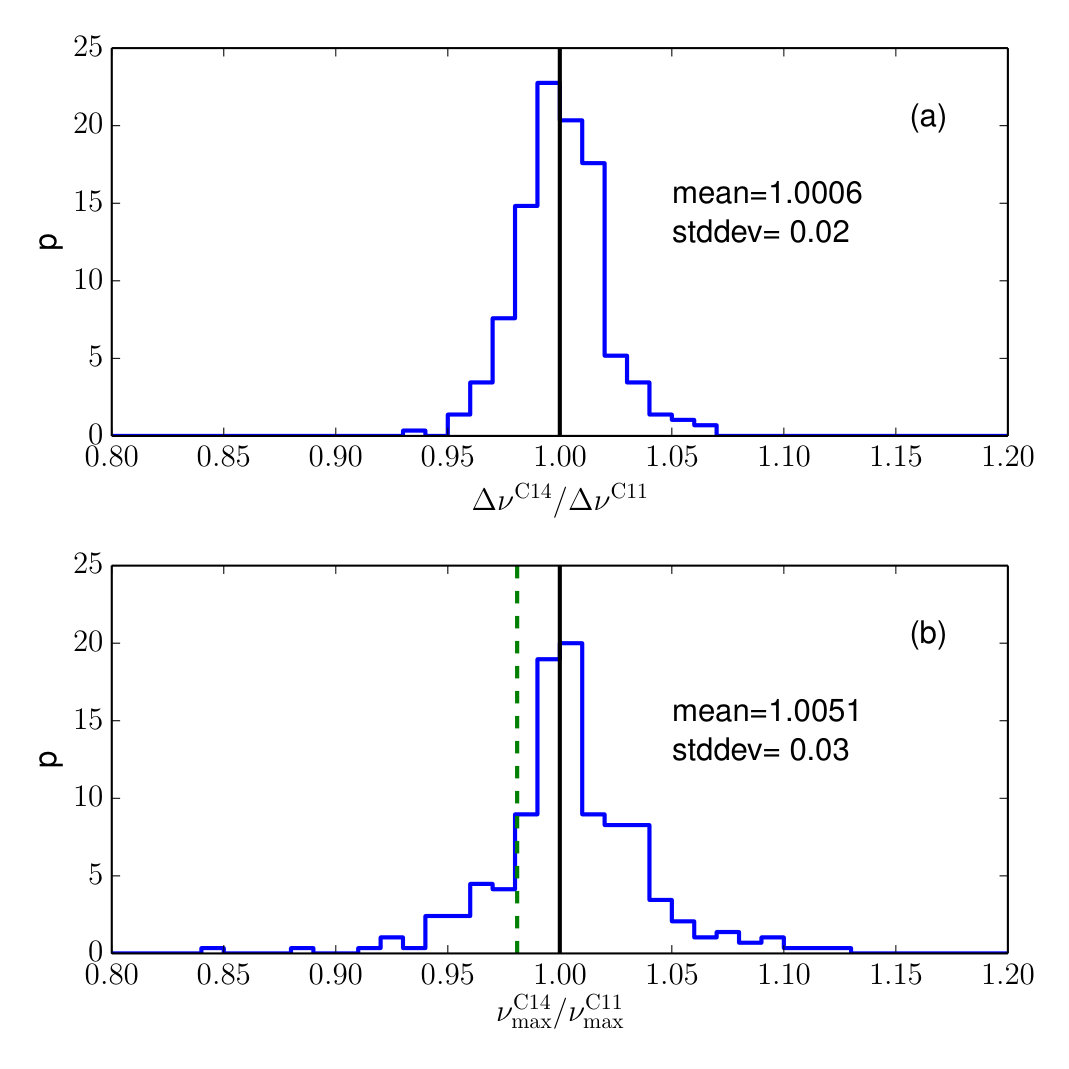 Figure 1
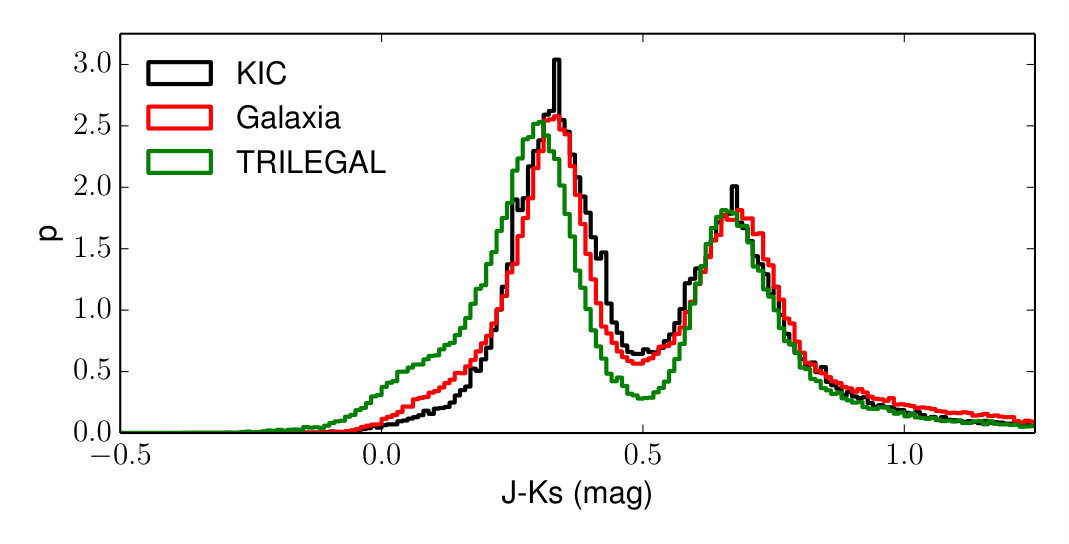 Figure 2
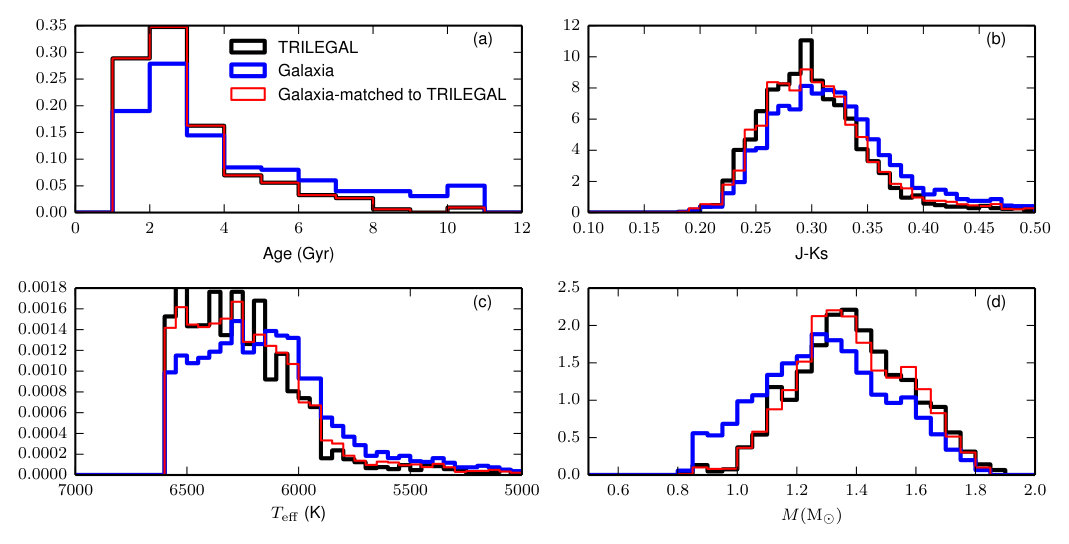 Figure 3
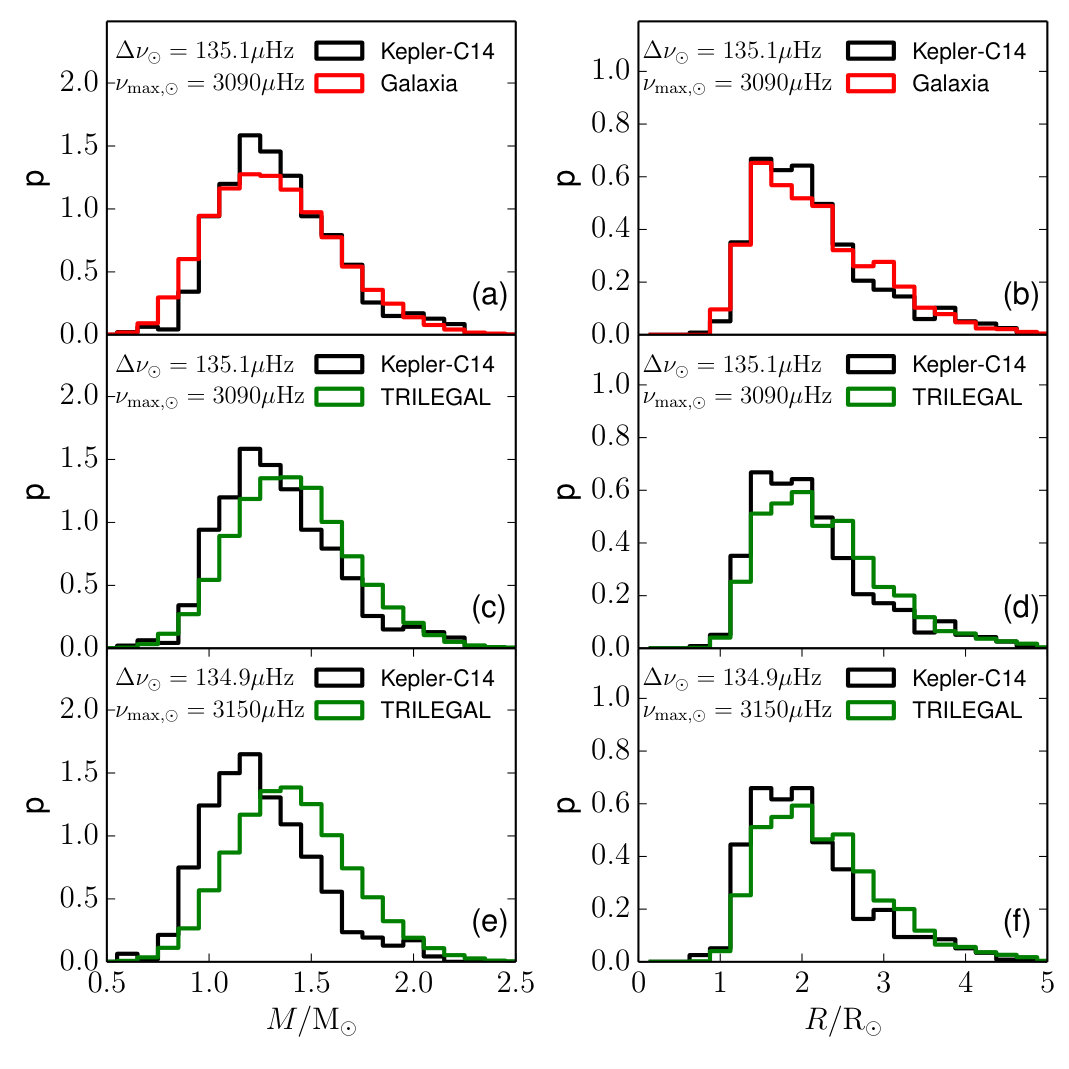 Figure 4
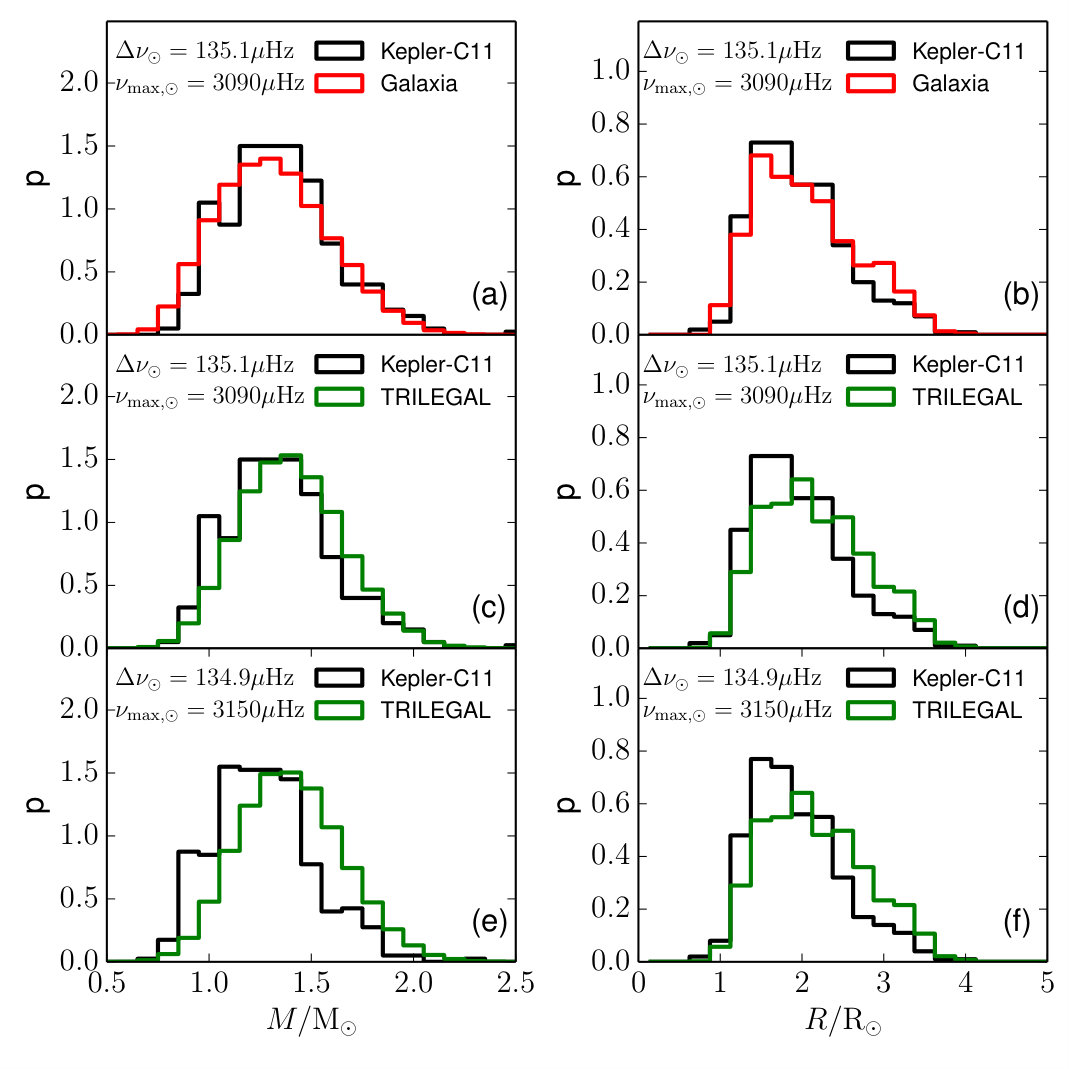 Figure 5
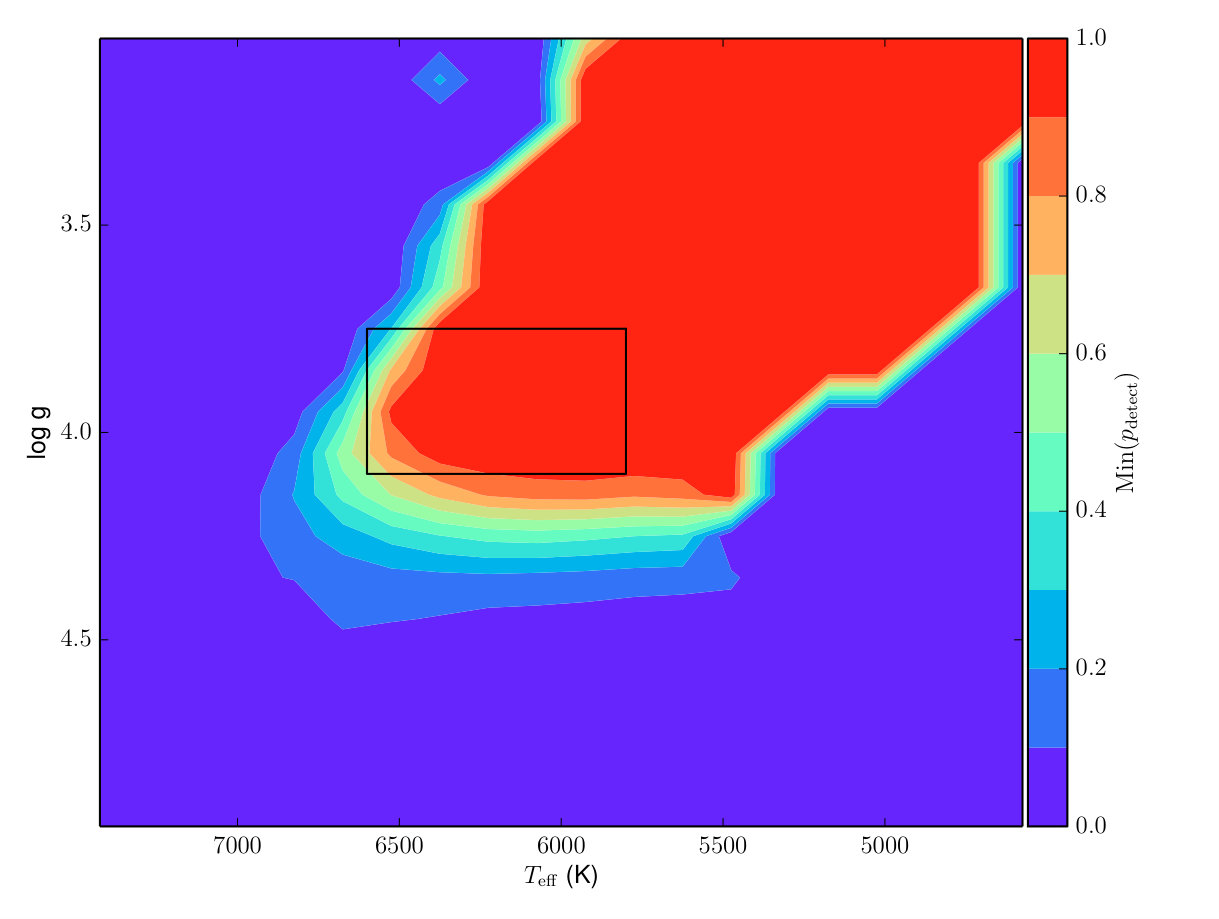 Figure 6
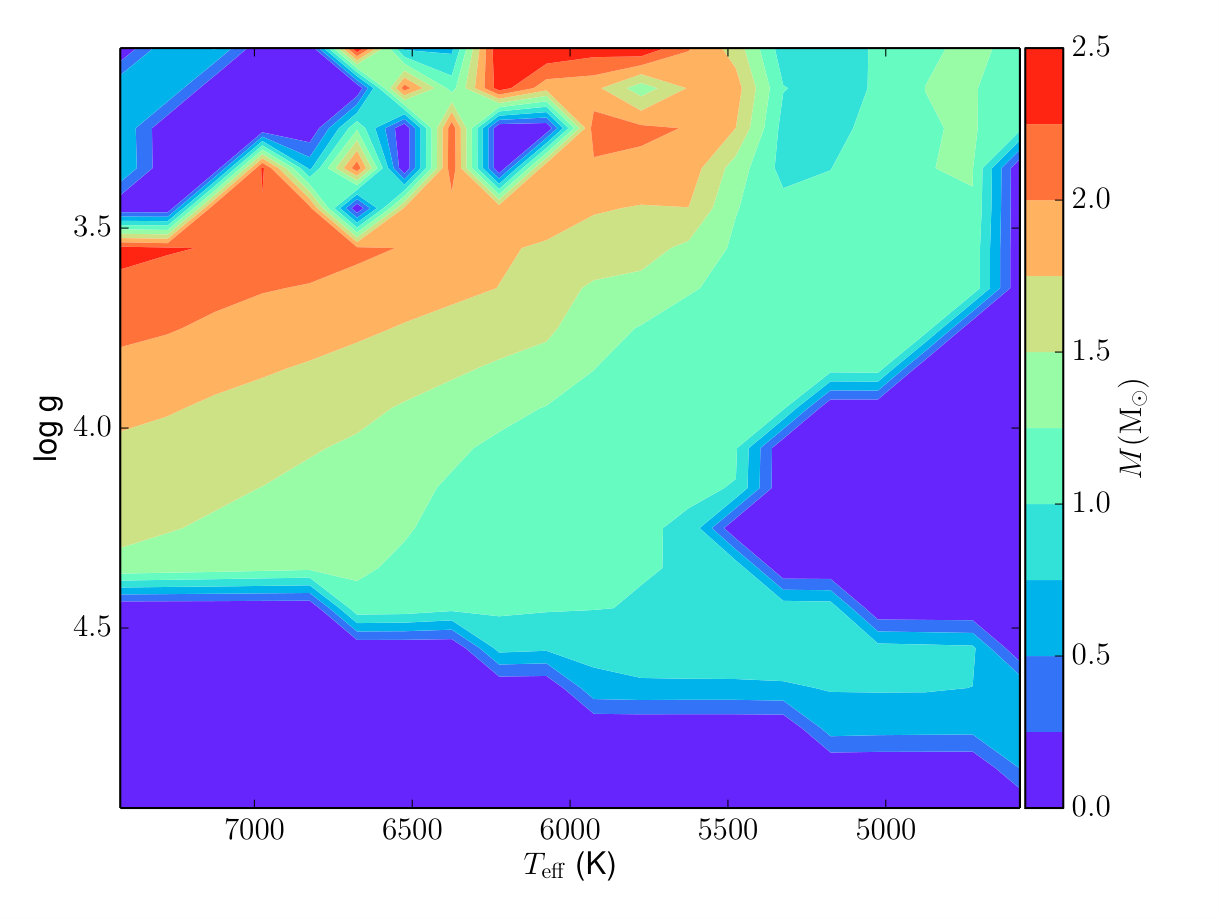 Figure 7
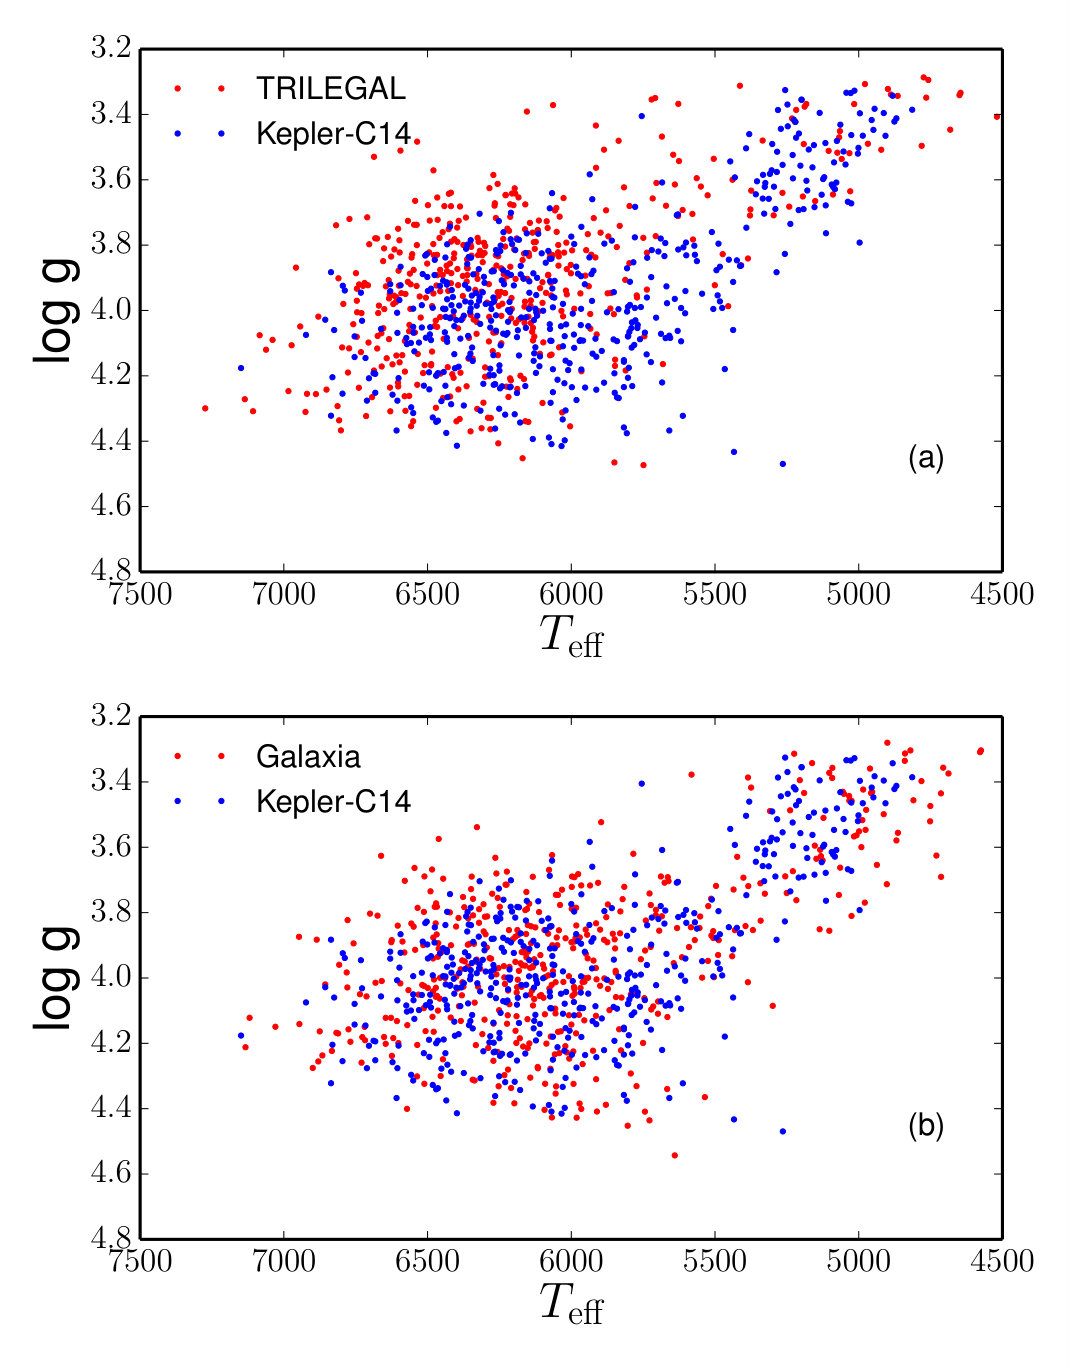 Figure 8
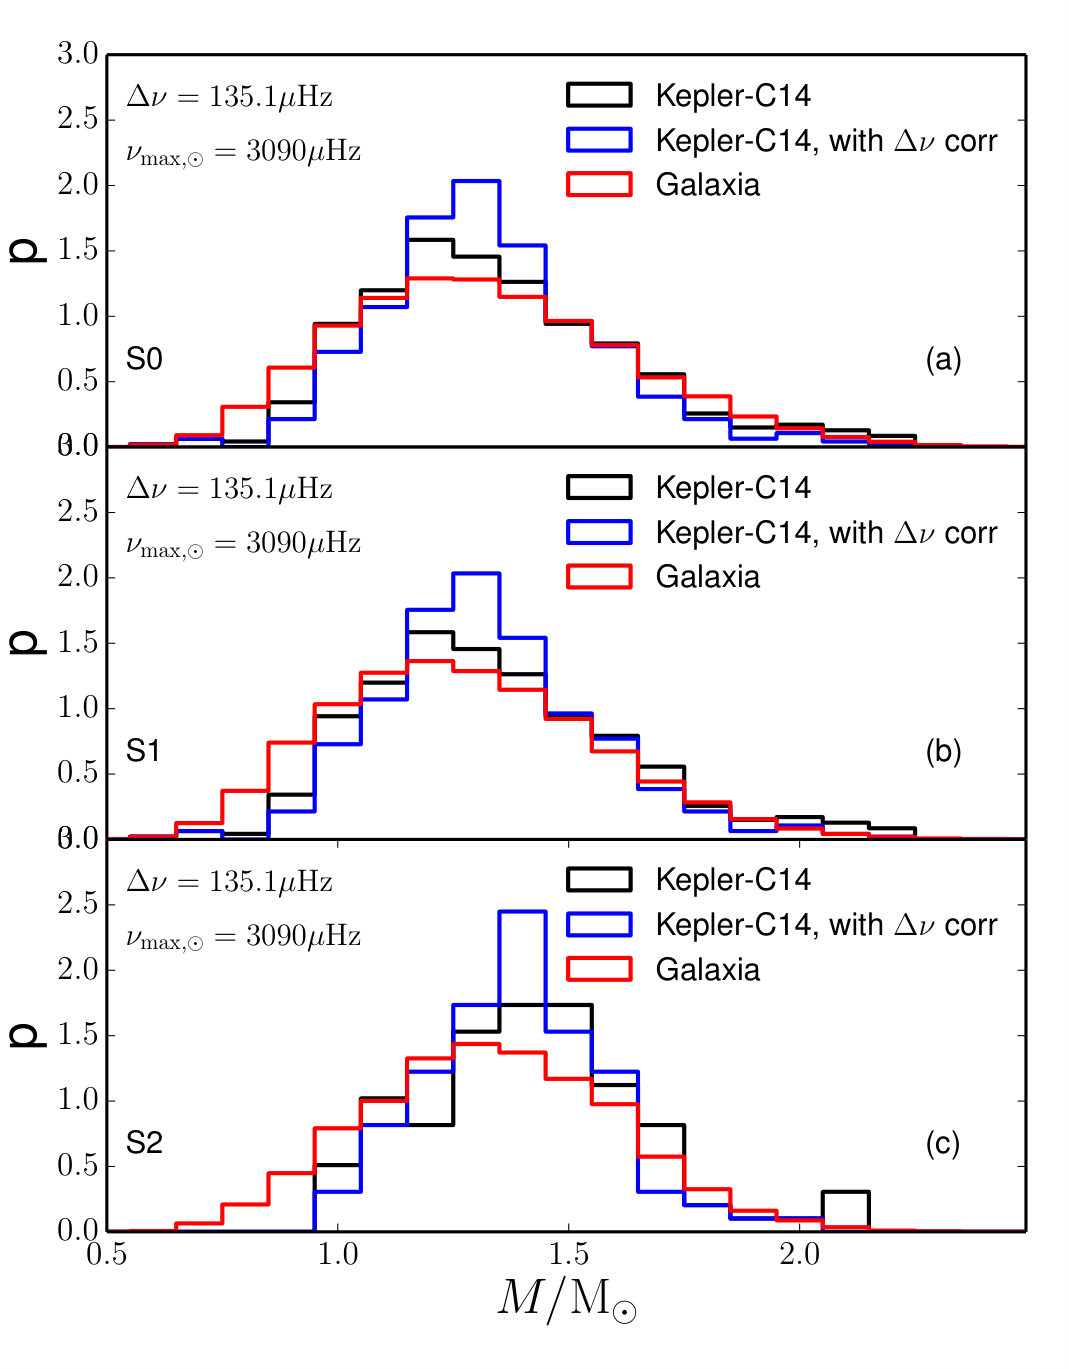 Figure 9
| Method | ||
|---|---|---|
| SYD aafootnotemark: | eefootnotemark: | |
| CAN bbfootnotemark: | ||
| COR ccfootnotemark: | ||
| OCT ddfootnotemark: |
| Selection | Galaxia | TRILEGAL |
|---|---|---|
| Function | ||
| S0 | ||
| S1 | ||
| S2 |
Peer Reviews
No public reviews on file for this paper yet. If you reviewed it on a platform where reviews are public (OpenReview, ICLR, NeurIPS, ICML), you can paste yours below so the community can read it here.
Videos
No videos yet. Explain this paper in a talk, walkthrough, or lecture? Add one.
Stellar population synthesis
based modelling of the Milky Way using asteroseismology of dwarfs and subgiants from Kepler.
Sanjib Sharma11affiliation: Sydney Institute for Astronomy, School of Physics, University of Sydney, NSW 2006, Australia , Dennis Stello11affiliation: Sydney Institute for Astronomy, School of Physics, University of Sydney, NSW 2006, Australia 22affiliation: Stellar Astrophysics Centre, Department of Physics and Astronomy, Aarhus University, DK-8000 Aarhus C, Denmark , Daniel Huber 11affiliation: Sydney Institute for Astronomy, School of Physics, University of Sydney, NSW 2006, Australia 22affiliation: Stellar Astrophysics Centre, Department of Physics and Astronomy, Aarhus University, DK-8000 Aarhus C, Denmark 33affiliation: SETI Institute, 189 Bernardo Avenue, Mountain View, CA 94043, USA , Joss Bland-Hawthorn11affiliation: Sydney Institute for Astronomy, School of Physics, University of Sydney, NSW 2006, Australia , Timothy R. Bedding11affiliation: Sydney Institute for Astronomy, School of Physics, University of Sydney, NSW 2006, Australia 22affiliation: Stellar Astrophysics Centre, Department of Physics and Astronomy, Aarhus University, DK-8000 Aarhus C, Denmark
Abstract
Early attempts to apply asteroseismology to study the Galaxy have already shown unexpected discrepancies for the mass distribution of stars between the Galactic models and the data; a result that is still unexplained. Here, we revisit the analysis of the asteroseismic sample of dwarf and subgiant stars observed by Kepler and investigate in detail the possible causes for the reported discrepancy. We investigate two models of the Milky Way based on stellar population synthesis, Galaxia and TRILEGAL. In agreement with previous results, we find that TRILEGAL predicts more massive stars compared to Galaxia, and that TRILEGAL predicts too many blue stars compared to 2MASS observations. Both models fail to match the distribution of the stellar sample in space, pointing to inaccuracies in the models and/or the assumed selection function. When corrected for this mismatch in space, the mass distribution calculated by Galaxia is broader and the mean is shifted toward lower masses compared to that of the observed stars. This behaviour is similar to what has been reported for the Kepler red giant sample. The shift between the mass distributions is equivalent to a change of 2% in , which is within the current uncertainty in the scaling relation. Applying corrections to the scaling relation predicted by the stellar models makes the observed mass distribution significantly narrower, but there is no change to the mean.
Subject headings:
Galaxy: disk – Galaxy: stellar content – Galaxy: structure – asteroseismology – stars: fundamental parameters
1. Introduction
Our current understanding of the Milky Way has, to a large extent, been informed by stellar data from large scale photometric, astrometric, and spectroscopic surveys, such as, 2MASS (2006AJ....131.1163S), SDSS (2008ApJ...673..864J), Hipparcos (1997yCat.1239....0E), GCS (2004A&A...418..989N), RAVE (2013AJ....146..134K), SEGUE (2009AJ....137.4377Y), APOGEE (2013AJ....146...81Z), and Gaia-ESO (2012Msngr.147...25G). As a result, we have already come a long way from simple empirical models of the Galaxy that fit star counts in a few lines of sight (1980ApJS...44...73B; 1980ApJ...238L..17B; 1984ApJS...55...67B), to models that aim to be dynamically self-consistent (2003A&A...409..523R; 2010MNRAS.401.2318B; 2012MNRAS.426.1328B; 2011MNRAS.413.1889B; 2012MNRAS.426.1324B; 2012MNRAS.419.2251M; 2014A&A...564A.102C; 2009MNRAS.396..203S; 2009MNRAS.399.1145S; 2014ApJ...793...51S). Some of these models, such as , Besançon (2003A&A...409..523R), TRILEGAL (2005A&A...436..895G), and Galaxia (2011ApJ...730....3S) have been constructed to directly satisfy the observational constraints from various large scale photometric, astrometric and spectroscopic surveys of the Milky Way. However, to understand the Milky Way’s formation history, and hence to further verify the models, it is important to know the fundamental properties of the stars, including radius and mass. Until recently, it has been difficult to reliably determine these properties model-independently for large numbers of distant stars. Fortunately, the space missions CoRoT (2006ESASP1306...11B) and Kepler (2010Sci...327..977B), and now also K2 (2014PASP..126..398H), provide highly accurate time-series photometry of thousands of stars across the Galaxy, from which we can obtain asteroseismic information that is sensitive to, and hence capable of measuring, stellar radius and mass in a largely model independent way.
A promising approach to take advantage of the large ensembles of seismically-inferred stellar properties is to invoke stellar population synthesis-based models of the Milky Way (e.g. 2009A&A...503L..21M; 2011Sci...332..213C; 2016ApJ...822...15S). This offers a way to link stellar structure and evolution with Galactic structure and evolution by combining isochrones with star-formation history, the initial mass function, and the spatial distribution of stars of the Galaxy. This allows one to predict stellar observables like temperature, photometry, asteroseismic parameters, as well as fundamental stellar properties such as radius and mass.
2011Sci...332..213C used the first seven months of Kepler data of dwarfs and subgiants, to compare the distributions of seismically-inferred radii and masses of about 400 stars with a synthesis-based Galactic model using TRILEGAL. They found that the radius distribution of the synthetic population matched the data, but the mass distribution significantly under-predicted the number of low-mass stars (), and hence over-predicted the number of more massive (younger) stars. Using red giants from Kepler, we found the opposite effect when comparing the observed masses with predictions from the Galactic model Galaxia (2016ApJ...822...15S). We showed that in the Kepler region for a magnitude limited sample, TRILEGAL predicts more blue stars as compared to 2MASS, while Galaxia has no such problem. Because blue stars are young and massive, this suggests that TRILEGAL overpredicts the number of young and massive stars. Hence, it is important to compare the observed masses of dwarfs and subgiants with the predictions from Galaxia.
Besides inaccuracies in the Galactic model, there are a number of other factors that could contribute to the mismatch in the mass distributions seen by 2011Sci...332..213C. (i) Inaccuracies in the selection function can lead to a mismatch and need to be checked. There could be systematics associated with the algorithm used to estimate average seismic parameters. (ii) The probability to detect oscillations can differ from one algorithm to another and this can lead to differences in the selection function. Since the analysis by 2011Sci...332..213C, a new data set of dwarfs and subgiants has been published by 2014ApJS..210....1C, which used a different algorithm to estimate the seismic parameters. Additionally, it contains more stars and extends to slightly lower gravities. Hence, it is necessary to investigate the mass distributions with the new data set as well. (iii) Theoretical modelling of the stellar oscillations predict departures from the scaling relation (2009MNRAS.400L..80S; 2011ApJ...743..161W; 2013EPJWC..4303004M) and the effect of this needs to be taken into account. (iv) To estimate mass from average seismic parameters, one has to adopt certain solar reference values. Currently, there is no consensus on the choice of these with systematic differences ranging from 1% to 2%. Hence, one needs to investigate whether the discrepancy between observations and predictions is less or greater than the current diversity in the solar reference values.
In this paper we revisit the dwarf/subgiant analysis of 2011Sci...332..213C and analyze each of the above mentioned factors. In Section 2, we discuss the observational data and the Galactic models. Systematics associated with the different data sets and Galactic models are discussed here. In Section 3, we analyze the asteroseismic information for different data sets and different Galactic models and discuss the role of the selection function. We also do a quantitative study of the difference between observed and predicted mass distributions. Finally, in Section 4 we discuss and conclude our findings.
2. Data, scaling relations and Galactic models
2.1. Observational data
The observed asteroseismic information is in the form of the average seismic parameters (average frequency spacing between overtone oscillation modes) and (frequency at maximum oscillation power) that are extracted from time series photometry using a specific algorithm/method. Prior to the launch of Kepler, about 2000 stars with mag were selected as potential asteroseismic dwarf and subgiant targets based on their parameters in the Kepler Input Catalog (KIC) (2011AJ....142..112B). They were all observed with short cadence for one month each during an initial 10-month seismic survey phase. Four hundred stars showed detectable oscillations after the first seven months and were presented by 2011Sci...332..213C (hereafter denoted as Chaplin-11 sample). Following the completion of the 10-month survey, an updated dwarf/subgiant sample (518 stars) showing oscillations was presented by 2014ApJS..210....1C (here after denoted as Chaplin-14 sample), where a method different from that of 2011Sci...332..213C was used for extracting seismic parameters. In the Chaplin-14 sample 467 stars have measured values of , and . Of these, 290 stars are in common with the previous Chaplin-11 sample. In LABEL:c14_c11_nu, we compare the and values of Chaplin-2014 with those of Chaplin-2011, for stars common to both samples. It can be seen that there are no systematic shift between the two data sets. This means there is no method-specific differences in the two data sets. In this paper we mainly make use of the Chaplin-2014 sample, because it has more stars.
2.2. Scaling relations and solar reference values
The stellar mass and radius can be estimated from the seismic parameters and , and the effective temperature using the following scaling relations:
[TABLE]
These relations are based on the relations , and (1991ApJ...368..599B; 1995A&A...293...87K; 2011A&A...530A.142B) , which in turn are based on the assumption that the structure of any given star is homologous with respect to the Sun. This assumption is not strictly correct and can lead to departures from the scaling relations. To accommodate these departures we have introduced the factors and . There is also considerable uncertainty regarding the choice of solar reference values and this leads to uncertainties in and , when we adopt a specific set of canonical solar reference values. Below, we discuss this in detail.
It is clear from the scaling relations that to estimate mass and radius one has to adopt some solar reference values, and . Unfortunately, there is no consensus on the choice of solar reference values. Ideally, to estimate them we would require high quality data of the Sun in the Kepler bandpass, which, unfortunately is not available. The data for the Sun is available in other bandpasses and this has been analyzed. The results using the SOHO/VIRGO green channel data (1997SoPh..170....1F) are shown in Table 1 for various methods. While the estimates of agree (difference about 0.2%), the estimates of differ significantly (difference about 2.5%) and so far this disagreement has not been explicitly explained. The most likely cause for the differences is the method-specific systematics associated with the estimation of . This would argue for the use of “method-specific” solar values, meaning the values returned from solar data when using the same method (pipeline) as used for the rest of the stellar sample. However, there is no strong evidence to back up the use of method-specific values. On the contrary, 2013A&A...556A..59H found that for red giants, method-specific solar reference values introduce biases. In other words, method-specific systematics in for the Sun are not necessarily representative of the systematics for other stars.
Similar to giants, for dwarfs and subgiants it is not clear whether one should adopt method specific solar reference values. The Chaplin-14 sample adopted the SYD method (2009CoAst.160...74H; 2011ApJ...743..143H) for computing the seismic parameters. The solar reference values corresponding to this method are . For the Chaplin-11 sample, however, a different method was used, namely the OCT pipeline (2013A&A...556A..59H) available at that time whose method specific solar reference values were and . These were adopted by 2011Sci...332..213C for computing the stellar masses in their sample. As discussed earlier (LABEL:c14_c11_nu), there is no systematic shift in seismic parameters between the Chaplin-11 and Chaplin-14 data sets. Hence, is an equally valid choice for estimating masses. For clarity throughout, we adopt , and .
Based on the discussion in the previous two paragraphs, we conclude that is uncertain by at least 2%, and we will use this fact later.
2.3. Galactic models
The main Galactic stellar-population-synthesis model used in this paper is from the Galaxia111http://galaxia.sourceforge.net code (2011ApJ...730....3S). It uses a Galactic model that is based on the Besançon model by 2003A&A...409..523R but with some modifications. Galaxia has a 3D extinction scheme that is based on 1998ApJ...500..525S dust maps. We also apply a low latitude correction to the dust maps as in 2014ApJ...793...51S. The isochrones used to predict the stellar properties are from the Padova database (1994AAS..106..275B; 2008A&A...482..883M). The unique feature of Galaxia is its novel star-spawning scheme which, unlike previous codes, does not discretize the spatial dimensions into multiple lines of sight; instead it generates a continuous three-dimensional distribution of stars.
For comparison, we also used the TRILEGAL222http://stev.oapd.inaf.it/cgi-bin/trilegal Galactic stellar-population-synthesis model (2005A&A...436..895G). TRILEAGL as a code is very flexible and offers multiple options to the user to change various aspects of the Galactic model, i.e., IMF, SFR, age scale height, local surface density of stars and so on. However, there is a default version of the Galactic model that is advocated in the (2005A&A...436..895G) paper and is commonly used. We here wish to investigate the discrepancies reported by 2011Sci...332..213C, who do not mention any specific changes to the default settings. So we choose to use the default model of TRILEGAL for our analysis.
Unlike Galaxia, TRILEGAL cannot generate stars over a wide angular area, so we generated stars along 21 lines of sight pointing towards the centers of the 21 Kepler CCD-modules. We used the default settings but with binary stars turned off. To model the dust, we used the 3D extinction model of Galaxia. One noticeable difference between Galaxia and TRILEGAL is that Galaxia uses a constant star-formation rate, while the default setting in TRILEGAL uses a two-step star-formation rate, which is twice as large between 1-4 Gyr as at any other time.
2.3.1 Comparing Galactic models with the Kepler
Input Catalog
Before comparing the Galactic models with the data, it is important to check that they reproduce the stellar photometry in the KIC. This is because the KIC formed the basis for the selection of the observed sample of stars. Hence, any significant mismatch between the models and the KIC would indicate a fundamental problem with the models, making it difficult to perform meaningful comparisons with the seismic data.
In 2016ApJ...822...15S, we analyzed the color distribution of a magnitude limited sample ( mag) of stars in the Kepler field and below we summarize the results for the completeness of this paper. We generated two synthetic catalogs of the Milky Way, using each of Galaxia and TRILEGAL. Stars from the synthetic catalogs and from the KIC that lay within 8 degrees of the center of the Kepler field and with magnitude were selected for comparison. In the KIC, the repeatability of photometry for stars brighter than magnitude 14 is about 2%, so it is very likely to be complete for . We show the resulting distributions of color in LABEL:galaxia_trilegal_jkgr. The prediction of Galaxia is in excellent agreement with the stars from the KIC, but that from TRILEGAL shows a significant difference. TRILEGAL correctly reproduces the region around the red peak of the color distribution, but not around the blue peak. Specifically, it overestimates the number of stars to the left of the blue peak and underestimates the number of stars on the right side of the blue peak. Stars leftward of the blue peak are typically young main-sequence stars, suggesting that TRILEGAL over predicts the number of young stars in the Kepler field.
Now, to better understand the above mentioned difference between TRILEGAL and Galaxia, we selected stars from both models satisfying , and mag (we call this selection criteria ). This was designed to select dwarfs and subgiants, which are the main focus of this paper. The distributions of stellar properties are shown in LABEL:subgiants_summary. The same color difference as seen in LABEL:galaxia_trilegal_jkgr can be seen here. A difference in age, temperature and mass distributions can also be seen. Mass, age, and metallicity are the three intrinsic properties of a star that largely define its observable properties. The metallicity distributions (not shown here) did not show any significant difference. Hence, the color difference is most likely due to differences in mass and age distributions. Next, we therefore investigate if the color, temperature, and mass distributions would match (between Galaxia and TRILEGAL) if we were to alter the Galactic model of Galaxia in such a way that the age distribution of stars obeying the subgiant and dwarf selection criteria matches the TRILEGAL prediction. However we cannot easily alter the model in Galaxia, instead we use the idea of importance sampling. We assign a weight to each Galaxia star such that the weighted age distribution matches that of TRILEGAL. Using these weights we then compute the weighted distriutions of other quantities like color, temperature, and mass, and compare them with those of TRILEGAL. We found that the color, temperature and mass distributions of the reweighted Galaxia sample now matched the TRILEGAL sample. Reweighting the Galaxia sample to match the mass distribution of the TRILEGAL sample produced similar results. This is expected because mass and age are correlated for the types of stars that we analyze. This shows that differences between Galaxia and TRILEGAL are mainly related to age and/or mass, and not due to differences in isochrones. If the difference were due to isochrones, then even after forcing a match on mass, age and metallicity, the two models would have shown differences in the color distribution. The two main factors that control the age distribution of a stellar sample are the star-formation rate and the age scale height relation. Both of these factors are different between Galaxia and TRILEGAL and could be responsible for the mismatch in the color distribution.
To conclude, we find that TRILEGAL cannot fit the color distribution of the stars, probably because it predicts too many young and massive stars. Unless we can explain the mismatch in the color distribution by some other means (e.g., systematics in the isochrones), a color or temperature-limited sample of dwarfs and subgiants selected from TRILEGAL is expected to be biased towards higher masses.
3. Analysis of asteroseismic information
To compare the predictions of the Galactic model with the asteroseismic information from Kepler, we generated a new synthetic population of stars using both Galaxia and TRILEGAL. The synthetic stars were then selected to match the selection criteria of the observed stars. The main selection criteria was based on apparent magnitude and a lower limit on . However, not all targeted stars showed oscillations. A scheme to compute the detection probability was presented in 2011ApJ...732...54C and this was used by 2011Sci...332..213C to select stars from a Galactic model. In this scheme, mass, radius, and effective temperature of each synthetic star were used to predict its total mean oscillation power and the granulation noise in the power spectrum. The apparent magnitude was used to compute the instrumental noise in the power spectrum which, combined with granulation noise, gave the total noise. The mean oscillation power and the total noise were then used to derive the probability of detecting oscillations, , with less than 1% possibility of false alarm. Stars with were assumed to be detectable. Hereafter we refer to this selection function as S0.
We applied the S0 selection function to the synthetic stars and calculated the mass and radius distributions (LABEL:c14s0_mr). Figures 4a,b show the predictions of Galaxia, which match well with the observations. LABEL:c14s0_mrc,d show predictions of the TRILEGAL model, which was used by 2011Sci...332..213C. Here, the predicted mass distribution is shifted slightly to the right. LABEL:c14s0_mre,f also show the predictions of TRILEGAL alongside observed stars, but with masses of observed stars computed using the solar reference values adopted by 2011Sci...332..213C in their analysis. As expected, this result is the same as that presented by 2011Sci...332..213C, with a significant shift of the mass distribution from TRILEGAL compared to the observed distribution. In LABEL:c11s0_mr, we show the same analysis but using the Chaplin-11 sample, whose size is slightly smaller than the Chaplin-14 sample. As expected, we see the same trends as seen in LABEL:c14s0_mr.
The value of used by 2011Sci...332..213C is about 2% higher than the value used by us (LABEL:c14s0_mra-d) and this reduces the masses of the observed stars by about 8%, which exacerbates the mass discrepancy between the TRILEGAL prediction and the observations. The small difference in , has no significant effect. To conclude, the mismatch in the stellar mass distribution found by 2011Sci...332..213C can be alleviated if: (i) one adopts a value of that is slightly smaller and (ii) we use Galaxia (with default settings) instead of TRILEGAL (with default settings) as the Galactic model. This does not necessarily mean that the Galaxia model is correct. The mass distribution is sensitive to the choice of the selection function and a bias in mass due to an incorrect choice of the selection function can cancel out a bias due to an incorrect galactic model. Hence, in the next subsection, we investigate the accuracy of the selection function.
3.1. The role of the selection function
The accuracy of a selection function that is based on detectability of oscillations hinges upon our ability to accurately predict the mean oscillation power. The mean oscillation power is computed from the maximum mode amplitude and for this an empirical relation is used, which is prone to inaccuracies and can potentially bias the selection function.
We now study whether altering the assumptions behind the selection function have any effect on the distribution of stars in the space. In LABEL:predict_2, we show as a function of and for stars with mag, selected from Galaxia. Stars with high are confined to the region in space shown in red. For the red region, the right boundary is because there are no stars to the right of that boundary. The left and lower boundaries are because the oscillation amplitude decreases with increasing and . If we lower the assumed amplitudes in the selection function, the red region would shift upwards and to the right. Increasing the assumed noise in the selection function or increasing would have a similar effect. On average, the stellar mass increase as one moves diagonally from the lower right to the upper left (LABEL:m_logg_teff). Hence, a bias in space will also lead to a bias in the masses of the stars.
In LABEL:logg_teff_1, we show the distribution of the Kepler sample in space alongside predictions from Galactic models based on the S0 selection function. The observed and predicted distributions match well in the central region but differences can be seen along the boundary. Both models overpredict the number of stars at around . Additionally, TRILEGAL predicts fewer stars around , while Galaxia predicts more cooler stars (). At the low-temperature end for evolved stars we expect the detection probability to be high. Hence, the differences seen here are most likely due to inaccuracies in the models. At high temperature, the detection probability is low and is sensitive to the assumptions made in the selection function. Here, stars are close to the instability strip where convection zones are thin, which makes it difficult to model the mode driving and damping mechanisms. Hence, the differences seen here are most likely due to inaccuracies in the relation used to predict mode amplitudes.
The fact that the observed and the predicted distributions of stars do not match in space means the mass distributions will also not match. To eliminate this bias, we created new selection functions by resampling the model stars to satisfy the observed distribution of stars in space. The disadvantage of such resampling is that we reduce our sensitivity to model-based differences, because the first order differences are already taken out. However, they are still useful to understand systematics related to asteroseismic analysis. Below are two ways for devising such new selection functions.
- •
S1: Here we resample the model stars to match the distribution of observed stars in space. This is done by dividing the space into bins and then making sure that each bin has the same number of model and observed stars. Because the number of observed stars is low, one has to adopt large bins and this can affect the accuracy of the selection function.
- •
S2: In this we select a box in space where we expect the detection probability to be close to 1 and where the distribution of the observed data matches that of the Galactic model. Compared to the case S1, the case S2 leads to fewer stars, but has a more accurate selection function. The selected box,
[TABLE]
is shown in LABEL:predict_2, and it can be seen that the box is mainly inside the region of high detection probability (red).
In LABEL:galaxia_trilegal_fm_sigmam2, we compare the predicted mass distributions with observations, for the three different selection functions, S0, S1 and S2. Compared to the observed distributions, the predicted distributions are shifted toward lower masses and are slightly broader. For S0 the shift is minimal, but for S1 and S2 it is significant. We note that LABEL:galaxia_trilegal_fm_sigmam2a (S0) is the same as LABEL:c14s0_mra. To quantify the shift between the mass distributions, we determined the value of that minimizes the Kolmogorov-Smirnov statistic between the observed and predicted distributions. The uncertainty on the estimate was computed using bootstrapping. The results are shown in Table 2. The two selection functions (S1 and S2) that are based on observables like gravity and temperature, give similar values for , but the value is different for S0. It is clear that the selection function plays a crucial role and can bias by 2%. The difference between TRILEGAL and Galaxia is also about 2%.
Detailed theoretical modelling of oscillations shows that there are departures from the scaling relation that depend upon metallicity, mass, and age. As mentioned in Section 2.2, we accommodated these departures using the correction factor . We computed these corrections using the publicly available code ASFGrid333http://www.physics.usyd.edu.au/k2gap/Asfgrid. ASFGrid uses the code MESA (v6950) (2011ApJS..192....3P; 2013ApJS..208....4P; 2015ApJS..220...15P) for stellar evolution and the code GYRE (2013MNRAS.435.3406T) for deriving oscillation frequencies. The correction factors are computed as a function of metallicity, mass, and age, see 2016ApJ...822...15S for further details. Applying these corrections makes the observed mass distribution narrower (blue lines in LABEL:galaxia_trilegal_fm_sigmam2). This is expected because for the stars that we study, the mean mass of a star increases with temperature and the correction factor decreases with temperature. The combined effect is that for high-mass stars, the mass decreases, and for low-mass stars, the mass increases. This leads to narrowing of the overall distribution. Computing corrections requires metallicity, and we adopted the spectroscopic metallicities reported by 2015ApJ...808..187B. Instead of applying the correction to the observed stars, we can also apply the reciprocal correction to the synthetic stars whose metallicity is known exactly. Doing so had negligible effect on the values quoted in Table 2 (see results in square brackets).
4. Discussion and conclusions
We have compared the asteroseismic properties of dwarfs and subgiants observed by Kepler against predictions of two population synthesis models of the Galaxy, TRILEGAL and Galaxia. The previous study by 2011Sci...332..213C using TRILEGAL found that stellar population synthesis based models overestimated the number of high-mass stars, which we are able to reproduce. We identified three potential factors that can shift the model mass distributions toward higher masses relative to the observed masses. First, TRILEGAL most likely overpredicts the number of young massive stars as it fails to match the color distribution of stars in 2MASS (2016ApJ...822...15S). Second, we found that a choice of that is 2% lower than that adopted by 2011Sci...332..213C, which is equally valid given the uncertainty in the actual value, can increase the observed masses by about 6%. Finally, we found that if a selection function based on oscillation amplitudes is used, the Galactic models cannot reproduce the distribution of the observed sample in space. This might be due to inaccuracies in the model, but could also be due to inaccuracies in the assumed selection function. Selecting the synthetic stars to satisfy the distribution in space removed this bias but shifted the model mass distribution to lower masses (LABEL:galaxia_trilegal_fm_sigmam2b,c).
The bias due to the mismatch of the color distribution can be corrected by using a model such as Galaxia, which does not show such a mismatch. The bias due to inaccuracies in the selection function based on oscillation amplitudes can be reduced by using a selection function based on and of the observed sample. Doing so, we find that the mass distribution of Galaxia is shifted toward lower masses and is also slightly broader compared to the observed distribution. A similar effect was also seen for the Kepler red giant sample 2016ApJ...822...15S, so the underlying cause might be the same. Applying corrections to the scaling relation predicted by stellar models makes the observed mass distribution narrower than observed but does not change the mean. The disagreement in the mass distributions reported here, translates to about 2% change in , which is comparable to the current uncertainty in the scaling relation. In future, we need to verify the scaling relations to better than 2% to put better constraints on the Galactic models.
However, Galaxia failed to match the distribution of observed stars in and space. This also needs to be investigated in future. The mismatch at high could be due to inaccuracies in predicting oscillation amplitudes because the detection probability of a star in this region is sensitive to its assumed amplitude. However, the mismatch at low is most likely due to inaccuracies in the model, because here we expect the detection probability to be close to
- Parallaxes, and hence luminosities, from Gaia will help resolve this issue because luminosity correlates with gravity.
Acknowledgements
We acknowledge the support of Galactic Archaeology and Precision Stellar Astrophysics program organized by Kavli Institute for Theoretical Physics (National Science Foundation Grant No. NSF PHY11-25915) for facilitating helpful discussions of results in this paper. We thank William Chaplin for allowing us to use his code for computing the probability of detecting oscillations.
S.S. is funded through ARC DP grant 120104562 (PI Bland-Hawthorn) which supports the HERMES project. D.S. is funded through Future Fellowship from the Australian Research Council (ARC). J.B.H. is funded through Laureate Fellowship from the Australian Research Council (ARC). D.H. acknowledges support by the Australian Research Council’s Discovery Projects funding scheme (project number DE140101364) and support by the National Aeronautics and Space Administration under Grant NNX14AB92G issued through the Kepler Participating Scientist Program.