Sampling a Network to Find Nodes of Interest
Pivithuru Wijegunawardana, Vatsal Ojha, Ralucca Gera, Sucheta, Soundarajan

TL;DR
This paper introduces REDLEARN, an algorithm designed to efficiently sample dark social networks and identify nodes of interest despite individuals concealing information, achieving significant improvements over existing strategies.
Contribution
The paper presents a novel sampling algorithm, REDLEARN, tailored for dark networks, accounting for lying scenarios, and demonstrating superior performance on real-world data.
Findings
REDLEARN outperforms existing strategies by up to 340%.
The algorithm effectively handles scenarios with individuals concealing information.
Results are validated on multiple real-world multilayered networks.
Abstract
The focus of the current research is to identify people of interest in social networks. We are especially interested in studying dark networks, which represent illegal or covert activity. In such networks, people are unlikely to disclose accurate information when queried. We present REDLEARN, an algorithm for sampling dark networks with the goal of identifying as many nodes of interest as possible. We consider two realistic lying scenarios, which describe how individuals in a dark network may attempt to conceal their connections. We test and present our results on several real-world multilayered networks, and show that REDLEARN achieves up to a 340% improvement over the next best strategy.
Click any figure to enlarge with its caption.
 Figure 1
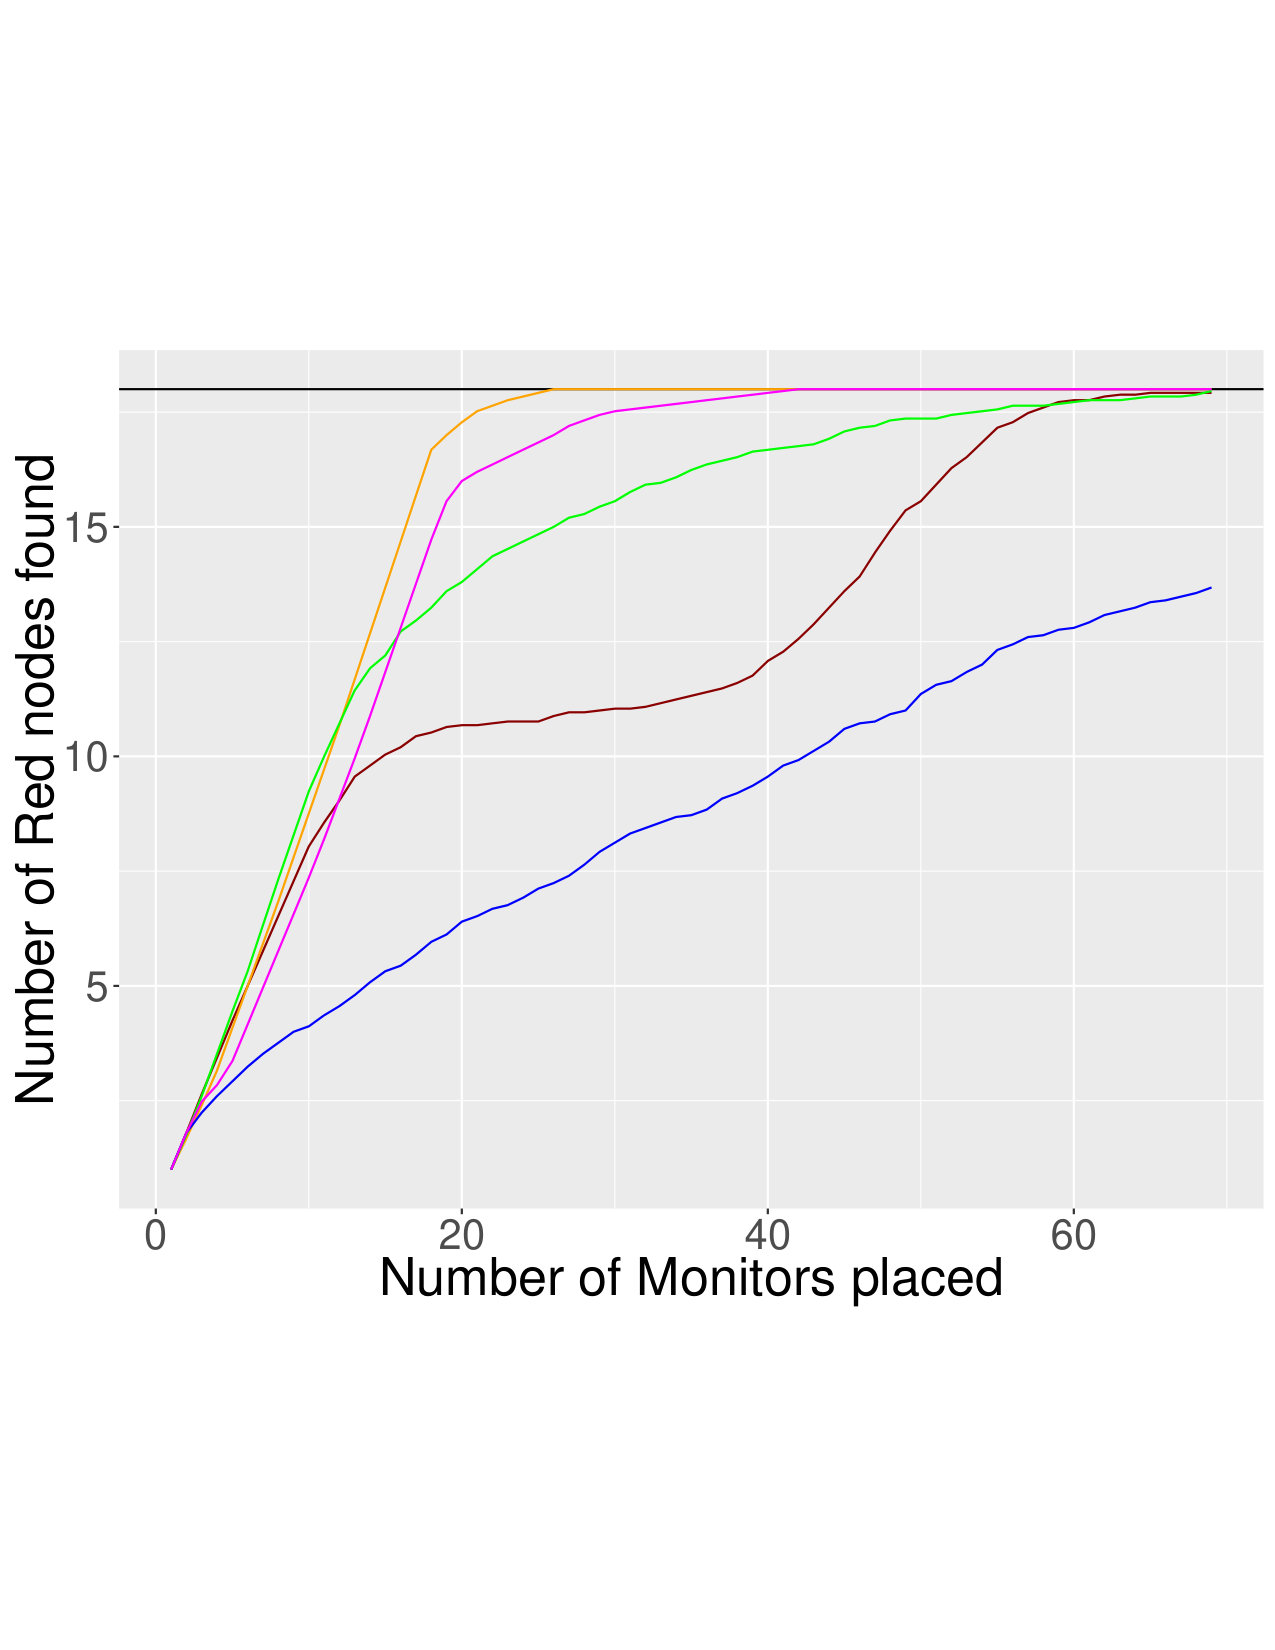 Figure 2
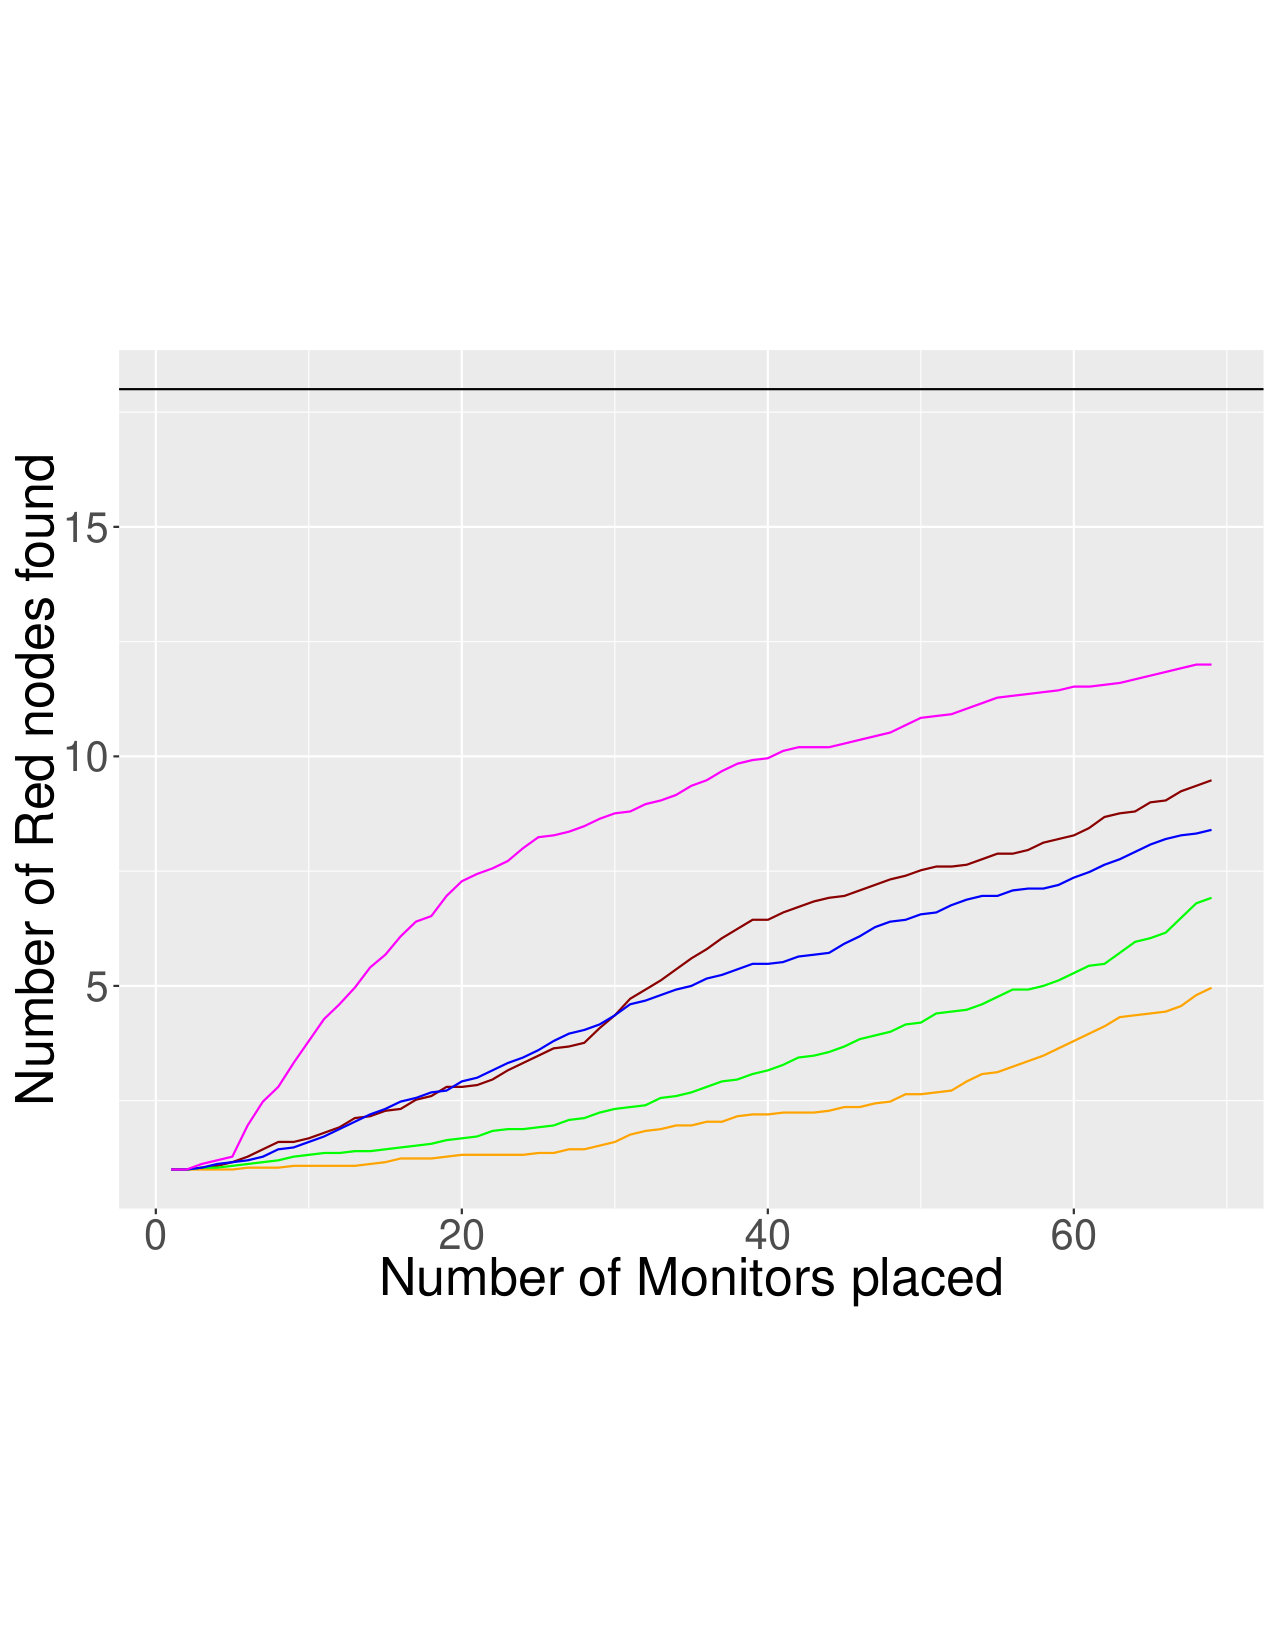 Figure 3
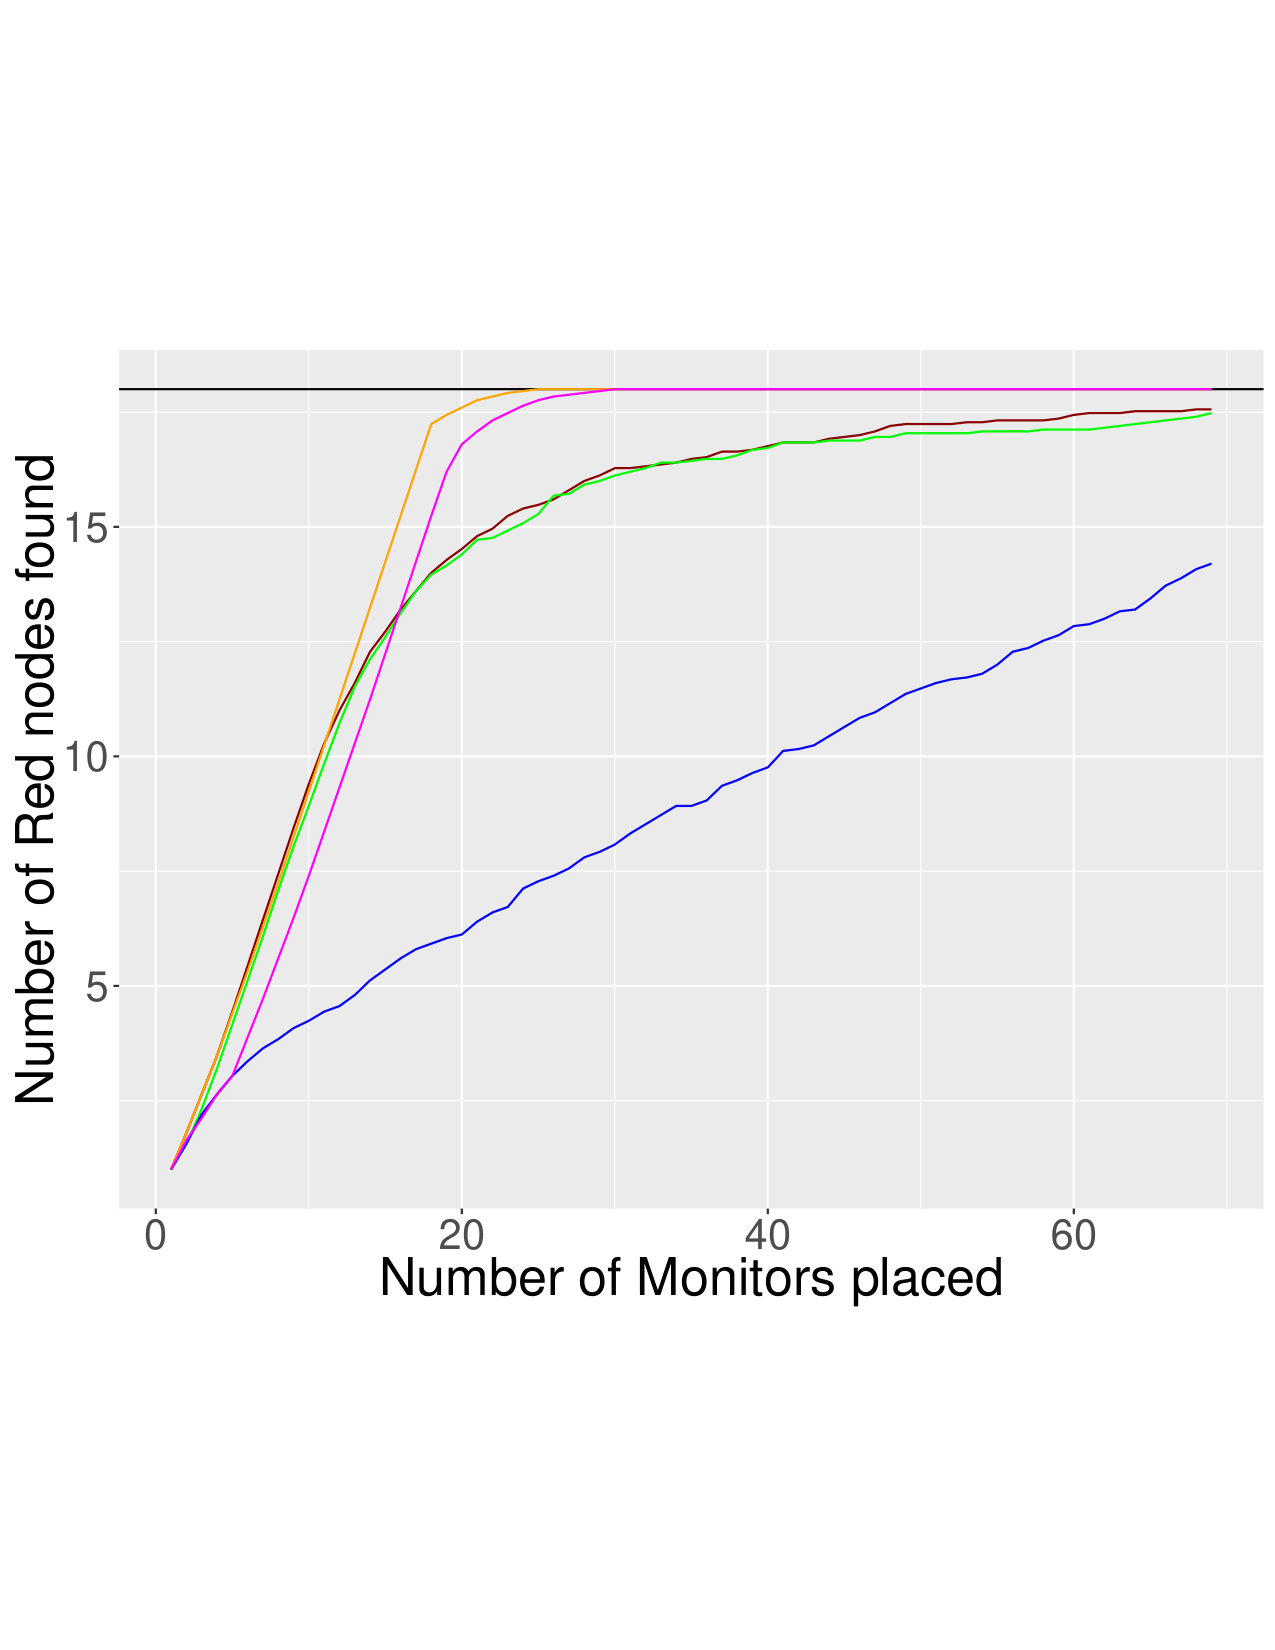 Figure 4
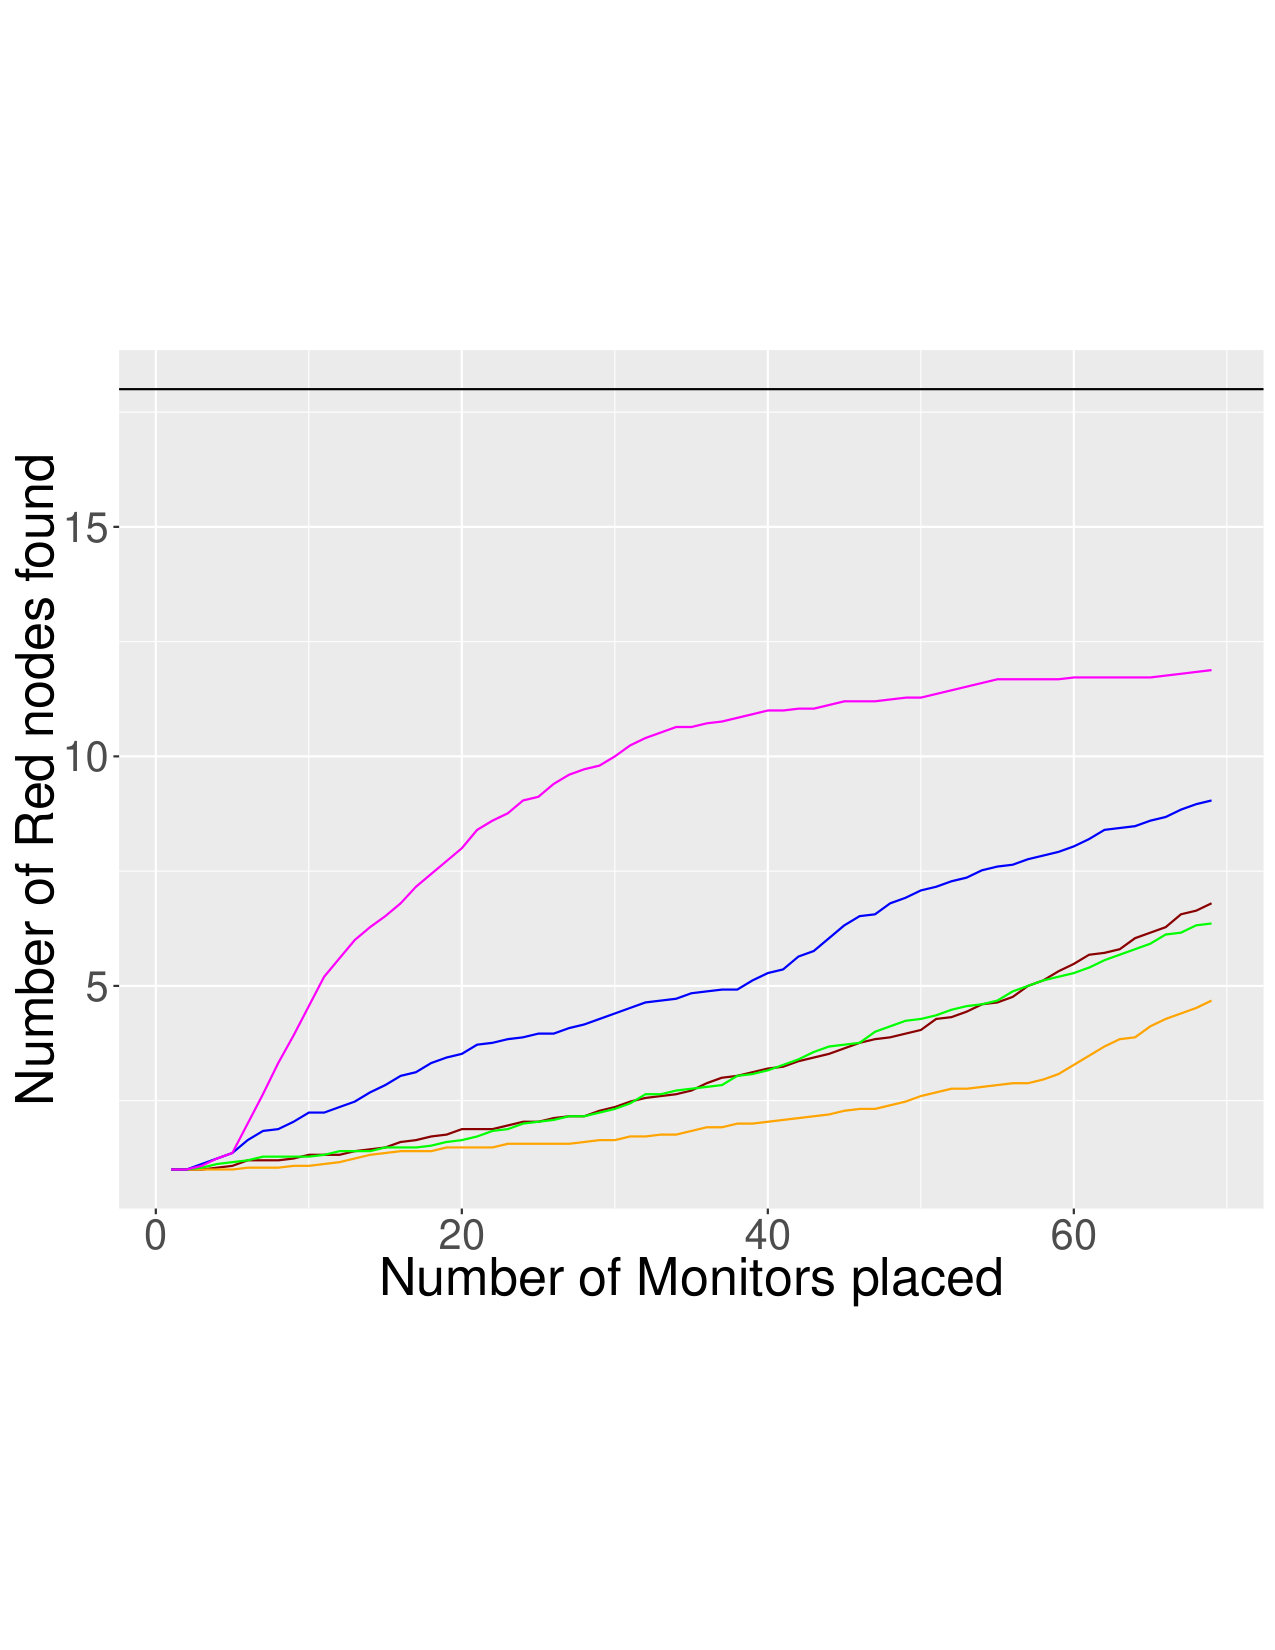 Figure 5
| Feature | Description | |
|---|---|---|
| (1) | Number of Red Neighbors | |
| (2) | Number of Blue neighbors | |
| (3) | Number of Red triangles if is red | |
| (4) | Red score | |
| (5) | Number of Red neighbors saying red | |
| (6) | Number of red neighbors saying blue | |
| (7) | Number of blue neighbors saying red | |
| (8) | Number of blue neighbors saying blue | |
| (9) | Inferred probability of being red |
| Network name | Red Node Count | Degrees of Red Nodes |
|---|---|---|
| NoordinComs 1 | 9 | 8,12,20,21,33,38,50 |
| NoordinComs 2 | 5 | 8,21,38,38,50 |
| NoordinComs 3 | 9 | 11,12,21,38,39,50,52 |
| NoordinComs 4 | 18 | 17,21,24,27,31,38,40,45,52,53,58 |
| NoordinComs 5 | 11 | 0,9,21,33,38,41,50,52 |
| Role | Hierarchy score | No. of nodes |
|---|---|---|
| Strategist | 5 | 10 |
| Commander; Religious Leader | 4 | 23 |
| Trainer/instructor; Bomb maker; Facilitator; Propagandist; Recruiter | 3 | 33 |
| Bomber/fighter; Suicide Bomber; Courier; Recon/Surveillance | 2 | 33 |
| Unknown | 1 | 40 |
| Low Budget | Medium Budget | High Budget | |||||||||||||||
|
RS | RdLrn | MRN | MRSR | SR | RS | RdLrn | MRN | MRSR | SR | RS | RdLrn | MRN | MRSR | SR | ||
| NrdnComs1 | 28 | 74 | 97 | 52 | 32 | 43 | 97 | 100 | 77 | 51 | 97 | 100 | 100 | 92 | 75 | ||
| NrdnComs2 | 42 | 37 | 62 | 48 | 42 | 61 | 72 | 100 | 72 | 55 | 99 | 93 | 100 | 91 | 81 | ||
| NrdnComs3 | 33 | 63 | 83 | 52 | 27 | 59 | 89 | 100 | 77 | 46 | 100 | 100 | 100 | 97 | 73 | ||
| NrdnComs4 | 54 | 60 | 70 | 66 | 28 | 63 | 98 | 100 | 90 | 48 | 100 | 100 | 100 | 100 | 76 | ||
| NrdnComs5 | 34 | 67 | 84 | 52 | 32 | 43 | 91 | 91 | 75 | 46 | 88 | 91 | 91 | 86 | 67 | ||
| PokeC age | 5 | 14 | 22 | 20 | 7 | 15 | 43 | 47 | 39 | 21 | 48 | 73 | 68 | 62 | 47 | ||
| PokeC height | 14 | 14 | 21 | 23 | 11 | 36 | 32 | 48 | 47 | 28 | 74 | 64 | 73 | 69 | 54 | ||
| Low Budget | Medium Budget | High Budget | |||||||||||||||
|
RS | RdLrn | MRN | MRSR | SR | RS | RdLrn | MRN | MRSR | SR | RS | RdLrn | MRN | MRSR | SR | ||
| NrdnComs1 | 57 | 78 | 89 | 57 | 33 | 82 | 100 | 100 | 79 | 47 | 96 | 100 | 100 | 95 | 73 | ||
| NrdnComs2 | 56 | 54 | 83 | 55 | 38 | 83 | 66 | 99 | 82 | 52 | 94 | 89 | 100 | 94 | 74 | ||
| NrdnComs3 | 50 | 70 | 76 | 52 | 34 | 77 | 85 | 100 | 80 | 50 | 99 | 97 | 100 | 99 | 77 | ||
| NrdnComs4 | 68 | 62 | 74 | 67 | 28 | 92 | 100 | 100 | 91 | 50 | 98 | 100 | 100 | 97 | 79 | ||
| NrdnComs5 | 59 | 64 | 88 | 59 | 32 | 79 | 91 | 91 | 79 | 50 | 89 | 91 | 91 | 90 | 74 | ||
| PokeC age | 20 | 12 | 22 | 19 | 7 | 39 | 33 | 47 | 39 | 21 | 62 | 60 | 68 | 62 | 46 | ||
| PokeC height | 23 | 12 | 21 | 23 | 12 | 46 | 29 | 48 | 46 | 28 | 69 | 62 | 73 | 69 | 54 | ||
| Low Budget | Medium Budget | High Budget | |||||||||||||||
|
RS | RdLrn | MRN | MRSR | SR | RS | RdLrn | MRN | MRSR | SR | RS | RdLrn | MRN | MRSR | SR | ||
| NrdnComs1 | 16 | 33 | 12 | 14 | 22 | 38 | 46 | 20 | 27 | 36 | 72 | 64 | 40 | 48 | 58 | ||
| NrdnComs2 | 30 | 70 | 21 | 26 | 35 | 50 | 82 | 26 | 41 | 55 | 86 | 94 | 52 | 63 | 84 | ||
| NrdnComs3 | 21 | 59 | 12 | 14 | 22 | 57 | 82 | 16 | 28 | 44 | 76 | 99 | 41 | 57 | 76 | ||
| NrdnComs4 | 12 | 30 | 6 | 8 | 12 | 31 | 52 | 11 | 15 | 28 | 53 | 67 | 28 | 38 | 47 | ||
| NrdnComs5 | 13 | 35 | 10 | 11 | 16 | 30 | 51 | 12 | 18 | 26 | 52 | 55 | 28 | 34 | 40 | ||
| PokeC age | 5 | 13 | 5 | 6 | 7 | 14 | 34 | 16 | 18 | 20 | 43 | 59 | 39 | 41 | 44 | ||
| PokeC height | 13 | 14 | 5 | 7 | 11 | 33 | 33 | 15 | 19 | 27 | 69 | 59 | 37 | 44 | 52 | ||
| Low Budget | Medium Budget | High Budget | |||||||||||||||
|
RS | RdLrn | MRN | MRSR | SR | RS | RdLrn | MRN | MRSR | SR | RS | RdLrn | MRN | MRSR | SR | ||
| NrdnComs1 | 14 | 33 | 12 | 14 | 22 | 21 | 53 | 19 | 24 | 41 | 53 | 64 | 40 | 48 | 63 | ||
| NrdnComs2 | 26 | 58 | 22 | 25 | 37 | 40 | 70 | 26 | 35 | 54 | 68 | 83 | 54 | 70 | 84 | ||
| NrdnComs3 | 15 | 64 | 12 | 16 | 23 | 26 | 85 | 17 | 23 | 38 | 54 | 98 | 41 | 57 | 70 | ||
| NrdnComs4 | 8 | 35 | 7 | 8 | 15 | 15 | 59 | 10 | 15 | 27 | 38 | 66 | 26 | 35 | 50 | ||
| NrdnComs5 | 9 | 39 | 9 | 11 | 18 | 16 | 47 | 13 | 17 | 27 | 33 | 53 | 27 | 35 | 42 | ||
| PokeC age | 6 | 10 | 5 | 6 | 7 | 16 | 26 | 14 | 16 | 18 | 42 | 59 | 39 | 41 | 44 | ||
| PokeC height | 6 | 12 | 5 | 7 | 10 | 19 | 28 | 15 | 19 | 26 | 43 | 58 | 37 | 43 | 52 | ||
Peer Reviews
No public reviews on file for this paper yet. If you reviewed it on a platform where reviews are public (OpenReview, ICLR, NeurIPS, ICML), you can paste yours below so the community can read it here.
Videos
No videos yet. Explain this paper in a talk, walkthrough, or lecture? Add one.
Taxonomy
TopicsMisinformation and Its Impacts · Spam and Phishing Detection · Complex Network Analysis Techniques
11institutetext: 1 Syracuse University, Department of Electrical Engineering & Computer Science,
11email: ppwijegu,[email protected]
2 Dougherty Valley High School, San Ramon, California, 11email: [email protected]
3Naval Postgraduate School, Department of Applied Mathematics, Monterey, CA, 11email: [email protected]
Sampling a Network to Find Nodes of Interest
Pivithuru Wijegunawardana1
Vatsal Ojha2
Ralucca Gera3 Ralucca Gera would like to thank the DoD for partially sponsoring the current research.
Sucheta Soundarajan1
Abstract
The focus of the current research is to identify people of interest in social networks. We are especially interested in studying dark networks, which represent illegal or covert activity. In such networks, people are unlikely to disclose accurate information when queried. We present RedLearn, an algorithm for sampling dark networks with the goal of identifying as many nodes of interest as possible. We consider two realistic lying scenarios, which describe how individuals in a dark network may attempt to conceal their connections. We test and present our results on several real-world multilayered networks, and show that RedLearn achieves up to a 340% improvement over the next best strategy.
Keywords:
multilayered networks, sampling methods, lying scenarios, nodes of interest
1 Introduction and Motivation
The advent of big data in today’s complex environment requires decision makers to act in an overwhelmingly rich environment (or network) based on partial information of that network. Using an observed portion of some network, it is often desirable to make inferences about which unobserved areas of the network to explore next. Often, it is of particular interest to locate “people of interest” (POI) residing in these networks. These individuals may be trying to conceal themselves, or may be protected by others.
Our work was motivated by study of terrorist networks. These networks typically include several types of relationships connecting people, producing multilayered networks where each layer is defined by a different relationship. For example, one of the networks contains data depicting relationships among terrorists in the ’Noordin Top’ Network in Indonesia, where relationships are organizations these terrorists belong to, the schools or trainings they went to, kinship, recruiting and so on. The data was collected by Everton et. al Roberts & Everton, (2011) and compiled into a network by Gera et al. in Gera *et al. *, (2011).
It is generally desired to find those POIs that possess a certain attribute, such as people who attended a specific planning meeting or who were involved in organizing a particular attack. For our specific work, in the insurgent network Noordin Top (see Section 5.1) all the people that were communicating using a certain medium were tagged as being POI, producing a relatively small number of POI. We assume that we begin with knowledge of one POI in the network, with the rest of the network unobserved (both in terms of topology as well as node attributes). Our goal is to sample the network in such a way that we observe as many POIs as possible. To our knowledge, we are the first to consider the problem of sampling with the goal of identifying nodes of interest in a setting with misinformation.
We present RedLearn, a novel, learning-based algorithm for sampling networks with the goal of finding as many POIs as possible. We show that in cases where the POIs exhibit homophily (i.e., are likely to be connected to other POIs), a simple strategy of choosing the node with the most POI neighbors works well. However, in the more realistic scenario where POIs hide their connections with other POIs, RedLearn shows outstanding performance, beating the next best strategy by up to 340%.
2 Problem Definition
We refer to nodes representing POIs as ‘red’ nodes, and other nodes as ‘blue’, giving us a purple network. We assume that there is an unobserved, underlying graph , in which each node has color . We begin with having knowledge of only one red node in .
To increase our observation of the network, we place monitors on nodes. A monitor tells us (1) the true color of the node being placed on, (2) the true neighbors of that node, and (3) the colors of the node’s neighbors, possibly with inaccuracies. For example, placing a monitor on a suspected terrorist could represent determining whether that person is actually a terrorist, determining who his or her e-mail or phone contacts are, and questioning the individual about whether those neighbors are themselves terrorists. Naturally, some individuals may lie about the colors of those neighbors.111We consider two realistic ’lying scenarios’; these are described in Section 4.2.
We assume that we are given a budget of monitors, and can place those monitors on any node that has been observed. In the first step, we must place a monitor on the initially observed node, because no other nodes were observed. In subsequent steps, we may place a monitor on any node that has been observed as a neighbor of a previously-monitored node.
Our goal is to maximize the total number of red nodes observed.
3 Related Work
Our work here is related to work on analyzing dark networks, a special type of social network Baker & Faulkner, (1993). A dark network is network that is illegal and covert Raab & Milward, (2003), whose members are actively trying to conceal network information even at the expense of efficiency Baker & Faulkner, (1993), and the existing connections are used infrequently Raab & Milward, (2003). Because a dark network is deceptive by nature, we examine the lying methodologies along with the discovery methods in looking for the POI.
There are a multitude of sampling techniques for network exploration, including random walks (Asztalos & Toroczkai, (2010), Hughes, (1996), Noh & Rieger, (2004)), biased random walks (Fronczak & Fronczak, (2009)), or walks combined with reversible Markov Chains(Aldous & Fill, (2002)), Bayesian methods(Friedman & Koller, (2003)), or standard exhaustive search algorithms like depth-first or breadth-first searches, such as Adamic *et al. *, (2001); Biernacki & Waldorf, (1981); Bliss *et al. *, (2014); Davis *et al. *, (2016); Leskovec & Faloutsos, (2006). However, these methods fail in using discovered knowledge, such as node attributes, effectively.
Various researchers have considered the problem of sampling for specific goals, such as maximizing the number of nodes observed. For example, Avrachenkov, et al. present an algorithm to sample the node with the highest estimated unobserved degree Avrachenkov *et al. *, (2014). Hanneke and Xing Hanneke & Xing, (2009), and Maiya and Berger-Wolf Maiya & Berger-Wolf, (2010) examine online sampling for centrality measures. Macskassy and Provost develop a guilt-by-association method to identify suspicious individuals in a partially-known network Macskassy & Provost, (2005).
4 Proposed Method: RedLearn
A monitor placement strategy is an incremental sampling strategy. In each step, it uses current knowledge of the discovered graph, including the observed topology of the graph, known colors of nodes (observed by monitors placed directly on those nodes), and the stated colors of monitored nodes’ neighbors (i.e., for each neighbor of a monitored node, whether the monitored node said that that neighbor was red or blue). With this information, the strategy determines where to place the next monitor to discover the most number of red nodes. This continues until the monitor budget is exhausted.
monitored node is a node with a monitor placed on it. A monitored node is known red (or blue). Recall that a monitored node may lie about its neighbors’ colors; thus the color of a node is not known with certainty until it is monitored. Let refer to the set of neighbors of .
4.1 Baseline Monitor Placement Strategies
We now describe several natural monitor placement strategies. We use these strategies as comparison algorithms in our experiments; additionally, some of these strategies are used in developing our learning strategy RedLearn.
Smart Random Sampling (SR): In each step, the Smart Random Placement strategy places monitors on a random unmonitored node. Due to the inefficiency of using no information about the network for monitor placement, this is used as a lower bound placement strategy for the introduced methodologies.
Red Score (RS): The Red Score strategy is guided by the colors reported by neighbors of a node. If a node reports its neighbor as red, the score associated with node is increased by one, making it more suspicious. This strategy selects the node with highest red score to place the next monitor. For this method, the red score is highly impacted by the accuracy of information given by the neighboring node. Additionally, due to its use of both red and blue node information, this strategy uses the most amount of information as compared to the other baseline strategies.
Most Red Say Red (MRSR): The MRSR strategy places a monitor on the node with the greatest number of red neighbors who report it as a red node. It does not factor in blue node information and is dependent solely on the accuracy of the information given by neighboring red nodes. Blue nodes are essentially useless in this strategy, mimicking the reality when they might not know who the POIs are. This placement strategy would result in a red node with no red neighbors being impossible to discover except by chance.
Most Red Neighbors (MRN): The MRN placement strategy places a monitor on the node with the most known red neighbors. This strategy ignores what the monitored nodes say about their neighbors. This strategy would likely work best in a network with high homophily. Similar to the MRSR strategy, blue neighbors are unimportant in determining the likelihood of a given node being red.
4.2 RedLearn: A Learning Based Monitor Placement Strategy
When determining which node to place the next monitor on, for each candidate node (i.e., each observed but unmonitored node), the strategies above consider the colors of ’s neighbors and/or the color that each of ’s monitored neighbors reported.
Intuitively, if the original network displays homophily, the probability of node being a red node is higher if it has many red neighbors. But if the network does not display homophily, using this measure can result in poor performance. Note that we expect many dark networks to exhibit low or even anti-homophily, as malicious actors are likely to go out of their way to conceal their connections.
Additionally, some monitor placement strategies like red score, depend on information given by neighbors. The performance of such monitor placement criteria thus heavily depend on the policies that nodes follow when stating their neighbors’ colors.
To overcome these dependencies, we propose RedLearn, a learning based monitor placement strategy. Our goal is to successfully predict the probability of a node being red () based on the observed network structure and what ’s neighbors say about . We model this as a two class classification problem, but rather than looking at the assigned label (Red or Blue), we are more interested in finding . Once these probabilities are determined, RedLearn places the next monitor on the node with the highest such probability.
**Features: ** Table 1 describes the set of features used in our learning based monitor placement algorithm. There are two types of features: () Network structure-based features (), and () Neighbor answer-based features ().
Network structure-based features are used to learn the patterns of connections between red nodes (e.g., homophily vs. anti-homophily). Neighbor answer-based features are intended to learn the relationship between what a node says about its neighbors’ colors and the true colors of those neighbors.
**Inferred probability of being red: ** We formulate four different probabilities to measure the trustworthiness of colors given by differently colored nodes (i.e., whether a monitored node lies or is honest about its neighbors’ colors). We use the information collected prior to placing a monitor on a node to calculate these probabilities. Consider a node which was discovered through a monitor placed on node .
2. 2.
3. 3.
4. 4.
Given a node , we calculate the inferred probability, using equation 1.
[TABLE]
Training Data: Suppose that we have placed monitors so far. Then the training set consists of the true colors of the monitored nodes along with their respective feature values. To determine where to place the monitor, we train the learning model using this data.
Classification Algorithm: Our goal is finding for each unmonitored node . Because we are predicting a probability rather than a binary label, we propose using a logistic regression classifier. Furthermore, because the learning model must be updated frequently, this classifier gives an added advantage of faster training.
Placing the Next Monitor (Prediction): Given the placement of monitors and deciding to place the monitor, RedLearn considers all unmonitored nodes discovered so far. Next, it calculates feature vectors associated with these non monitor nodes, and applies the classifier to these feature vectors, giving the probability that each unmonitored node is red. RedLearn selects the node with the highest probability for placing the next monitor. Algorithm 1 summarizes RedLearn.
5 Experimental Set Up
In section 5.1, we give a description of our network datasets, and then consider them without homophily as described in Section 5.2. In Section 5.3, we introduce two lying scenarios to model the lying behavior of a node (i.e., whether it says its neighbors are red or blue). Finally, we describe our experimental setup.
5.1 Datasets
Noordin Top Network: The first network studied is Noordin Top, a relatively small, but real network with nodes and edges depicting several types of relationships between them (‘Noordin Top’ is the name of the leader of this network).222Obtained from https://sites.google.com/site/sfeverton18/research/appendix-1. In this network, every node is a terrorist, and we are interested in identifying those individuals that communicate using a certain medium. We consider 5 versions of this network. In NoordinComs1, the POI (red nodes) are those communicating using a general computer medium; in NoordinComs2, the red nodes are those who communicate using print media; in NoordinComs3, the red nodes are those who communicate using support materials; in NoordinComs4, the red nodes are those who communicate using unknown media; in NoordinComs5, the red nodes are those who communicate using video (Table 2).
PokeC Network: The PokeC network is part of a Slovenian on-line social network.333Obtained from http://snap.stanford.edu/data/. The nodes in the network are users of the social network and edges depicts friendship relations. Each node has some number of associated user attributes (e.g., age, region, gender, interests, height etc.). We use a sample of this network containing all nodes in the region ”kosicky kraj, michalovce” and edges among them. This sampled network contains nodes and edges.
We assign node colors based on two different node attributes: age (a node with age in the range 28-32 is marked red, and blue otherwise, giving red nodes) and height (a user of height less than is marked red, giving red nodes).
5.2 Eliminating Homophily
In both networks that we consider, red nodes tend to be connected to each other. However, in a dark network where red nodes are actively trying to hide their presence, these nodes would conceal the existence of such connections (for example, instead of using their normal cell phone to make calls to other red nodes, a red node might use a burner phone for such calls). To account for this, we consider versions of our datasets where all connections between red nodes are removed. Note that this type of network presents a much more challenging setting, as one cannot simply rely on homophily to find red nodes.
5.3 Lying Scenarios
Recall that a monitor tells us the true color of the monitored node and the possibly incorrect colors of that node’s neighbors. Because we do not have data describing how terrorists lie to prevent detection of other terrorists, we must simulate this behavior.
In formulating these lying scenarios, we assume the existence of a hierarchy among the nodes, where nodes are more likely to lie to protect those above them in the hierarchy. We assume that the red nodes are fully aware of the hierarchy, but blue nodes may or may not be aware, depending on the scenario.
In both lying scenarios, we assume that nodes may lie not only about the color of red nodes (i.e., lie to protect POIs), but also about the color of blue nodes (i.e., framing innocent individuals as a distraction). Without this assumption, the problem would be trivial, because anytime any individual said a node was red, we would know with full certainty that that node is actually red.
Consider nodes and , where . The probability that lies about , depends on:
- •
The color of () and color of ().
- •
The inherent honesty of (), where higher values indicate that is more predisposed to telling the truth.
- •
The hierarchical position of () relative to the position of ().
Suppose is a red node. In all lying scenarios, the probability that lies about another node is given by the following equations:
Equation 2 determines the probability will lie about a red node. indicates how far above is in the hierarchy compared to and is probability that will lie.
[TABLE]
Equation 3 defines the probability will lie about a blue node. This depends on ’s honesty and is calculated as .
[TABLE]
Now suppose that is a blue node. may know nothing about red nodes. This depends largely on whether the blue nodes are part of the same organization as the red nodes, but are simply not of interest to the user (e.g., blue and red nodes are all terrorists, and red nodes represent a subset of interest), or if the blue nodes represent individuals who are not part of the same organization as the red nodes (e.g., the red nodes are terrorists in a sea of blue node civilians).
- •
Lying scenario-1 (LS1): Blue nodes know about red nodes. Here, is determined using equation 2, since blue nodes know about red nodes and their hierarchy. Additionally, blue nodes may lie about other blue nodes. is thus calculated using equation 3.
- •
Lying scenario-2(LS2): Blue nodes don’t know about red nodes. Here, blue nodes will simply say that all their neighbors are blue. Because of this and
In all cases, if is greater than 1, it is rounded down to 1.
5.4 Experiments
Since our lying scenarios are probabilistic, the colors that nodes say about neighbors can change from one run of the algorithm to another. Additionally, the honesty assignment to a node also can change from one run to another. Thus, for each network and lying scenario, we perform 25 runs of each monitor placement strategy.
In each run, we begin with a randomly selected red node. For a fair comparison across different monitor placement strategies, we make sure that we run each monitor placement strategy with the same sets of starting nodes and honesty assignments.
In these experiments, the honesty of a node is drawn from a normal distribution, . In the Noordin Top network, ground truth hierarchy scores are known, and shown in Table 3. In the PokeC network, we set the hierarchy score to be the degree of the node. Given a particular lying scenario, a monitored node lies about a neighbor ’s color with probability as given in Section 5.3.
In each run, we consider budgets up to half the number of nodes in the network. The Noordin Top network is small, and so we retrain RedLearn after each monitor is placed. The PokeC network is larger, so for the sake of efficiency, we train the learning model once per every monitors placed.
6 Results and Analysis
In this section, we compare the results based on the various monitor placement strategies, and examine how performance is affected by (1) the presence or absence of homophily, (2) the lying scenario used by the nodes, and (3) the monitor placement budget.
As an example, Figure 1 shows results on the NoordinComs4 network with and without edges between red nodes, respectively. When there is homophily, the problem becomes easy, and the simple strategy of monitoring the node with the most red neighbors (MRN) is best. However, note that in both lying scenarios, RedLearn is close behind the MRN strategy (because it needs time to train, it doesn’t quite match the performance of MRN).
However, we see from the bottom figures that when edges between red nodes are removed, the MRN strategy performs very poorly. In this setting, RedLearn performs much better than all comparison methods: it is able to learn the patterns and structural characteristics of red nodes, and by incorporating what neighbors say about a node, achieves strong performance.
Due to space constraints, we summarize results for the other cases in Tables 4 and 5. We see similar patterns across all networks: when there are edges between red nodes, it is enough to select the node with the most red neighbors; but when these edges are concealed, RedLearn is the clear winner.
Even when there are edges between red nodes, RedLearn usually achieves performance close to the MRN strategy. There are some exceptions, such as the NoordinComs2 network. This typically occurs if there are very few red nodes: for instance, NoordinComs2, only 5 out of 139 nodes are red. There is simply not enough information for RedLearn to train on.
This analysis shows that performance of the proposed algorithm does not rely on a particular network structure, or which lying scenario people might use. Therefore using learning based monitor placement is guaranteed to give better performance, especially in real networks, which are large.
7 Conclusions and Further Directions
Members of dark networks conceal information by nature, and while deceptive and sparse, they are still structured. Based on these properties, we created and analyzed the results of several methods of sampling the networks to identify POI (red nodes). We developed a variety of natural sampling methods, and tested them both on a small real terrorist network as well as a larger social network.
We then created RedLearn, a learning-based method for locating People of Interest in dark networks. RedLearn uses features from the simpler methods and learns how to identify red nodes in networks. We showed that RedLearn outperforms the other methods in cases where one cannot rely on homophily to identify red nodes.
In our future work, one interesting direction is to consider the dynamicity of the network (both on the edge and node rate of birth and retirement), as well as a more sophisticated model of the concealed nodes and relationships.
The reference list from the paper itself. Each links out to its DOI / PubMed record.
- 1Adamic et al. , [2001] Adamic, Lada A., Lukose, Rajan M., Puniyani, Amit R., & Huberman, Bernardo A. 2001. Search in power-law networks. Physical review E , 64 (4), 046135.
- 2Aldous & Fill, [2002] Aldous, David, & Fill, Jim. 2002. Reversible Markov chains and random walks on graphs .
- 3Asztalos & Toroczkai, [2010] Asztalos, A., & Toroczkai, Z. 2010. Network discovery by generalized random walks. EPL (Europhysics Letters) , 92 (5), 50008.
- 4Avrachenkov et al. , [2014] Avrachenkov, Konstantin, Basu, Prithwish, Neglia, Giovanni, Ribeiro, Bruno, & Towsley, Don. 2014. Pay Few, Influence Most: Online Myopic Network Covering. In: IEEE Net Sci Com Workshop .
- 5Baker & Faulkner, [1993] Baker, Wayne E., & Faulkner, Robert R. 1993. The social organization of conspiracy: Illegal networks in the heavy electrical equipment industry. American sociological review , 837–860.
- 6Biernacki & Waldorf, [1981] Biernacki, Patrick, & Waldorf, Dan. 1981. Snowball sampling: Problems and techniques of chain referral sampling. Soc. methods & research , 10 (2), 141–163.
- 7Bliss et al. , [2014] Bliss, Catherine A., Danforth, Christopher M., & Dodds, Peter Sheridan. 2014. Estimation of global network statistics from incomplete data. Plo S one , 9 (10), e 108471.
- 8Davis et al. , [2016] Davis, Benjamin, Gera, Ralucca, Lazzaro, Gary, Lim, Bing Yong, & Rye, Erik C. 2016. The Marginal Benefit of Monitor Placement on Networks. Pages 93–104 of: Complex Networks VII . Springer.