Vacuum-ultraviolet frequency-modulation spectroscopy
Urs Hollenstein, Hansj\"urg Schmutz, Josef Anton Agner, Marcel, Sommavilla, Fr\'ed\'eric Merkt

TL;DR
This paper extends frequency-modulation spectroscopy to the vacuum-ultraviolet range, enabling sensitive, background-free VUV absorption measurements using table-top lasers and demonstrating its effectiveness on noble gases and nitrogen.
Contribution
The authors develop a novel VUV FM spectroscopy method using resonance-enhanced sum-frequency mixing and demonstrate its advantages over traditional techniques.
Findings
High sensitivity and background-free VUV spectra obtained
Simultaneous recording of absorption, fluorescence, and photoionization spectra
Effective for cold samples in supersonic beams
Abstract
Frequency-modulation (FM) spectroscopy has been extended to the vacuum-ultraviolet (VUV) range of the electromagnetic spectrum. Coherent VUV laser radiation is produced by resonance-enhanced sum-frequency mixing () in Kr and Xe using two near-Fourier-transform-limited laser pulses of frequencies and . Sidebands generated in the output of the second laser () using an electro-optical modulator operating at the frequency are directly transfered to the VUV and used to record FM spectra. Demodulation is demonstrated both at and . The main advantages of the method are that its sensitivity is not reduced by pulse-to-pulse fluctuations of the VUV laser intensity, compared to VUV absorption spectroscopy is its background-free nature, the fact that its…
Click any figure to enlarge with its caption.
 Figure 1
 Figure 2
 Figure 3
 Figure 4
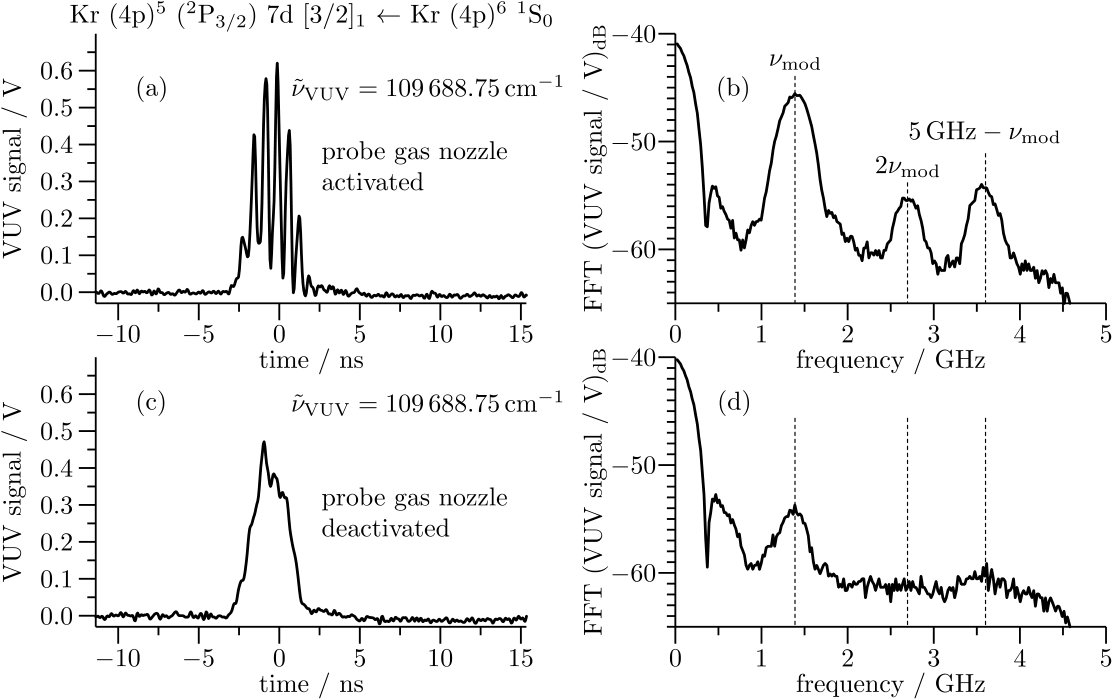 Figure 5
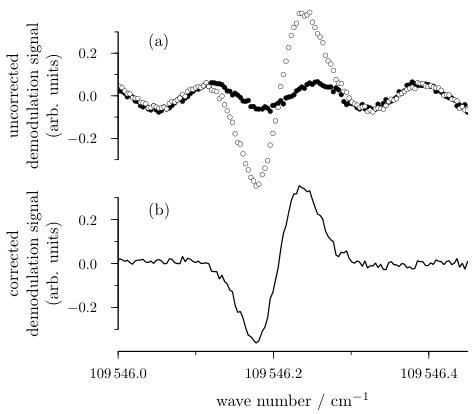 Figure 6
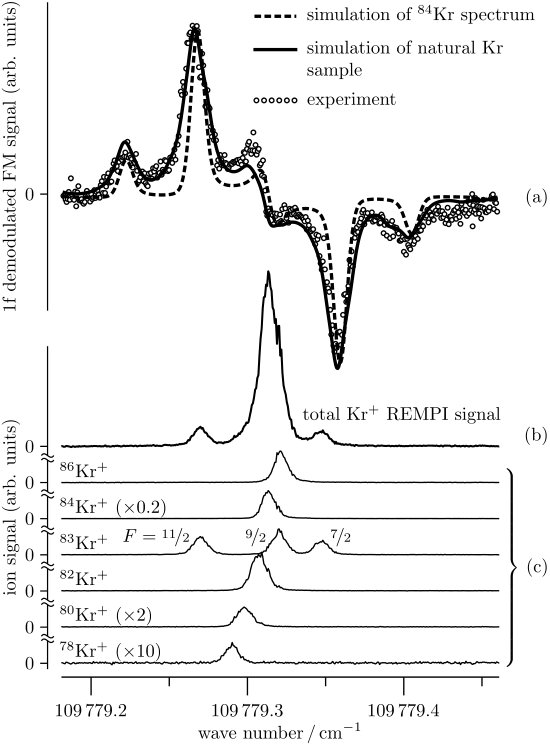 Figure 7
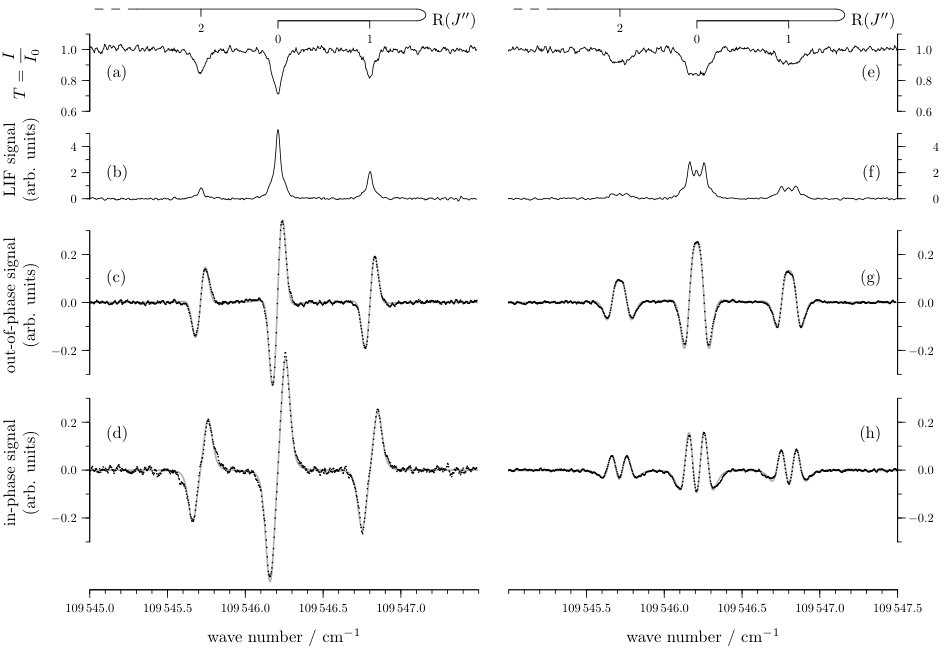 Figure 8
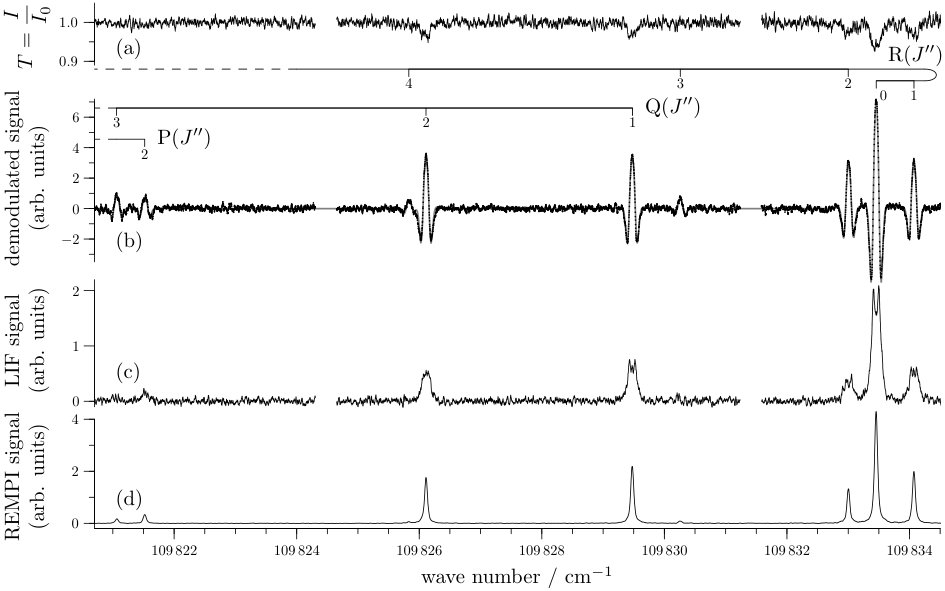 Figure 9
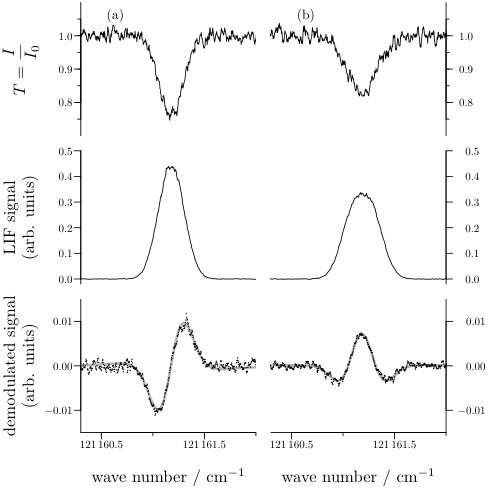 Figure 10
| Isotope | |
|---|---|
| 78Kr | 109 779.290(16) |
| 80Kr | 109 779.298(16) |
| 82Kr | 109 779.307(16) |
| 83Kr () | 109 779.270(16) |
| 83Kr () | 109 779.320(16) |
| 83Kr () | 109 779.347(16) |
| 84Kr | 109 779.314(16) |
| 86Kr | 109 779.321(16) |
| this work | Ref. Carroll and Collins,1969 | ||
| Transition | |||
| b′(8)X(0) | R(0) | 109 546.206 | |
| R(1) | 109 546.800 | ||
| R(2) | 109 545.710 | ||
| b(12)X(0) | R(0) | 109 833.454 | 109 833.511122footnotemark: 2 33footnotemark: 3 44footnotemark: 4 Unresolved transitions. |
| R(1) | 109 834.071 | 109 833.511footnotemark: 1 | |
| R(2) | 109 833.003 | 109 833.511footnotemark: 1 | |
| R(3) | 109 830.257 | 109 829.922footnotemark: 2 | |
| R(4) | 109 825.826 | 109 825.933footnotemark: 3 | |
| Q(1) | 109 829.475 | 109 829.922footnotemark: 2 | |
| Q(2) | 109 826.112 | 109 825.933footnotemark: 3 | |
| Q(3) | 109 821.065 | 109 821.144footnotemark: 4 | |
| P(2) | 109 821.520 | 109 821.144footnotemark: 4 | |
Peer Reviews
No public reviews on file for this paper yet. If you reviewed it on a platform where reviews are public (OpenReview, ICLR, NeurIPS, ICML), you can paste yours below so the community can read it here.
Videos
No videos yet. Explain this paper in a talk, walkthrough, or lecture? Add one.
Vacuum-ultraviolet frequency-modulation spectroscopy
U. Hollenstein
Laboratorium für Physikalische Chemie, ETH Zürich, 8093 Zürich, Switzerland
H. Schmutz
Laboratorium für Physikalische Chemie, ETH Zürich, 8093 Zürich, Switzerland
J. A. Agner
Laboratorium für Physikalische Chemie, ETH Zürich, 8093 Zürich, Switzerland
M. Sommavilla
Laboratorium für Physikalische Chemie, ETH Zürich, 8093 Zürich, Switzerland
F. Merkt
Laboratorium für Physikalische Chemie, ETH Zürich, 8093 Zürich, Switzerland
Abstract
Frequency-modulation (FM) spectroscopy has been extended to the vacuum-ultraviolet (VUV) range of the electromagnetic spectrum. Coherent VUV laser radiation is produced by resonance-enhanced sum-frequency mixing () in Kr and Xe using two near-Fourier-transform-limited laser pulses of frequencies and . Sidebands generated in the output of the second laser () using an electro-optical modulator operating at the frequency are directly transfered to the VUV and used to record FM spectra. Demodulation is demonstrated both at and . The main advantages of the method compared to VUV absorption spectroscopy is its background-free nature, the fact that its implementation using table-top laser equipment is straightforward and that it can be used to record VUV absorption spectra of cold samples in skimmed supersonic beams simultaneously with laser-induced-fluorescence and photoionization spectra. To illustrate these advantages we present VUV FM spectra of Ar, Kr, and N2 in selected regions between 105 000 cm*-1* and 122 000 cm*-1*.
VUV absorption spectroscopy; frequency modulation spectroscopy
pacs:
32.30.Jc, 32.80.Ee, 33.20.Ni, 33.20.Sn, 42.60.Fc
I Introduction
Frequency-modulation (FM) spectroscopy is a very sensitive and powerful method to record atomic and molecular laser spectra in the gas phase Bjorklund (1980); Bjorklund et al. (1981); Lenth, Ortiz, and Bjorklund (1981); Gallagher et al. (1982); Tran et al. (1984); Janik, Carlisle, and Gallagher (1985); Eyler et al. (1996). Originally, the method was introduced to exploit the advantages of narrow-band lasers for spectroscopic investigations in the infrared (IR) and the visible (VIS) ranges of the electromagnetic spectrum. Eyler and coworkers later applied the method in combination with nonlinear frequency-upconversion methods to extend the wavelength range to the UV down to 214.5 nm and achieved an absorption sensitivity of in this range.Eyler et al. (1996) The high sensitivity results from the background-free nature of the detection of the absorption signals. FM spectroscopy relies on the modulation at frequency of a narrow-band laser operated at frequency , resulting in an amplitude spectrum schematically depicted in Fig. 1 for the modulation indices and 1.25 relevant for the present investigation ( defines the sideband-to-carrier ratio, see Ref. Supplee, Whittaker, and Lenth, 1994 for additional details). Maximal sensitivity is reached when the modulation frequency is larger than the intrinsic linewidth of the transitions. This property prompted Janik et al. Janik, Carlisle, and Gallagher (1985) to demodulate the signals at a frequency instead of to improve the contrast in the case of a linewidth comparable to .
In this article, we present an extension of FM spectroscopy to the vacuum-ultraviolet (VUV, ) range of the electromagnetic spectrum and explore the sensitivity of demodulation at both and . High-resolution absorption spectroscopy below 200 nm is notoriously difficult. In early high-resolution spectroscopic work in the VUV, the absorption spectra were recorded using high-pressure lamps in combination with large VUV monochromators Tanaka and Yoshino (1969); Chupka and Berkowitz (1969); Yoshino (1970); Herzberg and Jungen (1972); Berkowitz (1979), enabling resolution of about 0.5 cm*-1* between 10 eV and 20 eV. By replacing the high-pressure lamps by synchrotron radiation, spectroscopic measurements could be extended beyond 20 eV. VUV radiation from synchrotron sources, however, also needs to be monochromatized, which limits the bandwidth of the radiation to at best .Nahon et al. (2001) VUV Fourier-transform absorption spectroscopy using synchrotron radiation was recently extended to the range below 105 nm and offers the multiplex advantage, but so far the best resolution achieved with this method is .de Oliveira et al. (2009) Pulsed VUV laser systems based on four-wave mixing enable a higher resolution (better than 200 MHz, see Refs. Cromwell et al., 1989; Hinnen et al., 1998; Hollenstein, Palm, and Merkt, 2000; Trickl, Kung, and Lee, 2007), but the large pulse-to-pulse fluctuations resulting from the nonlinearity of the VUV generation process limits the sensitivity of absorption measurements. Consequently, only few VUV-laser-absorption spectra of atoms and molecules in supersonic beams have been reported.Hinnen et al. (1998); Softley et al. (1987); Trickl et al. (1989); Trickl, Kung, and Lee (2007) Supersonic beams enable one to cool the internal degrees of freedom of molecules and to reduce spectral congestion and Doppler broadening, however, at the cost of a reduced column density. To improve the low sensitivity resulting from the large pulse-to-pulse fluctuations of the VUV laser radiation, Sommavilla et al. Sommavilla et al. (2002, 2016) have used a dispersion grating and exploited the beam diffracted in the negative first order to normalize the VUV laser intensity pulse by pulse and were able to reliably measure relative changes of the transmission of , which is sufficient to record VUV absorption spectra of molecules in cold supersonic beams.
Although (1+1*′*) resonance-enhanced multiphoton-ionization (REMPI) spectroscopy can be used to record VUV spectra with high sensitivity, the line intensities may be reduced, compared to an absorption spectrum, by predissociation. Here, we present an alternative method to record VUV absorption spectra with high sensitivity that relies on FM techniques. Tunable VUV radiation is produced from the output of two Fourier-transform-limited pulsed lasers (pulse length , obtained by pulse amplification of cw single-mode ring laser radiation) by two-color resonance-enhanced four-wave mixing () in Kr or Xe. The modulation of the VUV laser frequency is achieved by generating sidebands on the output of the second laser () using an electro-optical modulator. These sidebands are automatically transferred to the VUV, because the four-wave-mixing process is linearly dependent on the intensity of the second laser.
II Experimental Setup and Procedure
The experimental setup used in this work is depicted schematically in Fig. 2 and consists of a laser system (Section II.1) and vacuum chambers where the absorption experiments are carried out on cold gaseous samples in skimmed supersonic beams. Critical components for the success of the experiment such as the (de)modulation setup and the home-built VUV photodetector are described in Sections II.2 and II.3, respectively. Section II.4 presents the different detection schemes used to characterize the VUV absorption and Section II.5 provides details of the analysis of the lineshapes.
II.1 VUV Laser System
The near-Fourier-transform-limited VUV laser source Hollenstein, Palm, and Merkt (2000); Sommavilla et al. (2002) used in the present work is depicted schematically in the upper part of Fig. 2. VUV radiation at the wave number is produced in a resonance-enhanced four-wave mixing process in atomic krypton and xenon using the two-photon resonances Kr (4p)5 5p[1/2]0 Kr (4p)6 1S0 at cm*-1* (Ref. Saloman, 2007) and Xe (5p)5 6p*′[1/2]0 Xe (5p)6 1S0 at cm-1* (Ref. Kramida et al., 2015). Fourier-transform-limited pulses at the wave numbers and are generated by pulsed amplification of the continuous-wave single-mode output of two ring dye lasers (Coherent 699-21 and 899-29, output power of about 500 mW) using dye cells pumped by the second harmonic of a pulsed, injection-seeded Nd:YAG laser (Spectra-Physics, Quanta Ray Lab 170, pulse length of about 8 ns, repetition rate 25 Hz). To generate the desired wave number , the amplified laser radiation is up-converted to using two successive -barium-borate crystals (BBO), see Ref. Hollenstein, Palm, and Merkt, 2000 for details. The beam with wave number is the pulsed-amplified fundamental output of the second ring dye laser or its second harmonic. As long as the modulation index of the fundamental output remains below 0.5, the doubled output is characterized by approximately the same modulation index as the fundamental because the sidebands are too weak to be efficiently frequency doubled. The two two-photon resonances listed above enable the generation of VUV radiation over a broad spectral range of about 60 000 cm*-1* to 135 000 cm*-1*.
The sum-frequency VUV laser radiation with wave number is separated from the fundamental laser beams and beams generated through other nonlinear processes in a vacuum monochromator. The separation is achieved with a toroidal grating, which also refocusses the VUV radiation at the exit slit of the monochromator chamber.Merkt et al. (1998) The detected VUV-laser beam intersects one or more pulsed skimmed supersonic beams of the sample gas at right angles in the absorption chambers. The VUV-laser pulses have a duration (full width at half maximum) of approximately ns and a bandwidth of approximately 300 MHz.
The absorption chambers consist of two separate differentially pumped regions. The probe-gas beams are generated by supersonic expansion using pulsed valves (Parker, General Valve, Series 9, valve orifice diameter 1 mm) operated at a stagnation pressure of about 2 bar. The opening time of the valves is typically 200 s. In the first region, referred to as photoionization chamber below, a single probe-gas beam is collimated at a distance of 2 cm from the valve orifice by a skimmer (Beam Dynamics, orifice diameter 2 mm). Photoexcitation takes place on the axis of a linear time-of-flight photoionization mass spectrometer with which photoionization spectra can be recorded after the photoions are extracted with a pulsed electric field towards a microchannel-plate (MCP) detector. With this detector, the fluorescence induced by the VUV radiation can also be monitored. In the second region, referred to as absorption chamber below, up to ten nozzles located 2.0 cm above their respective skimmers (orifice diameter 1 mm) are used.Sommavilla et al. (2016) The transmitted VUV intensity is detected using a home-built VUV photodetector (see Section II.3). The detector signals are amplified and processed using a digital oscilloscope (Teledyne LeCroy, WavePro 760Zi, 6 GHz oscilloscope), transferred to a computer, and recorded as a function of the wave number .
The fundamental wavenumber of the second ring dye laser is calibrated by recording a laser-induced fluorescence (LIF) spectrum of molecular iodine and the transmission signals through two étalons using a fraction of the cw laser output. The output of the frequency-fixed first ring dye laser () is diffracted using an accousto-optical modulator operated at 675 MHz. In the case of sum-frequency mixing in Kr, the zero-order beam is transmitted to the amplification chain whereas the frequency of the first-order sideband is locked to the “t” hyperfine component of the B (, ) X (, ) transition of molecular iodine at cm*-1* (Ref. Knöckel, Bodermann, and Tiemann, 2004) so that the wave number cm*-1* ((4p)5 5p[1/2]0 (4p)6 1S0) is located within the bandwidth of the two-photon resonance in Kr.Saloman (2007); Hollenstein et al. (2001) In the case of sum-frequency mixing in Xe, the literature value of the resonance cm*-1* ((5p)5 6p*′[1/2]0 (5p)6 1S0) is used for the calibration.Humphreys and Paul, Jr. (1970) The calibration uncertainties of the VUV wave numbers are cm-1* for experiments carried out with Kr as nonlinear gas and about 0.15 cm*-1* for those carried out with Xe, which includes the uncertainties caused by the ac Stark shift.
The probe gases (Kr: purity grade 4.0; Ar: 4.8; N2: 5.0; all from Pangas) were used without further purification.
II.2 Modulation/Demodulation Units
To exploit the advantages of modulation techniques in experiments with nanosecond laser pulses, the modulation frequency has to be chosen carefully. It has to be higher than the inverse of the duration of a single laser pulse so that there are at least a few oscillation cycles within the typical laser-pulse duration of 2 ns to 2.5 ns. The argument can also be formulated in the frequency domain: The modulation frequency should exceed the bandwidth of the unmodulated pulse. The modulation frequency also has to be low enough so that the bandwidth of the VUV detector (see Section II.3) can resolve the modulation of the laser pulse resulting from absorption. We found a modulation of about 1.4 GHz to be an optimal compromise and, therefore, used a resonantly driven electro-optical modulator (EOM).
The fixed output of the modulation source (Anapico APSIN6010) is split into two parts using a coupler (Mini Circuit ZADC-6-2G). The main output of the coupler feeds the reference arm of the demodulator used to demodulate the VUV signal, whereas the coupled output is used to drive the EOM (Qubig T1500M3-400/800). To adjust the intensity of the signal used to modulate the cw output of the second ring dye laser to a desired modulation index , a step attenuator (Narda 4748-69) is used in combination with a power amplifier (Becker AMP 20280035). The resonance frequency of the EOM is optimized by minimizing the reflected modulation intensity monitored using a circulator (RYT 300010) and a home-built diode detector and determined to be 1.3875 GHz. Small variations of the EOM resonance frequency were observed and the necessary adjustments carried out daily.
To demodulate the VUV signal, we investigated both the standard demodulation technique at (referred to as 1f demodulation below) and the demodulation technique at (2f) used by Janik et al. Janik, Carlisle, and Gallagher (1985). For 2f detection the modulation signal is amplified (TronTech P23GA) and frequency doubled (Watkins Johnson FD25HC) to drive the demodulation mixer. A small attenuator improves the impedance matching.
In the case of 1f (2f) demodulation, the VUV signal is first amplified (INA 34063) and then split using a diplexer (1f: ALRCOM FC 8312A; 2f: Microwave Circuit D9002G61) into a low- and a high-frequency component. The low-frequency component below 1.05 GHz (2.0 GHz) is used to monitor the envelope of the VUV signal and its amplitude represents the transmission signal. The high-frequency component of the VUV signal from the diplexer in the range 1.2–5.0 GHz (2.4–2.9 GHz) is demodulated at 1.3875 GHz (or 2.775 GHz) using a double balanced mixer (Watkins Johnson WJ-M1G). The demodulated signal is then amplified (Q-Bit QBH-9-131) and recorded with the digital oscilloscope. The phase shift between the VUV signal and the reference signal is adjusted using a “trombone” phase shifter (Spinner, 152254) in the reference signal path. On a strong absorption line, the position of the phase shifter for absorption (in-phase, ) and dispersion () are determined by comparison with calculated line shapes.
As illustration, Fig. 3 displays FM spectra of the (4p)5 (2P3/2) 7d[3/2]1 (4p)6 1S0 transition of Kr recorded for different lengths of the phase shifter and compares them with calculated spectra for the phases indicated in the respective panels. The lengths of the phase shifter (medium: air) needed to achieve phase shifts of for the modulation frequency 1.3875 GHz (2.775 GHz) is 21.6 cm (10.8 cm), which corresponds to the wavelength in ambient air.
II.3 VUV Detector
For the experiments presented in this article, we developed a fast vacuum photodiode following principles found in the literature.Tirsell (1982); Beck (1976); Green (1976) Fig. 4 (a) depicts a section through the 10-mm-diameter cylindrically symmetric detector. This home-built detector consists of (i) a 10-mm-diameter polished copper disk serving as photocathode,Cairns and Samson (1966) (ii) a positively biased anode consisting of a woven stainless-steel mesh with a transmittance of 84% located at a distance of 1 mm from the cathode, (iii) a coaxially tapered transmission line with a brass cone as central conductor and an aluminum ISO-KF reduction flange as an outer conductor at ground potential. At the vacuum interface, the diameter of the cathode is reduced to the dimension of the coaxial signal connector with a characteristic impedance of 50 .Meinke and Gundlach (1968) Fig. 4 (b) shows a schematic circuit diagram containing most critical components. The 20 M resistor, the 100 pF capacitor and the 10 H inductor are discrete components and filter the noise from the bias power supply. The capacitance of 32 pF results from the dielectric properties of the copper-cladded circuit board (Rodgers 3020) holding the anode mesh and is used as charge storage for the signal-induced current. The 50 resistor serves as damping element and is composed by 10 resistors of 500 soldered in parallel onto the circuit board. The temporal response is governed by circuit properties. The 0–100% rise time corresponds to the transit time of the photoelectrons (0.1 ns under typical operation conditions), which is proportional to the distance between cathode and anode and inversely proportional to the square root of the bias voltage. The signal decays exponentially with a time constant ( ps) given by the load resistance and the capacitance between cathode and anode.Jordan (1985)
Lacking an appropriate impulse source, we could not directly measure the time resolution of the detector but instead measured the reflection coefficient up to 6 GHz, which should ideally be 1.0 for all frequencies. The first deviation occurred at 5.1 GHz, where it dropped to 0.5. No resonances were detected in the vicinity of the modulation frequency () and its second harmonic (). Fig. 5 compares a time trace of the VUV-laser intensity with the laser frequency adjusted such that the lower sideband is resonant with the (4p)5 (2P3/2) 7d [3/2]1 (4p)6 1S0 transition in atomic krypton (trace (a)) and a time trace recorded without probe gas (trace (c)). The strong modulation of the VUV intensity resulting from the resonant absorption, with maxima separated by the inverse modulation frequency (0.71 ns), is clearly visible in Fig. 5(a) and illustrates the high temporal resolution of our home-built VUV detector. The corresponding power spectra obtained by Fourier transformation are depicted in Fig. 5(b) and (d), respectively. The weak residual modulation signal in trace (d) originates from étalon effects in the optical setup and absorption by the background gas in the vacuum chamber.
II.4 Signal detection
To obtain the VUV FM spectra we used the phase-sensitive detection method rather than the Fourier power spectrum of the time domain VUV-detector signal, which can be easily calculated on the oscilloscope, but is phase-insensitive. The power spectra nevertheless proved to be a useful diagnostic tool to optimize the signals. The time traces of the demodulated signals recorded at the digital oscilloscope and typically averaged over 50 laser shots were transferred to a computer and recorded as a function of the VUV wave number.
To obtain artefact-free spectra, it was necessary to remove the background contribution to the signal, as illustrated be Fig. 6, which shows FM VUV spectra of the b*′* (, ) X (, ) transition of N2 at 109 546.2 cm*-1* recorded using all probe-gas beams. The top panel corresponds to the signal obtained when the laser is triggered during the gas pulse (open circles) and before the gas pulse (background, full circles) to maintain the same gas load and thus the same background signal in both cases. The latter spectrum reveals a regular oscillation which originates from an étalon effect affecting the laser beam of frequency and also a broad contribution (not seen on the scale of the figure) from the room-temperature background N2 gas in the chamber. The étalon effect is also noticeable in the actual spectrum. The optimal way to remove the étalon effect and the background-gas contribution is by measuring the main and background signal in alternating sequences at each frequency step and taking their difference.
II.5 Modelling the lineshapes
To analyse the VUV FM spectra, we followed the approach used by Janik et al. Janik, Carlisle, and Gallagher (1985) in their measurements of the sodium D line using 2f FM spectroscopy. The signal contribution at the -th harmonic of the modulation frequency (1.3875 GHz) is
[TABLE]
where is the modulation index (0.5 in the 1f case (), 1.25 in the 2f case ()), are the Bessel functions of order , , and and are the laser and transition frequencies, respectively. In the absence of any additional broadening effect, therefore represents the line profile of an atomic or molecular transition with band center and natural linewidth .
To include the effects of the laser linewidth and Doppler broadening, the calculated line profiles are convoluted with Gaussian functions of appropriate widths. The widths of the Gaussian functions needed to accurately describe the measured line shape were found to depend on the number of pulsed valves used, which points at the fact that the propagation directions of the different supersonic beams are not exactly parallel.
III Results
III.1 Krypton
Panel (a) in Fig. 7 shows the FM spectrum (open circles) of the (4p)5 (2P3/2) 9s [3/2]1 (4p)6 1S0 transition of Kr recorded with a modulation index of and a 1f demodulation phase of 190*∘. The spectrum was obtained using only the supersonic beam in the photoionization chamber. For comparison, () REMPI spectra of the natural isotopes of Kr are depicted in panel (c) of the figure. The ion signals from the different isotopes were separated using a linear time-of-flight mass spectrometer as already demonstrated in Ref. Hollenstein, Seiler, and Merkt, 2003. The frequency-doubled output (532 nm) of the Nd:YAG laser was used in the ionization step (). These spectra were measured without FM and clearly reveal the expected blue-shift of the transition frequency with increasing mass of the isotopes (78Kr, 80Kr, 82Kr, 84Kr, 86Kr) Brandi, Hogervorst, and Ubachs (2002) and the hyperfine structure of the 83Kr isotope (). Summing the REMPI spectra of all isotopes leads to the spectrum depicted in Fig. 7(b). The central line in this spectrum, with a full width at half maximum of 0.015 cm-1* and a maximum at the position of the dominant 84Kr isotope, is slightly asymmetric because of the contributions of the other isotopes. The two weak satellite lines with full width at half maximum of 0.011 cm*-1*, primarily given by the laser linewidth and the Doppler broadening, originate exclusively from the 83Kr isotope. The thick full line in the top panel in Fig. 7 represents a simulation of the FM spectrum obtained numerically from the REMPI spectrum in panel (b) for and . The dashed line in Fig. 7(a) corresponds to a numerical simulation of the FM of the spectrum of the 84Kr isotope only. The comparison of the experimental with the two simulated spectra clearly indicates that the FM spectrum of the isotopic mixture contains information on the isotope shifts and hyperfine structure although this information is not as easy to recognize as in the REMPI spectra. The analysis of all spectra presented in Fig. 7 leads to the spectral positions listed in Table 1, which are fully consistent with the term values recommended in Ref. Saloman, 2007, and to the conclusion that the natural (Lorentzian) line profile of the transition and the Gaussian profile resulting from the laser profile and the Doppler effect have full widths at half maximum of 0.0028(10) cm*-1* and 0.0087(5) cm*-1*, respectively.
III.2 N2
The ability to simultaneously record LIF and FM spectra in the VUV is demonstrated in Fig. 8 with the example of the R(0), R(1) and R(2) lines of the b*′* () X () transition of N2. The spectra displayed in the left and right panels of the figure were measured with a modulation index of 0.5 and 1.25, respectively. In each panel, the traces correspond, from top to bottom, to the transmission spectra through the eleven supersonic beams of pure N2 gas in the photoionization and absorption chambers ((a) and (e)), the LIF spectra collected on the MCP detector located in the photoionization chamber ((b) and (f)) and the FM spectra recorded using demodulation phases of ((c) and (g)) and 0 ((d) and (h)), respectively.
At the nozzle stagnation pressure of 2 bar used in the experiments, the eleven skimmed supersonic beams absorb about 25% of the VUV radiation at the position of the strongest (R(0)) line. Under these conditions, the signal-to-noise ratio of the transmission spectrum (10) is limited by the shot-to-shot-fluctuations of the VUV-laser intensity. The lineshapes are determined by the sideband structure generated at the two different modulation indices. The sideband structure is not resolved in the transmission spectrum because of the Doppler broadening of about 1.5 GHz (FWHM) resulting from the eleven beams. Consequently, the lines recorded at have broad, flat-top lineshapes and are about three times broader than the lines recorded at , in which the weaker sidebands manifest themselves as shoulders on both sides of the lines. The sideband structures are more clearly observed in the LIF spectra because the single beam in the photoionization chamber only leads to a Doppler broadening of 1 GHz (FWHM). The signal-to-noise ratio of the LIF spectra is much higher (50), despite the low collection efficiency (0.7%) of the fluorescence imposed by the small solid-angle of the detection, because of the background-free nature of LIF.
The FM spectra are also characterized by a high signal-to-noise ratio (between 40 and 60) which represents an improvement by a factor of more than 5 over the transmission spectrum. The lineshapes correspond exactly to the lineshapes calculated using Eq. (1) for a Lorentzian linewidth (FWHM) of 0.05(1) cm*-1*, after convolution with a Gaussian line profile with FWHM of 0.14 cm*-1*. The highest signal-to-noise ratio (60) is obtained by 2f modulation in combination with a demodulation phase of . The positions of the three transitions derived from the spectra presented in Fig. 8 are listed in the upper part of Table 2.
Transmission, FM, and LIF spectra of the b () X () transition of molecular nitrogen are compared in Fig. 9(a)-(c). They were obtained using a modulation index , a demodulation phase of and all eleven supersonic beams. The lines have the characteristic shape discussed above. The signal-to-noise ratio of the transmission spectrum is only about 3 for the strongest line (R(0)) and insufficient to observe the weak P(2), Q(3), R(3) and R(4) lines. These lines, however, are clearly observed in the 2f FM spectrum, which even has a better signal-to-noise ratio (20 for R(0)) than the LIF spectrum. Fig. 9(d) is a () REMPI spectrum recorded without modulating the VUV laser frequency and using only the beam in the photoionization chamber. This spectrum has by far the best signal-to-noise ratio (300 for R(0)) and its lines are characterized by Lorentzian lineshapes with FWHM of 0.05(1) cm*-1*, corresponding to a lifetime of about ps, which we attribute to predissociation. This lifetime is shorter than the laser pulses, which explains the reduced signal-to-noise ratio of the LIF spectrum compared to that shown in Fig. 8.
All transition wave numbers of the b(12) X(0) lines are listed in the lower part of Table 2 where they are compared with the earlier results of Refs. Carroll and Collins, 1969.
III.3 Argon
Transmission, LIF and FM spectra of the (3p)5 6s*′* [1/2]1 (3p)6 1S0 transition of argon near 121 160 cm*-1* are presented in Fig. 10. They were obtained after frequency doubling the pulsed-amplified modulated output of the second ring dye laser and using only the supersonic beam in the photoionization chamber. The transition is so strong that about 20% of the VUV radiation is absorbed by a single skimmed supersonic beam and the VUV laser intensity used in the experiments ( photons/pulse in an area of 0.1 mm2) saturates the strong transitions. The transmission spectra have a signal-to-noise ratio of about 3.
Modulation at (1f) and 1.25 (2f) followed by demodulation at gives a signal-to-noise ratio of about 10. The line center is 121 161.18(15) cm*-1*, which is consistent with the value of 121 161.3135 cm*-1* recommended in Ref. Kramida et al., 2015. The observed lineshapes can be exactly reproduced using Eq. (1) and convolution with a Gaussian lineshape function with full width at half maximum of 0.25 cm*-1* assuming that the Lorentzian linewidth ( in Eq. (1)) is 0.3 cm*-1*, which is much larger than the natural linewidth of the 6s*′*[1/2]1 level because of saturation. The broad lines are also the reason why the signal-to-noise ratio of the FM spectra is only slightly higher than that of the transmission spectrum. Indeed, maximal contrast and sensitivity is reached in FM spectroscopy when the modulation frequency is larger than the linewidth of the transition (see Fig. 1).
IV Conclusions
In this article, we have presented an extension of FM spectroscopy to the VUV range of the electromagnetic spectrum. This extension enables the recording of absorption spectra in the range between 200 nm and 60 nm using table-top pulsed VUV lasers based on resonance-enhanced four-wave mixing. The attractive features of FM spectroscopy in the VUV are (i) its high sensitivity, which results from its background-free nature and the fact that the signal-to-noise ratio is not limited by shot-to-shot fluctuations of the VUV laser intensity; (ii) the sensitivity is sufficiently high that spectra of cold samples in skimmed supersonic beams can be recorded with high signal-to-noise ratio under conditions where no significant attenuation of the VUV radiation can be detected; (iii) the ease with which it can be combined with other detection methods such as LIF, photoionization mass spectrometry and () REMPI spectroscopy to characterize the photophysical processes resulting from the absorption of short-wavelength radiation, and (iv) its high resolution, which results from the intrinsically narrow bandwidth of Fourier-transform-limited pulsed VUV lasers. Its main drawback is that very broad spectral features or absorption continua cannot be detected as sensitively as sharp spectral features.
To illustrate the principles of FM spectroscopy in the VUV, we have presented absorption, LIF, and () REMPI spectra of Ar, Kr and N2 near 82.5 nm and 92 nm. Optimal sensitivity was reached for modulation frequencies between 1 GHz and 2 GHz in combination with a modulation index of 1.25, which maximizes the intensity of the first modulation sidebands, and demodulation at twice the modulation frequency (2f) and a demodulation phase of . This large modulation index can lead to a broadening of the spectral lines when the linewidths of the transitions exceed the modulation frequency. In this case, it can be more advantageous to use a modulation index of 0.5 in combination with 1f demodulation at .
Acknowledgements.
This work is supported financially by the Swiss National Science Foundation under the project No. 200020-159848/1.
The reference list from the paper itself. Each links out to its DOI / PubMed record.
- 1Bjorklund (1980) G. C. Bjorklund, Opt. Lett. 5 , 15 (1980) . · doi ↗
- 2Bjorklund et al. (1981) G. C. Bjorklund, W. Lenth, M. D. Levenson, and C. Ortiz, in Laser Spectroscopy for Sensitive Detection , Proceedings of the SPIE, Vol. 286 (1981) pp. 153–159. · doi ↗
- 3Lenth, Ortiz, and Bjorklund (1981) W. Lenth, C. Ortiz, and G. C. Bjorklund, Opt. Lett. 6 , 351 (1981).
- 4Gallagher et al. (1982) T. F. Gallagher, R. Kachru, F. Gounand, G. C. Bjorklund, and W. Lenth, Opt. Lett. 7 , 28 (1982).
- 5Tran et al. (1984) N. H. Tran, R. Kachru, P. Pillet, H. B. van Linden van den Heuvell, T. F. Gallagher, and J. P. Watjen, Appl. Opt. 23 , 1353 (1984).
- 6Janik, Carlisle, and Gallagher (1985) G. Janik, C. Carlisle, and T. F. Gallagher, Appl. Opt. 24 , 3318 (1985) . · doi ↗
- 7Eyler et al. (1996) E. E. Eyler, S. Gangopadhyay, N. Melikechi, J. C. Bloch, and R. W. Field, Opt. Lett. 21 , 225 (1996) . · doi ↗
- 8Supplee, Whittaker, and Lenth (1994) J. M. Supplee, E. A. Whittaker, and W. Lenth, Appl. Opt. 33 , 6294 (1994).