GenePT: A Simple But Effective Foundation Model for Genes and Cells Built From ChatGPT
Yiqun Chen, James Zou
TL;DR
GenePT is a new method that uses ChatGPT to create gene and cell embeddings from literature, achieving strong performance without complex training.
Contribution
GenePT introduces a simple, literature-based approach to generate gene and cell embeddings without requiring large-scale data curation or pretraining.
Findings
GenePT achieves comparable or better performance than existing models on tasks like gene property and cell type classification.
GenePT uses GPT-3.5 embeddings of gene descriptions and expression levels to generate effective single-cell embeddings.
The method is efficient and easy to use, bypassing the need for extensive data preparation.
Abstract
There has been significant recent progress in leveraging large-scale gene expression data to develop foundation models for single-cell biology. Models such as Geneformer and scGPT implicitly learn gene and cellular functions from the gene expression profiles of millions of cells, which requires extensive data curation and resource-intensive training. Here we explore a much simpler alternative by leveraging ChatGPT embeddings of genes based on literature. Our proposal, GenePT, uses NCBI text descriptions of individual genes with GPT-3.5 to generate gene embeddings. From there, GenePT generates single-cell embeddings in two ways: (i) by averaging the gene embeddings, weighted by each gene’s expression level; or (ii) by creating a sentence embedding for each cell, using gene names ordered by the expression level. Without the need for dataset curation and additional pretraining, GenePT is…
Click any figure to enlarge with its caption.
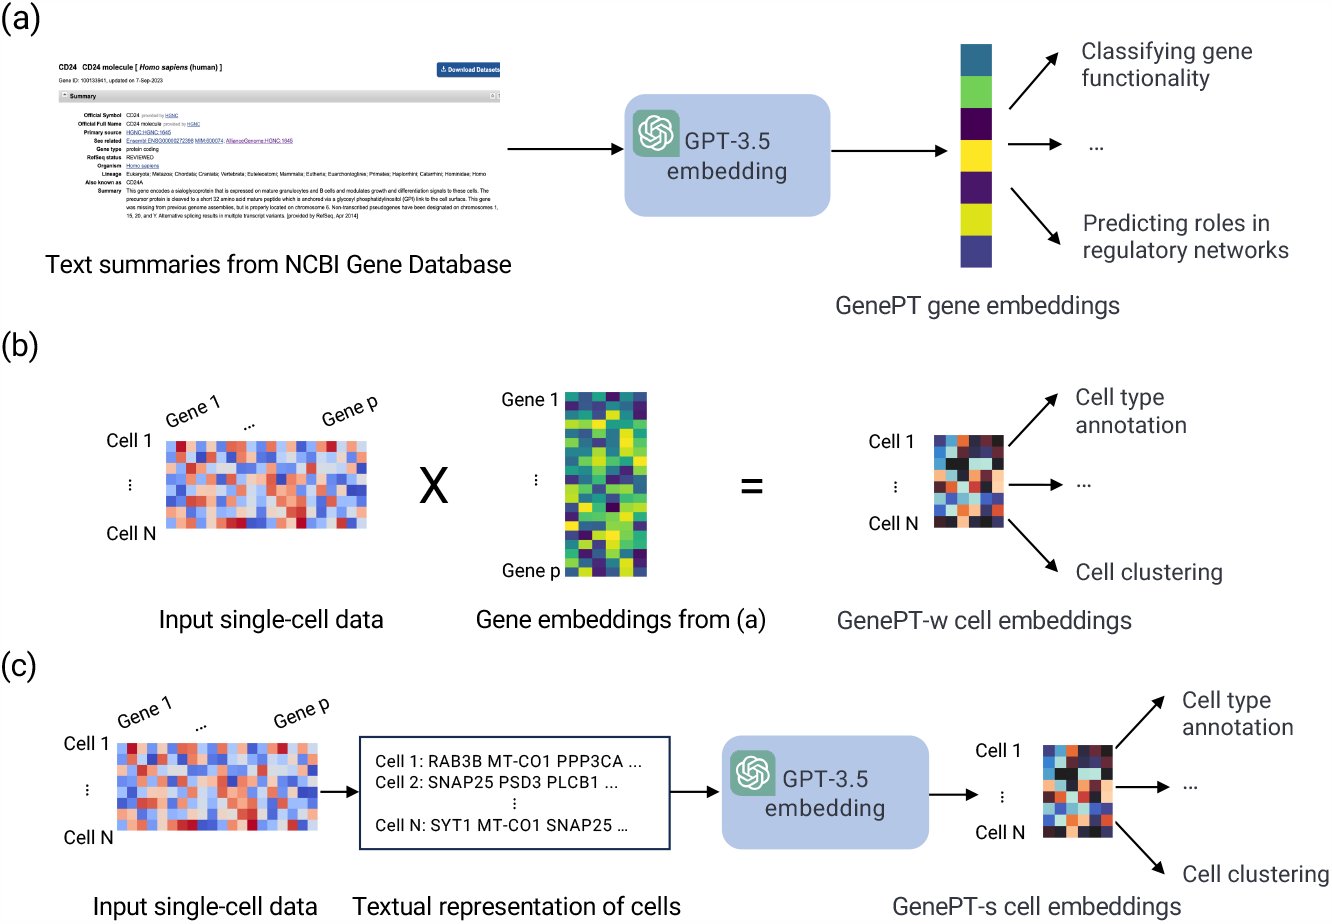 Figure 1
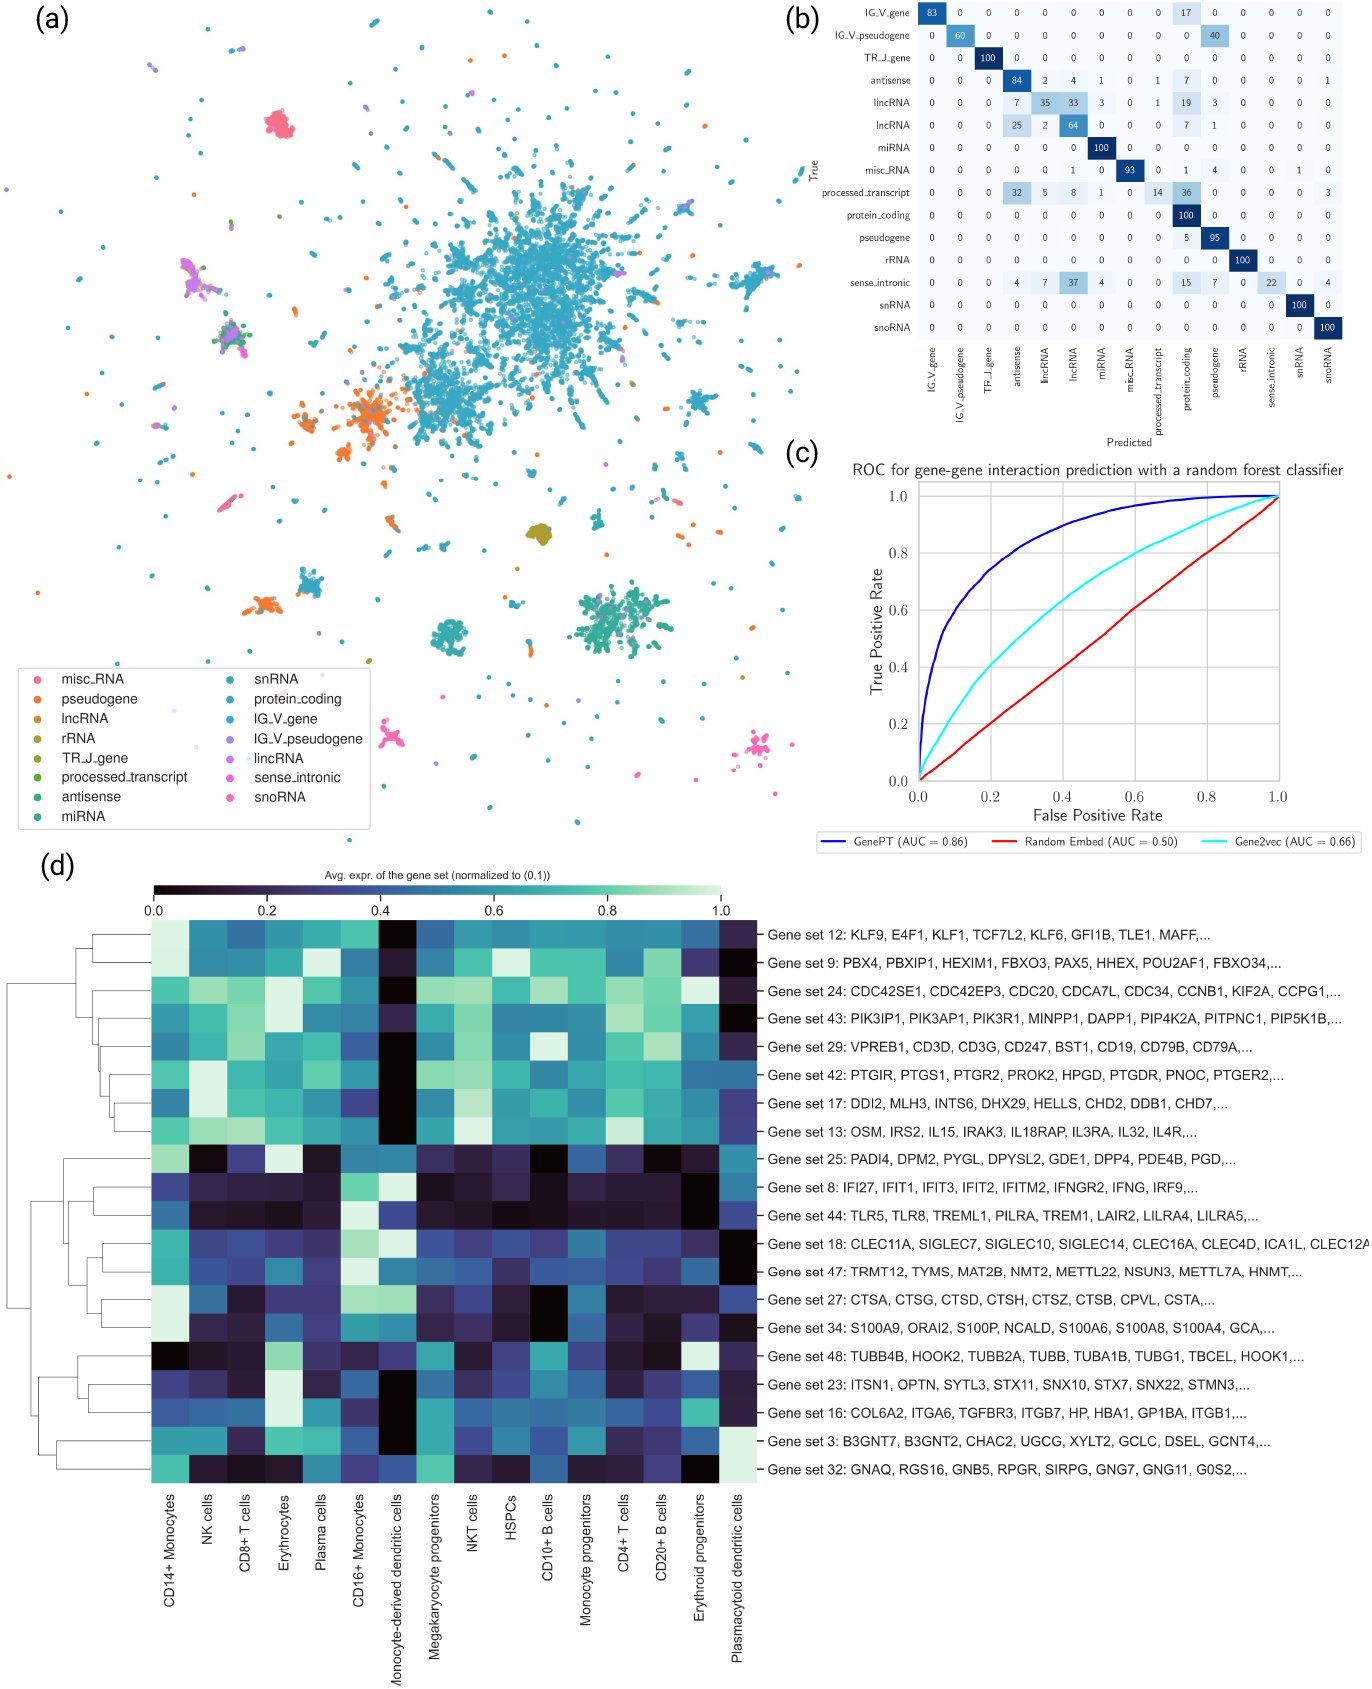 Figure 2
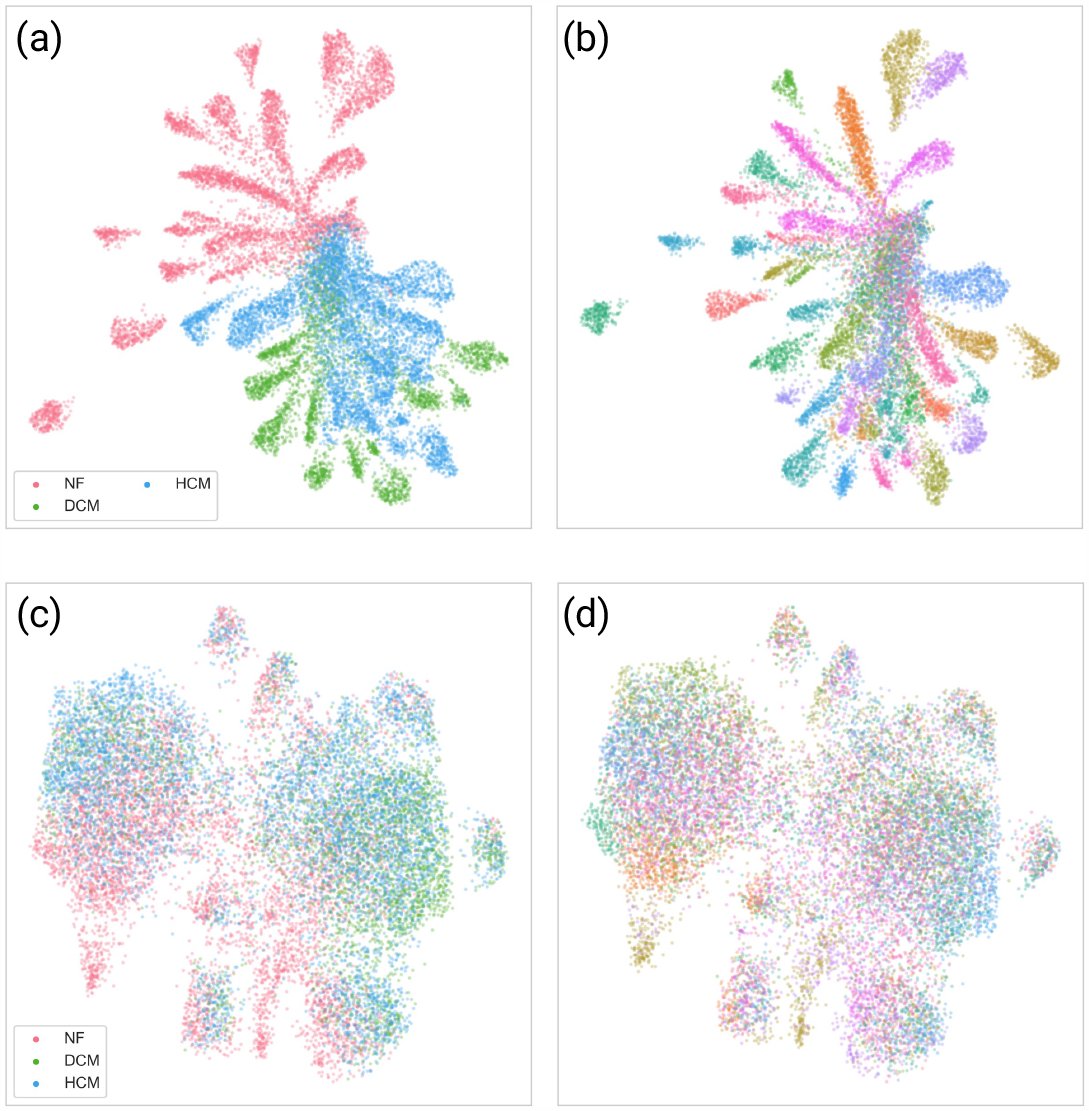 Figure 3
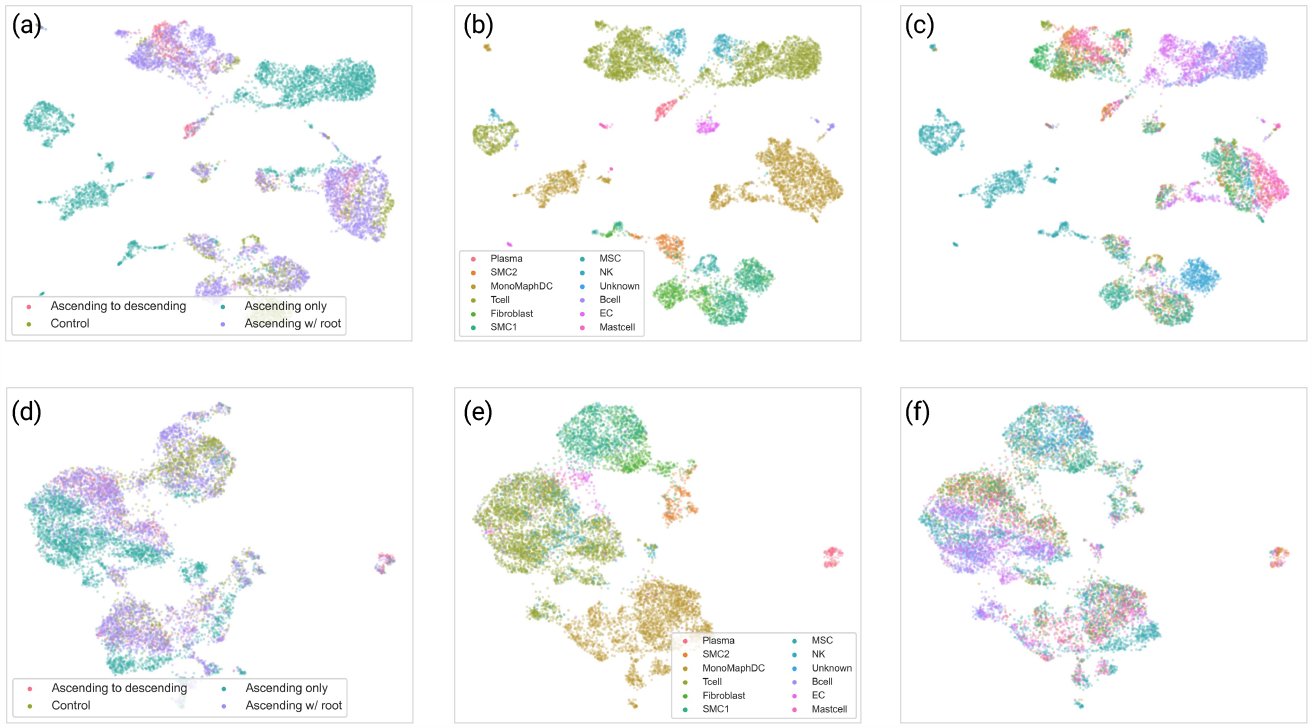 Figure 4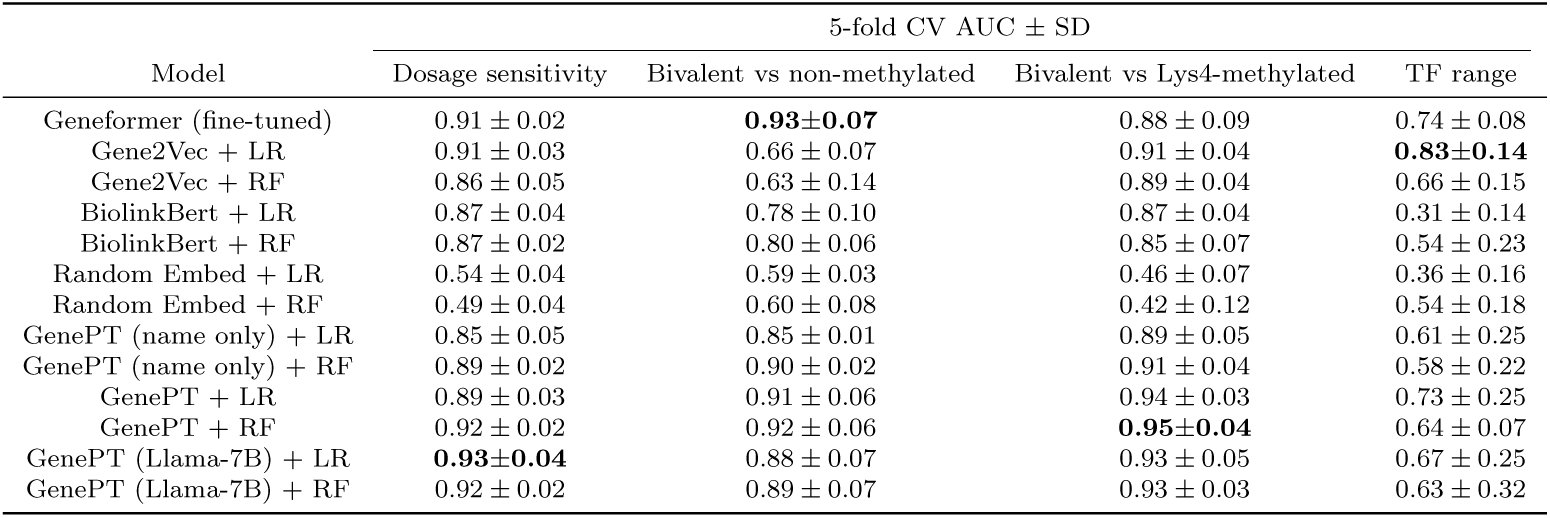


Peer Reviews
No public reviews on file for this paper yet. If you reviewed it on a platform where reviews are public (OpenReview, ICLR, NeurIPS, ICML), you can paste yours below so the community can read it here.
Videos
No videos yet. Explain this paper in a talk, walkthrough, or lecture? Add one.
Taxonomy
TopicsSingle-cell and spatial transcriptomics · Gene expression and cancer classification · Gene Regulatory Network Analysis
Introduction
Recently, the field of single-cell biology has seen a surge in interests and efforts to develop foundation models, i.e., models designed to learn embeddings of genes and cells to facilitate various downstream analyses. Several methods, such as Geneformer [1] and scGPT [2], have been recently proposed to tackle this challenge. At a conceptual level, they adopt similar recipes that consist of the following steps:
Adopt a deep learning architecture (often from the transformer family [4]). Gather extensive single-cell gene expression datasets for pre-training the model in a self-supervised manner (e.g., by imputing some masked out expression values). The trained encoder maps input genes and cells to a high-dimensional embedding vector encapsulating the underlying biology. For downstream tasks, one can optionally utilize a modest amount of task-specific data to fine-tune the model, boosting its predictive capabilities.
Notably, the approach outlined above derives embeddings only from gene expression datasets, without making any use of the literature and pre-existing knowledge about a gene. While this strategy has shown some success in applications to single-cell transcriptomics data and tasks, it has several limitations. First, the computational power and time required to collect and process large-scale single-cell transcriptomics data used for pre-training (Step 2 above) can be prohibitive, particularly when researchers desire early signal detection and rapid iterations. Furthermore, the signals from extracted embeddings are heavily dependent on the gene expression data used in Step 2, which doesn’t take advantage of the vast research and literature summarizing the functionalities of a gene, potentially leading to sample inefficiency and suboptimal results in certain applications. Therefore, in this study, we explored an alternative, complementary approach and investigated the feasibility of encoding the biology of genes and cells using natural language.
The intuition for our approach is as follows: large-language models (LLMs) such as GPT-3.5 and GPT-4 have been trained on extensive text corpus [5], including biomedical literature, and have demonstrated remarkable ability in understanding, reasoning, and even generating biomedical text [6–9]. Consequently, we hypothesize that LLM-derived embeddings of gene summaries and functionalities — which often are curated from a broad spectrum of experiments and studies — might more directly capture the underlying biology.
Our contributions
We introduced GenePT — a method that represents genes and cells by utilizing OpenAI’s ChatGPT text embedding API services [10]. We evaluated the generated embeddings on several biologically driven tasks and our findings reveal that our proposal exhibits performance comparable to, and sometime surpassing, specially designed models such as Geneformer across a diverse set of downstream tasks. GenePT offers several advantages to single-cell RNA-seq based foundation models: (i) it performs better on several biological tasks; (ii) it doesn’t require expensive single-cell curation and additional pretraining; and (iii) it’s very simple to use and to generate gene and cell embeddings. GenePT uses LLM-based embeddings which is an orthogonal source of information compared to the expression based representations; this suggests a promising new direction of combining these two ideas.
The remainder of the paper is structured as follows: Section 2 reviews pertinent literature on LLMs tailored for transcriptomics and on probing approaches in language modeling. Section 3 details our process for data collection, embedding, and analysis. Section 4 provides empirical findings that underscore the efficacy of GenePT embeddings for genes and cells. Section 5 discusses potential limitations and chart out avenues for future research.
Related Work
Foundation models for single-cell transcriptomics
Foundation models have shown unprecedented performance for a myriad of tasks including text classification, question answering, and text generation [11]. Efforts have naturally been made to adapt these models to tackle tasks in biology, especially in the field single-cell transcriptomics [1, 2, 12]. Examples for such efforts include cell type annotation, where a cell is labeled based on its biological identity [3, 13]); gene functional and regulatory network inference, where the functionality of individual genes and clustered gene groups are examined [2, 14]; and sample integration [13], which accounts for transcript abundance influenced primarily by technical replicate noise instead of underlying biology.
With the advent of large-scale, open-source expression datasets such as Gene Expression Omnibus [15] and the Human Cell Atlas [16], several models have been trained on such data. The aspiration behind these models is to craft a foundational model for single-cell transcriptomics, analogous to foundational models in natural language processing. These models are intended to display broad capabilities across an array of biological tasks rather than just a niche subset. For instance, Geneformer [1] employs extensive pretraining on the ranks of gene expression levels through masked token prediction across 30 million cells collected from a wide range of sources using a transformer architecture. It shows good performance in tasks ranging from understanding network dynamics to deciphering network hierarchy. Another noteworthy model is scGPT [2]: it hinges on generative pretraining (with gene expression prediction as the task) and used 33 million cells from the CELLxGENE collection for training [17]. Its capabilities are demonstrated through downstream evaluations in perturbation prediction, batch integration, and cell type annotation.
Using LLMs for cell biology
Beyond the large-scale models tailored for structured, non-linguistic data, recent initiatives have explored the direct manipulations of LLMs for biomedically-focused tasks. For example, Hou and Ji [18] employed ChatGPT for cell type annotation; Wysocki et al. [19] probed biomedical information on BioBERT and BioMegatron embeddings; and Ye et al. [20] utilized instruction fine-tuning to achieve competitive results on graph data task benchmarks with an LLM. While our paper is under preparation, Levine et al. [21] has independently embarked on a conceptually related approach to ours, where each cell is transformed into a sequence of gene names, ranked by expression level and truncated at top 100 genes. The emphasis of their paper, however, is on cell type annotation and generation of new cells conditional on cell types, with an emphasis on generative tasks.
Deciphering natural language embeddings
Understanding how large-scale unsupervised representations capture linguistic nuances is a central research question in Natural Language Processing (NLP). One avenue of exploration, sometimes referred to as “probes”, trains supervised models to predict downstream properties from the language model embeddings [22–24]. These techniques have achieved impressive accuracy across NLP tasks, suggesting that the embeddings exhibit a substantial amount of understanding of input attributes.
The success of probing and foundational models in biology inspire our primary research questions (RQs):
RQ1: Do natural language embeddings of genes capture the intrinsic biological functionalities of a gene?
RQ2: Do natural language embeddings of cells capture the underlying biology of a cell?
In addressing these RQs, our study makes the following contribution to the literature: we show that natural language embeddings of gene functions — such as summaries readily available from sources like the NCBI gene database [25] — successfully encapsulate the underlying biological relationships and insights associated with genes, when assessed on biologically relevant tasks. Moreover, for single cells, language models embeddings of the gene names, ordered by expression levels, encode substantial biological signals that can be used, e.g., for cell type annotation.
Methods
3
Data Collection and Transformation
3.1
To obtain embeddings for genes most pertinent to single-cell transcriptmotics studies, we began with unifying of the list of gene vocabularies utilized in Geneformer [1] and scGPT [2]. The selection of these genes was informed by their expression levels across the pretraining datasets, with detailed methodologies for gene vocabulary construction available in the cited works. In Geneformer cases, the genes were represented as Ensembl IDs rather than gene names, and we used the mygene package [26] for conversion, retaining in successful look up of more than 90% of the Ensembl IDs. Additionally, we incorporated genes detected in our downstream application datasets, totaling around 33,000 genes. For each gene, we extracted its information from the NCBI gene database’s summary section (see an examples in Appendix A), and removed hyperlinks and dates. Averaging 73 words (interquartile range: 25–116), the parsed gene summaries were then processed through GPT-3.5 (text-embedding-ada-002 embedding model), resulting in embeddings of 1,536 dimensions, which served as gene representations (see Figure 1). On the rare occasion that an NCBI gene page was unavailable (< 5% of our final gene embeddings), we turned to GPT-3.5 with the prompt: “Provide a brief overview of the functionality of gene gene name”. In addition to embedding the gene summaries using GPT-3.5, we conducted comparisons with alternative embedding methods, such as (i) embedding the text using the open-source biomedical language model BioLinkBert [27]; and (ii) Gene2vec [28] derived from gene expression data.
An overview of the GenePT framework. (a) For each gene, we source its corresponding functional summary from NCBI and use GPT-3.5 text embedding as its representation. (b) In GenePT-w cell embeddings framework, we use the average of the gene embeddings obtained from step (a), each weighted by its respective normalized expression level in that cell. (c) In GenePT-s cell embeddings framework, each cell from the input single-cell data is translated into natural language sentence based on ranked gene expressions, and the GPT-3.5 embedding of the entire sentence is used to represent the cell.
To encode information at the cellular level, we developed two distinct approaches: GenePT-w (w for weighted) and GenePT-s (s for sentence). In both approaches, we first normalize and transform the scRNA-seq data as implemented in the scanpy package as follows: firstly, we row-normalize the count matrix so that each cell has 10,000 observed RNA transcripts, followed by a log(1 + x) transformation of each matrix entry. To get the GenePT-w embedding, as its name suggests, we represent the cell under consideration by taking the average of the gene embeddings, weighted by the corresponding normalized expression levels, which can be efficiently implemented using matrix multiplication (see Figure 1(b)). Alternatively, instead of pooling the gene embeddings via an explicitly weighted average, we can represent cells in natural language by creating a sequence of gene names as an analog to sentences, ordered by the descending normalized expression level, with genes with zero counts omitted. We can then pass this sentence representation for each cell to GPT-3.5 to obtain GenePT-s embeddings (see Figure 1(c)).
Downstream gene-level and cell-level applications
3.2
Geneformer and scGPT demonstrate the biological value offered by their foundation models using several downstream gene-level and cell-level tasks. In this paper, we evaluated the performance of GenePT on the same downstream applications wherever possible to compare GenePT with Geneformer and other single-cell foundation models. In particular, for gene-level tasks, we primarily contrast our results with those from Geneformer and Gene2vec. This is because their results on the same datasets have been previously documented without the need to re-train or fine-tune. By constrast, we exclude comparisons to scGPT for gene-level tasks, as there isn’t a readily available gene-level classification model built on scGPT, necessitating extensive training and fine-tuning. Regarding cell-level tasks, we leveraged pre-trained embeddings from all the foundational models.
Gene-level Tasks:
Gene Functionality Class Prediction: This is a multi-class prediction challenge based on the 15 most common functional gene classes. Labels for these classes were curated as part of the Geneformer paper. Gene Property Prediction Task: This involves four binary classification tasks using open-source data provided in Theodoris et al. [1]: Distinguishing previously identified dosage-sensitive from dosage-insensitive transcription factors. Differentiating between bivalent and non-methylated genes. Differentiating between Lys4-only-methylated and non-methylated genes. Distinguishing long-range from short-range transcription factors (TFs). Gene-Gene Interaction Datasets: We utilized a benchmark for gene-gene interaction based on shared gene ontology annotations published by Du et al. [28]. The training and test datasets include over 200,000 pairs of examples in the tuple (gene 1, gene 2, label), where the binary label indicates whether a pair of genes is known to interact. Unsupervised Exploration of Gene Programs: To examine the interaction between genes, we constructed a similarity network of gene-gene interactions using GenePT embeddings from a dataset of human immune tissues [29]. Our validation process follows that of Cui et al. [2] and consists of the following steps: 1. constructing gene networks based on the cosine similarities among the highly variable genes; 2. applying unsupervised Louvain clustering [30] to derive gene programs; and 3. qualitatively comparing the trends of highlighted gene programs with their cell-specific expression levels.
Cell-level tasks:
Assessing Association Between Embeddings and Underlying Cell States: Here, we considered the following test datasets re-processed and used to demonstrate the use of scGPT and Geneformer — Myeloid [31] (containing 3 annotated cancer types and 11 cell types across 13,468 cells), Multiple Sclerosis [32] (containing 18 annotated cell types and 12 donors across 3,430 cells), hPancreas [29] (containing 11 annotated cell types across 4,218 cells), and Aorta (a random 20% susbet of data originally published in Li et al. [33] and comprise 11 cell types across 9,625 cells). For each dataset and its associated metadata annotation, we applied k-means clustering on the pretrained GenePT, Geneformer, or the scGPT embeddings to obtain clusters matching the classes in the metadata annotations. We select the number of cluster k to match the number of classes in the metadata annotation. We then computed the Adjusted Rand Index (ARI) and Adjusted Mutual Information (AMI) to evaluate the concordance between derived cluster labels and the true metadata labels. A higher alignment, indicated by higher values of ARI or AMI, between the inferred and actual labels suggests that the embedding captures more biological structure and signals. Context awareness and batch integration: Pretrained single-cell foundation models have been demonstrated to be robust against common batch-dependent technical artefacts while still encoding the underlying biological context. We assessed whether GenePT-s embeddings were impacted by common batch effect such as patient variability on two datasets used in Theodoris et al. [1]: the cardiomyocyte dataset originally published by Chaffin et al. [34], and the Aorta dataset originally published in Li et al. [33].
Results
4
GenePT embeddings capture underlying gene functionality
4.1
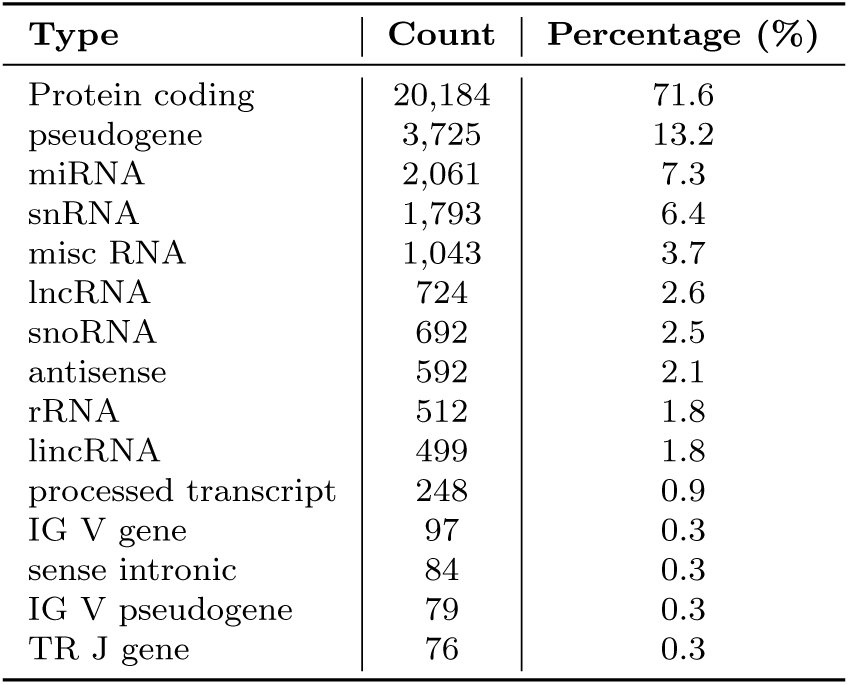
In Figure 2(a), we display a 2D UMAP of the GenePT embeddings (using the text-embedding-ada-002 model), for over 34,000 genes that belong to the top 15 most prevalent functional classes (see the detailed class breakdown in Table 3 in Appendix B). The UMAP reveals distinct clusters when colored by various gene functionality groups, implying that the language model embeddings are able to capture the inherent functions of the genes. We further divided the genes into a 70%/30% train/test split and evaluated the prediction accuracy of using an l2 regularized logistic regression on the 15 classes. The predicted functional class aligns with the true annotation well, with an overall accuracy of 96% and commendable class-specific accuracies. with only minor misclassifications between closely related functional groups like lincRNA, lncRNA, and processed transcripts (see Figure 2(b)).
GenePT embeddings encode underlying biology. (a) 2D UMAP visualization of GenePT embeddings, colored by different gene functionality groups. (b) Confusion matrix of gene function prediction utilizing GenePT embeddings, combined with an l2-regularized logistic regression on a randomly held-out 30% test set. (c) Prediction accuracy on a gene-gene interaction benchmark dataset derived from GEO expression data [28] (d) Cell-type specific activation among GenePT-embeddings-extracted gene programs (a random subset of genes is displayed for each program) in a human immune tissue dataset [29]. The patterns of average gene expressions for identified gene programs in different cells types are congruent with those previously identified in Cui et al. [2].
We further assessed the efficacy of GenePT embeddings in predicting gene-gene interactions (GGI) in Figure 2(c). We compared the ROC-AUC for three methods on the test GGI dataset provided in Du et al. [28]: (i) sum of the GenePT embedding of two genes with a random forest (RF) classifier (yielding an AUC of 0.84); (ii) sum of the Gene2Vec embeddings with an RF classifier (resulting in an AUC of 0.67); and (iii) sum of two random embeddings (d = 1, 536, same as GenePT) with entries drawn from independent N (0, 1) paired with an RF classifier, which served as a negative control (an AUC of 0.51). As shown in Figure 2(c), GenePT embeddings considerably enhance performance when compared to the Gene2Vec embeddings under the same downstream classifier. Even when leveraging a more intricate deep neural network, Du et al. [28] reported an AUC of 0.77, underscoring the competitive edge of GenePT in this task.
Next, we delved into cell-type specific activations among the GenePT-derived gene programs within human immune tissue datasets through a “zero-shot” approach. We first constructed similarity graph based on cosine similarities between the GenePT embeddings by placing an edge between two genes if the cosine similarity is larger than 0.9 and applied Leiden clustering to the resulting graph at a resolution of 20. Randomly-sampled 20 gene programs comprising 10 or more genes are depicted in Figure 2(d). Here, we display the average expression levels of these gene programs, stratified by cell types. The observed selective activation of these programs aligns with established biological knowledge where the identified gene sets are known to be functionally distinct and are differentially expressed across different cell types (e.g., Gene set 8 comprising of IFI families and gene set 24 comprising of CDC families). These findings underscore that GenePT-inferred gene programs effectively capture biologically pertinent functional groups.
GenePT embeddings enable accurate predictions in chromatin dynamics and dosage sensitivity
4.2
In this section, we delve into specific biological tasks that predict the roles of genes in network dynamics with datasets curated from the literature by Theodoris et al. [1]: dosage-sensitive versus dosage-insensitive TFs, bivalent versus non-methylated genes, Lys4-only-methylated versus non-methylated genes, and long-versus short-range TFs. These tasks were used to demonstrate the utility of Geneformer. We assess the performance of GenePT and Gene2vec embeddings by five-fold cross-validated ROC-AUC with either an l2 penalized logistic regression (LR) or a Random Forest (RF) classifier using default parameters from sklearn [35]. By contrast, Geneformer results, as reported in Theodoris et al. [1], are based on a fine-tuned transformer model. We also reported some variants of the GenePT framework: BioLinkBert embedding of the gene summaries; or GPT-3.5 embedding of only the gene names (without context or descriptions); and random embeddings matching the GenePT dimension (d = 1, 536).
Table 1 illustrates that GenePT embeddings consistently achieve competitive results, sometimes even surpassing Geneformer, despite the fact that the latter benefits from a substantial pre-training dataset and a more intricate expressive classification head. Intriguingly, GPT-3.5 embeddings of only gene names also show high accuracies in some tasks, suggesting that the underlying language model and tokenizer for GPT-3.5 might grasp the biological significance of these gene symbols. Open-source embeddings like BioLinkBert and Gene2vec have slightly less competitive performance; and, as expected, random embeddings exhibit results akin to noise or blind guessing. The stark contrast between GenePT and random embeddings indicates that it’s unlikely that the GenePT performance is simply due to a large embedding dimension (d = 1536) or the use of particularly expressive models (in our case, a simple LR or RF). In summary, these results underscore the potential of our versatile GenePT approach, which compares favorably with state-of-the-art deep learning models specifically crafted for single-cell RNA sequencing data.
Table 1:: Cross-validated AUC for GenePT predictions versus alternative embeddings for downstream task of distinguishing (i) dosage-sensitive vs. insensitive transcription factors; (ii) bivalent versus non-methylated gene; (iii) bivalent versus Lys4-only methylated genes; and (iv) long-range versus short-range transcription factors (TFs). The performance for Geneformer is taken from Theodoris et al. [1] and is based on a fine-tuned sequence classification model. Here, random embed denotes an embedding identical in size to GenePT with entries drawn from i.i.d. 𝒩 (0,1). This serves as a “negative control” to ensure that signals in GenePT are not merely due to a larger embedding dimension. We use RF and LR to denote random forest and logistic regression models with default parameters in sklearn, respectively.
GenePT learns representations that reflect known biology on a cell level
4.3
In this section, we focus on determining the capacity of our cell embedding approaches, as depicted in Figure 1(b)–(c), in capturing the biology underpinning selected single-cell datasets. We sought to evaluate whether the GenePT embeddings are congruent with metadata annotations across the four datasets — hPancreas, Myeloid, Multiple Sclerosis, and Aorta (detailed annotations are in Section 3; see additional pre-processing steps for the first three datasets in Cui et al. [2]).
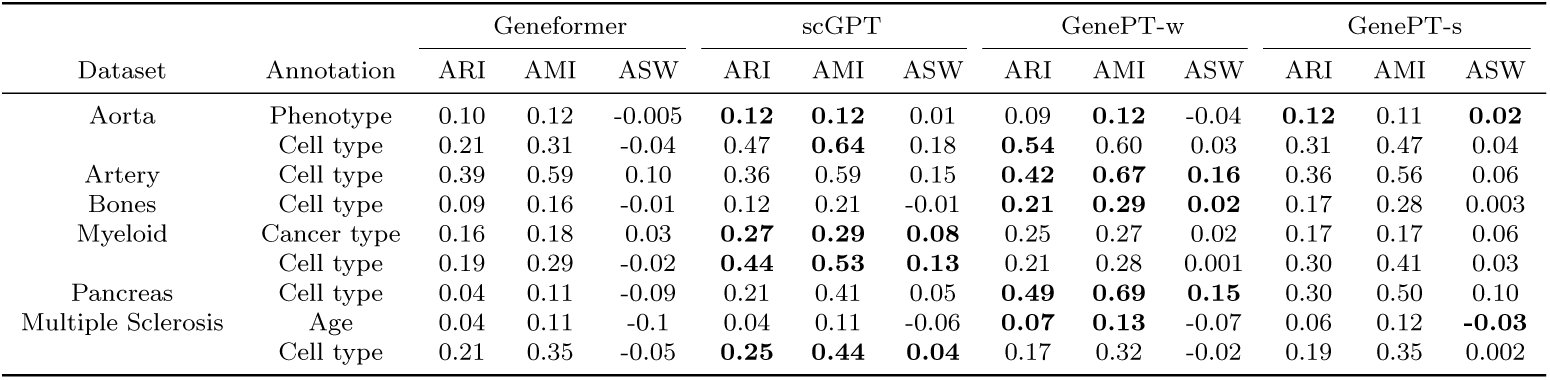
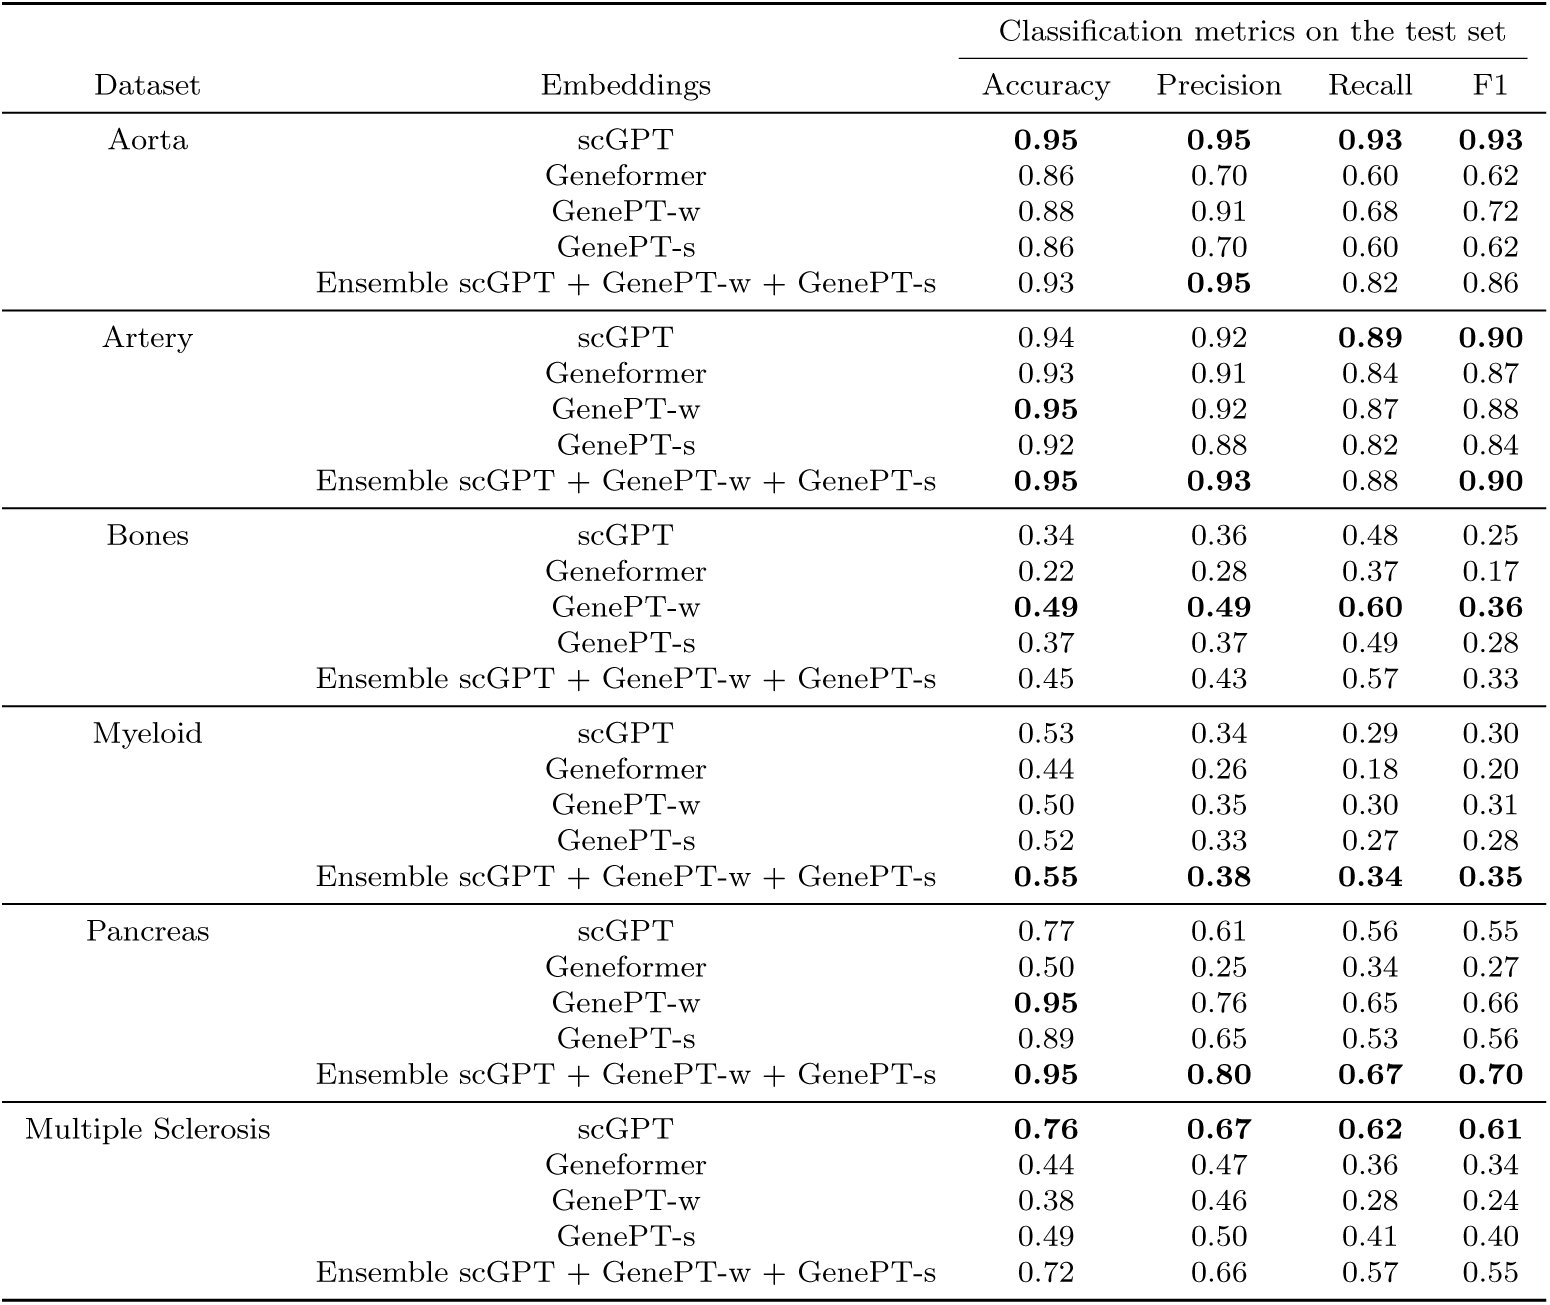
We quantified the concordance between biological annotations (i.e., cell types, cancer types, donor ages) and k-means clustering labels inferred from: (i) pretrained Geneformer embeddings; (ii) pretrained scGPT embeddings; (iii) GenePT-w embeddings (as in Figure 1(b)); and (iv) GenePT-s embeddings (as in Figure 1(c)). We quantified the concordance using both AMI and ARI in Table 2. We see that latent representations via GenePT-s broadly outperformed both the GenePT-w and Geneformer embeddings in terms of AMI and ARI metrics and stays competitive with the scGPT embeddings (metrics for the scGPT embeddings in the Aorta dataset are not available because scGPT returned a code execution error): across six tasks, scGPT and GenePT-s each provide the most biological signal on three task subsets. This demonstrates that GenePT cell embeddings capture biological variations comparable to two leading single-cell foundation models. An important caveat is that concordance with cell types and annotations is a limited measure of the utility of embedding, though it is widely used. Interestingly, we observe that the conceptually straightforward GenePT-w approach does not perform optimally on these datasets, indicating that cell representation may necessitate a more nuanced pooling strategy than the current expression-weighted approach illustrated in Figure 1(b). We also included additional results for a cell type annotation task via a nearest neighbor approach on these datasets in Appendix C. Similar to the findings in Table 2, GenePT-s and GenePT-w consistently outperform Geneformer in term of prediction accuracy and produce results comparable to pretrained scGPT embeddings. Interestingly, a simple ensembling of the nearest neighbors retrieved by different embeddings (GenePT-w, GenePT-s, and scGPT) enhanced the predictive performance. This suggests that natural language embeddings, such as GenePT-s, could provide complementary insights to existing expression-derived foundation models like scGPT in single-cell biology tasks.
Table 2:: Assessing the association between different latent sample representations and biological annotations. Pretrained Geneformer and scGPT embeddings are used in this task. Adjusted Rand index (ARI) and adjusted mutual information (AMI) were computed between k-means clustering derived labels and true annotations of original samples.
GenePT embedding removes batch effect while preserving underlying biology
4.4
In this section, we assess whether GenePT embeddings are robust to batch-dependent technical artefacts such as patient variability. We compared the performance of GenePT with pretrained Geneformer and scGPT using a 10% random sample from a cardiomyocyte dataset by Chaffin et al. [34] and a 20% random sample from the Aorta dataset consisting of cells in healthy and dilated aortas [33], both of which were used to demonstrate the utility of Geneformer.
In the cardiomyocyte dataset, the scientific question was to distinguish cardiomyocytes in non-failing hearts from those in hypertrophic or dilated cardiomyopathy samples. Notably, the original data exhibited significant patient batch effects (see Figure 3(b) in the Appendix). We performed the following analysis to quantify the patient-level batch effects: (i) we first project the data (either the original RNA-seq or one of the pretrained embeddings) into the top 50 principal components; (ii) we then applied k-means clustering with k = 42, which is the number of distinct patients; (iii) we compute adjusted Rand index (ARI) between the cell clusters and patient clusters. Higher ARI values indicate more patient-level batch effects. The original scRNA-seq data has high ARI of 0.33, suggesting strong batch effects. Using the GenePT-s, Geneformer and scGPT, the ARI dropped to 0.07, 0.01 and 0.01 respectively, showing that these embeddings are robust to batch effects.
(a) UMAP visualization of single-cell data, colored by disease phenotype where NF, HCM, and DCM stand for non-failing heart, hearts with hypertrophic cardiomyopathy, and hearts with dilated cardiomyopathy, respectively. (b) Same as (a), but colored by patient id. (c) UMAP visualization of GenePT-s embeddings of the same set of cells as (a), colored by disease phenotype. (d) Same as (c), but colored by patient id.
In addition to reducing batch effects, we also investigated whether these embeddings could preserve the underlying disease phenotype (i.e., non-failing versus cardiomyopathy) of the patients from whom the cells were collected. To this end, we randomly split the cardiomyocytes into a 80%/20% train/test sets and evaluated the predictive performance using the l2-regularized logistic regression on top of the following pre-trained embeddings: (i) GenePT-s, (ii) scGPT, and (iii) Geneformer. Overall, GenePT-s and scGPT achieve nearly identical performance on the held-out test set (88% accuracy, 88% precision, and 88% recall for both embeddings for predicting disease label), whereas the performance for pretrained Geneformer trailed behind (71% accuracy, 72% precision, and 71% recall).
Next, we conducted a similar study with the Aorta dataset, collected over 11 patients (eight patients with Ascending thoracic aortic aneurysm (ATAA) and three control subjects; the eight ATAA patients are further divided into three different phenotypes: ascending only, ascending with descending thoracic aortic aneurysm, and ascending with root aneurysm). We demonstrate the use of GenePT on a random 20% sample of the original Aorta dataset. In Figure 4 (see Appendix D), we display the original data (top panel) and GenePT-s embeddings (bottom panel) using UMAP, colored by patient phenotype (left panel), annotated cell types (middle panel), and patient identity (right panel). While the original data was highly influenced by patient batch effect (see Figure 4(c)) and displayed distinct clusters for identical cell types (e.g., T cells and Mono/Maph/Dend cells in Figure 4(b)), GenePT-s embeddings clustered primarily by cell types (Figure 4(e)) as well as disease phenotype (Figure 4(d)). In particular, GenePT-s embeddings were able to distinguish the phenotype of ascending only aortic aneurysm (green points in Figure 4(d)), a different phenotype than aortic aneurysm that includes the root (purple points in Figure 4(d)).
(a) UMAP visualization of the subsampled Aorta dataset, colored by disease phenotype (three different disease phenotypes: ascending only, ascending with descending thoracic aortic aneurysm, and ascending with root aneurysm; one control phenotype comprising patients with healthy hearts after transplant) provided in the original study [33]. (b) Same as (a), but colored by cell types annotated by the original study [33]. (c) Same as (a), but colored by patient id. (d) UMAP visualization of GenePT-s embeddings of the same set of cells as (a), colored by disease phenotype. (e) Same as (d), but colored by cell types. (f) Same as (d), but colored by patient id.
We repeated the clustering analysis above on the Aorta dataset to get a more quantitative measure of patient-level batch effects: The Adjusted Rand Index (ARI) between patient labels and the estimated k-means clusters (k = 11) on the original scRNA-seq data is 0.24 versus 0.11 and 0.10 when using Geneformer and GenePT-s, respectively. We also evaluated the agreement between the phenotype labels (three ATAA subtypes and one control) and the clusters derived from embeddings and original scRNA-seq data. The resulting ARIs are 0.12, 0.11, and 0.12 for Geneformer embeddings, GenePT-s embeddings, and scRNA-seq data, respectively. These findings suggest that both GenePT-s and Geneformer embeddings exhibit robustness against batch effects while preserving information of the disease phenotype. This is further corroborated by training a logistic regression model to predict the phenotype. GenePT-s and Geneformer yield accuracies of 73% (68% precision, 74% recall) and 69% (68% precision, 69% recall), respectively. scGPT gave errors on the Aorta dataset and could not be included in this analysis.
Discussion
5
With the advance of technologies to measure genetic and cellular functionalities, enhancing our understanding of the underlying biology through latent embedding representations has attracted much interest. In this work, we introduced GenePT, a simple yet effective approach that leverages GPT-3.5 to represent genes and cells by utilizing their text summaries and ranked expression values, respectively. Remarkably, across various contexts, including discerning gene functionality groups and predicting gene-gene interactions, this straightforward approach has proven to be quite effective even compared to state-of-the-art foundational models trained on large-scale single-cell transcriptomic data. Our work underscores the potential of complementing those specially crafted foundational models with a simple, natural language-guided representation, which could be substantially more resource and time-efficient. Combining LLM embeddings with expression-derived embeddings is an interesting direction of future work.
Limitations
It is important to note the limitations in our work, primarily due to the fact that the current GenePT framework only makes use of available gene summaries and descriptions. This may may overlook the intricacies of lesser-known functionalities not documented in databases like NCBI. Furthermore, unlike the embeddings trained on expression data, GenePT embeddings might not be optimal for specific tissues and cell types. This might pose challenges in capturing the dynamic and context-dependent roles of genes and cells within those settings. Lastly, the effectiveness of the embeddings is inherently constrained by the language models employed, i.e., GPT-3.5. Fine-tuning the language models could further enhance understanding of the domain-specific language prevalent in genomics.
Future work
Several promising pathways lie ahead for future research. First, extending the current GenePT approach to be more dynamic and context-dependent — such as via fine-tuning on GPT-3.5 or other open-source LLMs — could enhance its utility in real-world applications. Moreover, it’s natural to investigate the performance of GenePT in additional downstream tasks, such as perturbation predictions and drug-gene interactions. Lastly, while this paper primarily focuses on gene and cell embeddings, it would be of great interest to explore whether the approach of leveraging the natural language descriptions with LLMs embedding could be applicable to other biological domains and challenges, such as protein sequence modeling [36] and Genome-Wide Association Studies [37].
The reference list from the paper itself. Each links out to its DOI / PubMed record.
- 1Christina V Theodoris, Ling Xiao, Anant Chopra, Mark D Chaffin, Zeina R Al Sayed, Matthew C Hill, Helene Mantineo, Elizabeth M Brydon, Zexian Zeng, X Shirley Liu, and Patrick T Ellinor. Transfer learning enables predictions in network biology. Nature, 618(7965):616–624, June 2023.
- 2Haotian Cui, Chloe Wang, Hassaan Maan, and Bo Wang. sc GPT: Towards building a foundation model for Single-Cell multi-omics using generative AI. May 2023.
- 3Fan Yang, Wenchuan Wang, Fang Wang, Yuan Fang, Duyu Tang, Junzhou Huang, Hui Lu, and Jianhua Yao. sc BERT as a large-scale pretrained deep language model for cell type annotation of single-cell RNA-seq data. Nature Machine Intelligence, 4(10):852–866, September 2022.
- 4Ashish Vaswani, Noam Shazeer, Niki Parmar, Jakob Uszkoreit, Llion Jones, Aidan N Gomez, Łukasz Kaiser, and Illia Polosukhin. Attention is all you need. In Proceedings of the 31st International Conference on Neural Information Processing Systems, NIPS’17, pages 6000–6010, Red Hook, NY, USA, December 2017. Curran Associates Inc.
- 5Open AI. GPT-4 technical report. March 2023.
- 6Qijie Chen, Haotong Sun, Haoyang Liu, Yinghui Jiang, Ting Ran, Xurui Jin, Xianglu Xiao, Zhimin Lin, Zhangming Niu, and Hongming Chen. A comprehensive benchmark study on biomedical text generation and mining with Chat GPT. April 2023.
- 7Som S Biswas. Role of chat GPT in public health. Annals of biomedical engineering, 51(5):868–869, May 2023.
- 8John W Ayers, Adam Poliak, Mark Dredze, Eric C Leas, Zechariah Zhu, Jessica B Kelley, Dennis J Faix, Aaron M Goodman, Christopher A Longhurst, Michael Hogarth, and Davey M Smith. Comparing physician and artificial intelligence chatbot responses to patient questions posted to a public social media forum. JAMA internal medicine, 183(6):589–596, June 2023.