The effectiveness and perceived burden of nonpharmaceutical interventions against COVID-19 transmission: a modelling study with 41 countries
Jan M. Brauner, Sören Mindermann, Mrinank Sharma, Anna B. Stephenson, Tomáš Gavenčiak, David Johnston, John Salvatier, Gavin Leech, Tamay Besiroglu, George Altman, Hong Ge, Vladimir Mikulik, Meghan Hartwick, Yee Whye Teh, Leonid Chindelevitch, Yarin Gal, Jan Kulveit

TL;DR
This study evaluates how effective and burdensome various nonpharmaceutical interventions were in reducing COVID-19 spread across 41 countries.
Contribution
The study introduces a novel Bayesian model to assess individual NPI effectiveness and combines it with population burden data.
Findings
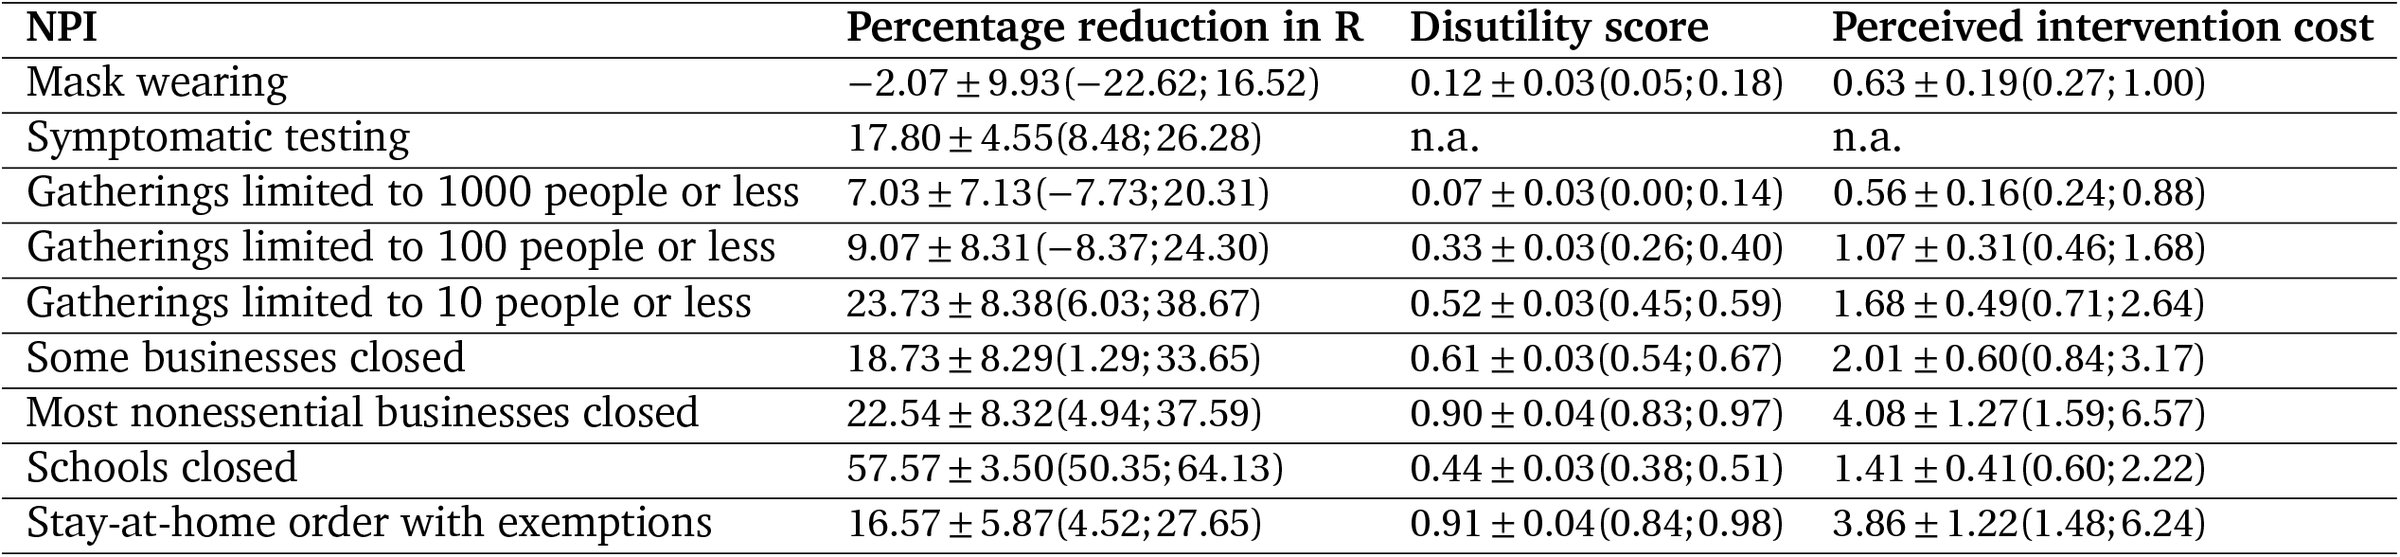
Closing schools had the highest mean reduction in R (58%) among effective NPIs.
Six NPIs showed over 97.5% posterior probability of effectiveness.
Stay-at-home orders and closing nonessential businesses had high burden with limited additional effect.
Abstract
Existing analyses of nonpharmaceutical interventions (NPIs) against COVID-19 transmission have focussed on the joint effectiveness of large-scale NPIs. With increasing data, we can move beyond estimating aggregate effects, to understanding the effects of individual interventions. In addition to effectiveness, policy decisions ought to reflect the burden different NPIs put on the population. To our knowledge, this is the largest data-driven study of NPI effectiveness to date. We collected chronological data on 9 NPIs in 41 countries between January and April 2020, using extensive fact-checking to ensure high data quality. We infer NPI effectiveness with a novel semi-mechanistic Bayesian hierarchical model, modelling both confirmed cases and deaths to increase the signal from which NPI effects can be inferred. Finally, we study the burden imposed by different NPIs with an online survey…
Genes, proteins, chemicals, diseases, species, mutations and cell lines named across the full text — each resolved to its canonical identifier and authoritative record.
Click any figure to enlarge with its caption.
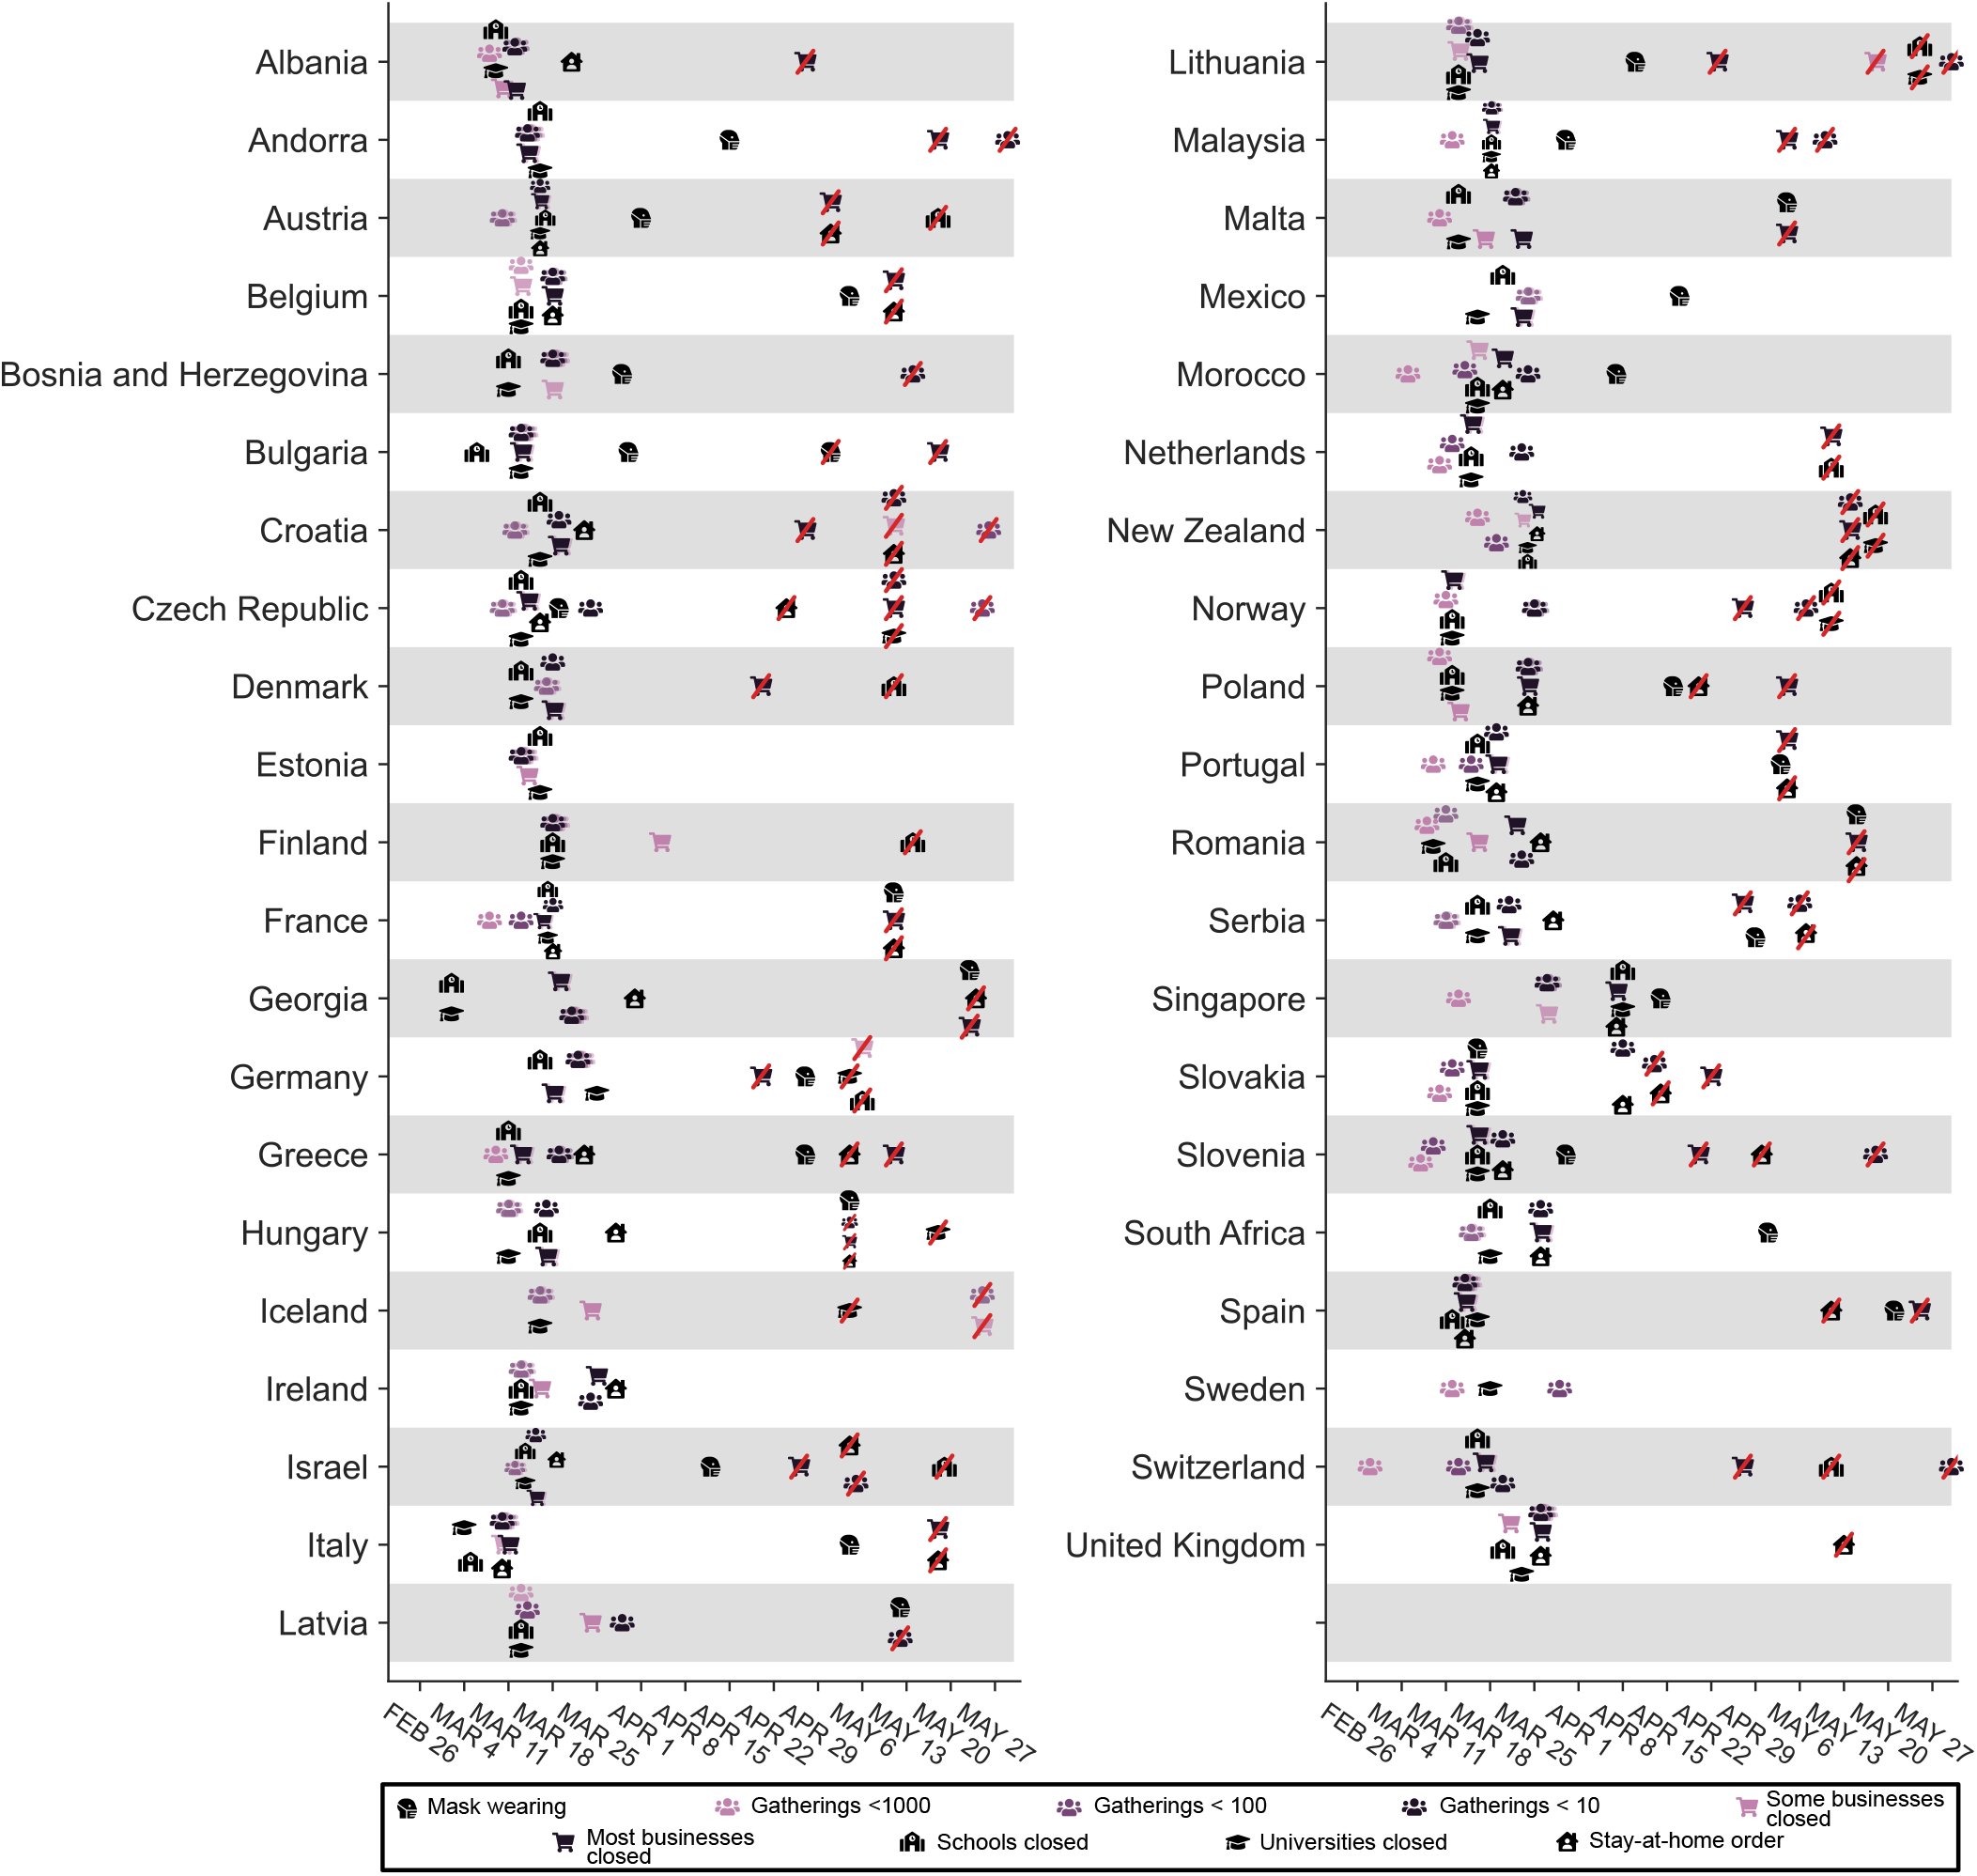 Figure 1
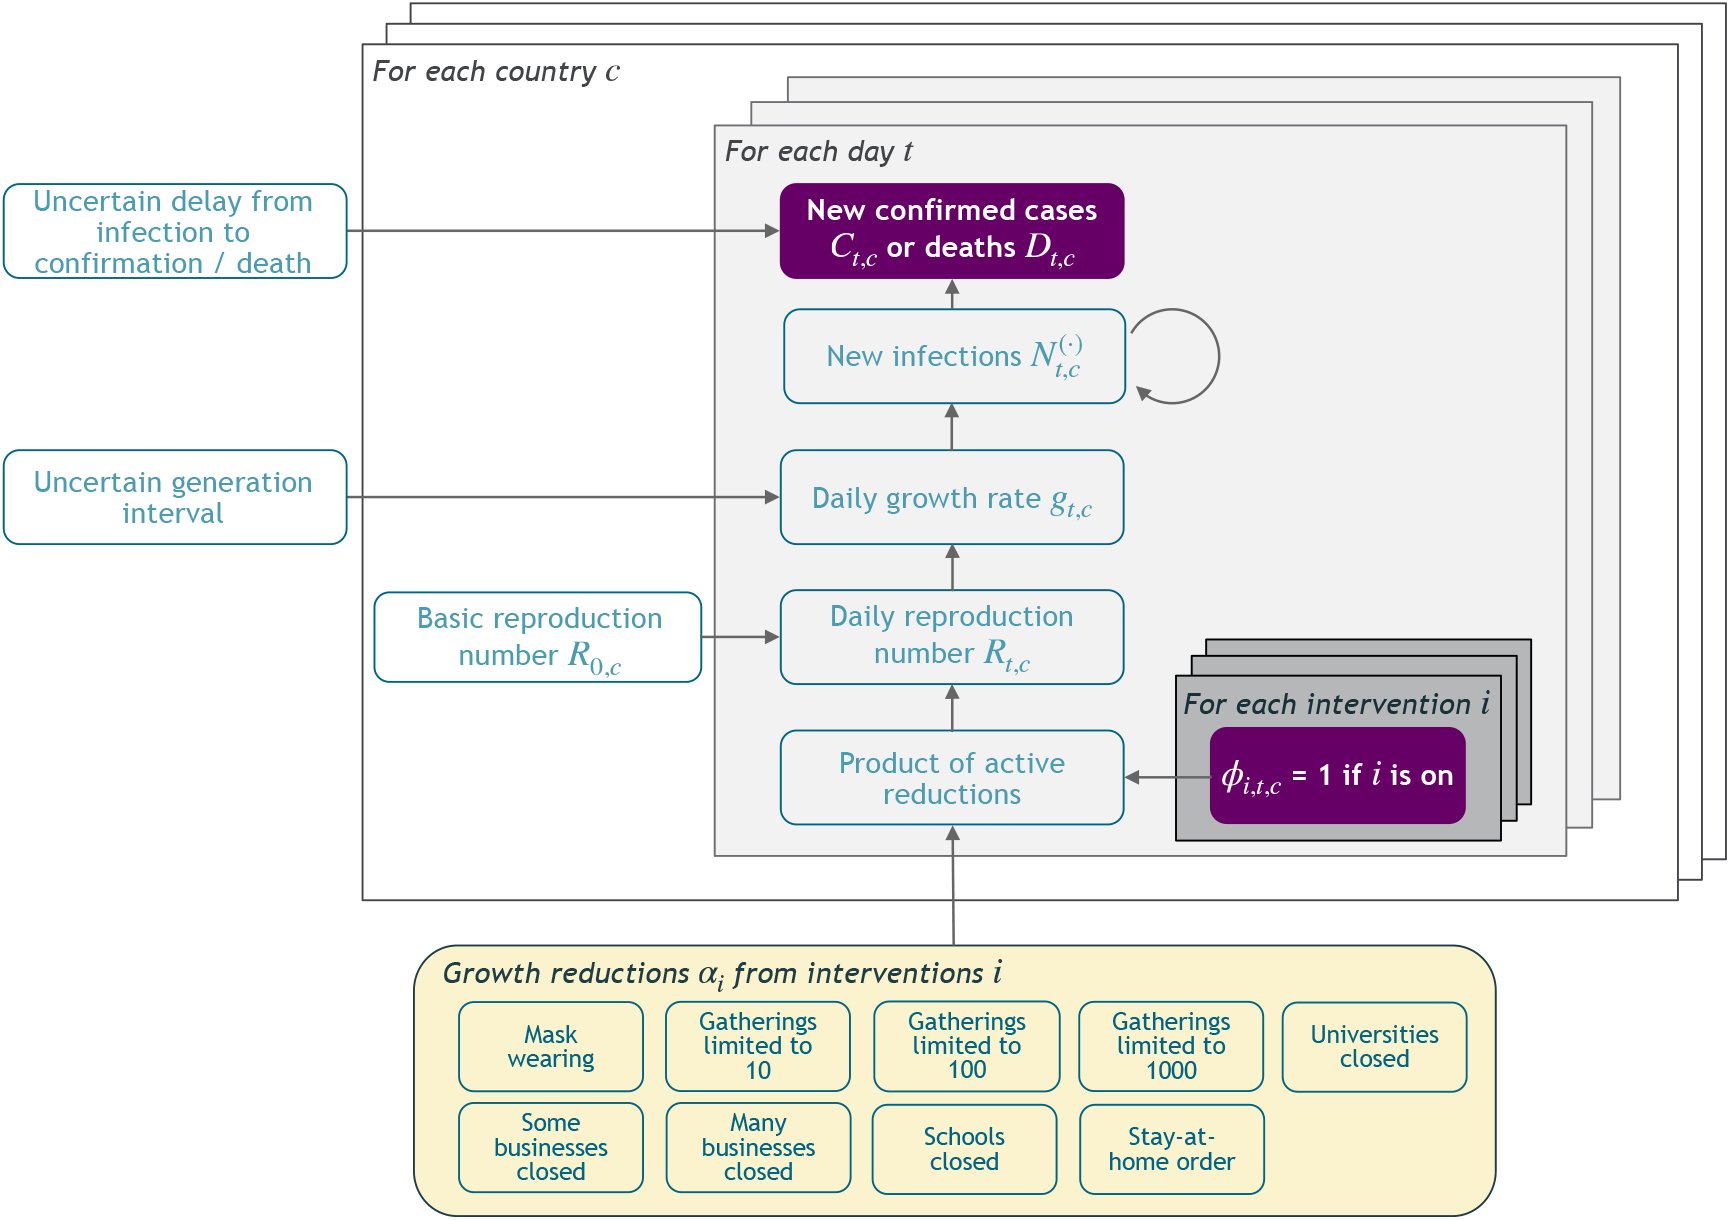 Figure 2
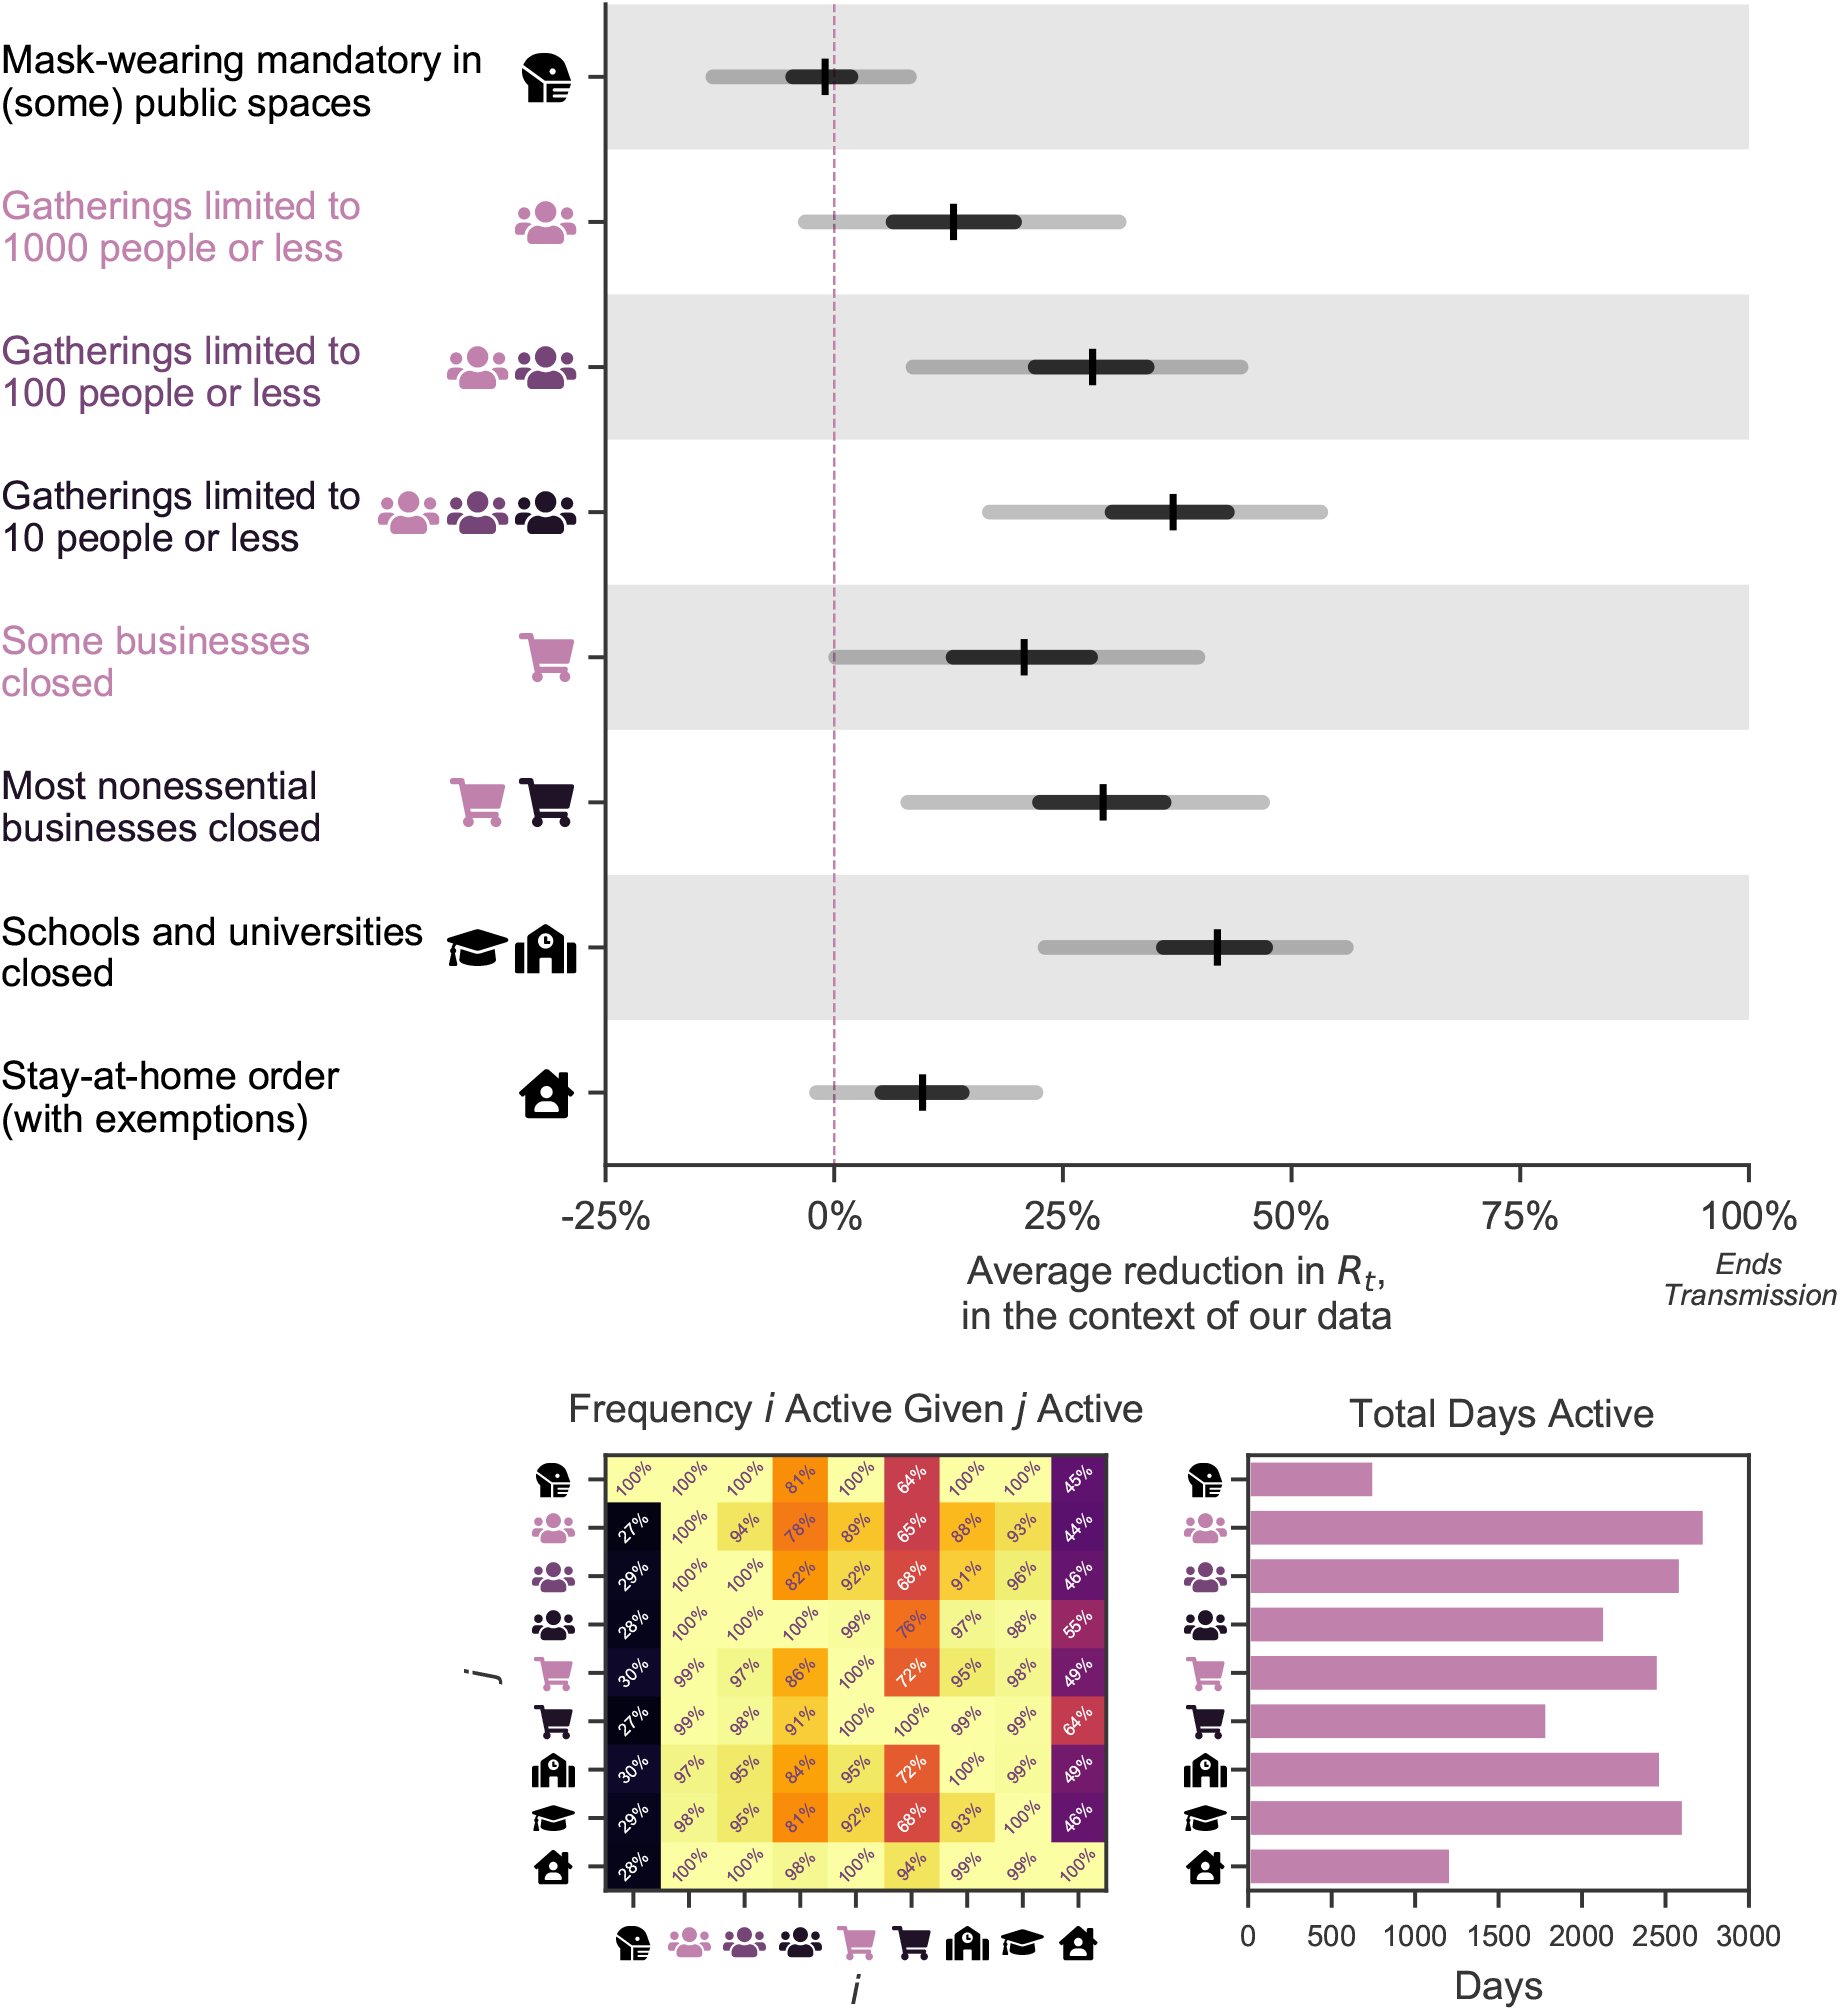 Figure 3
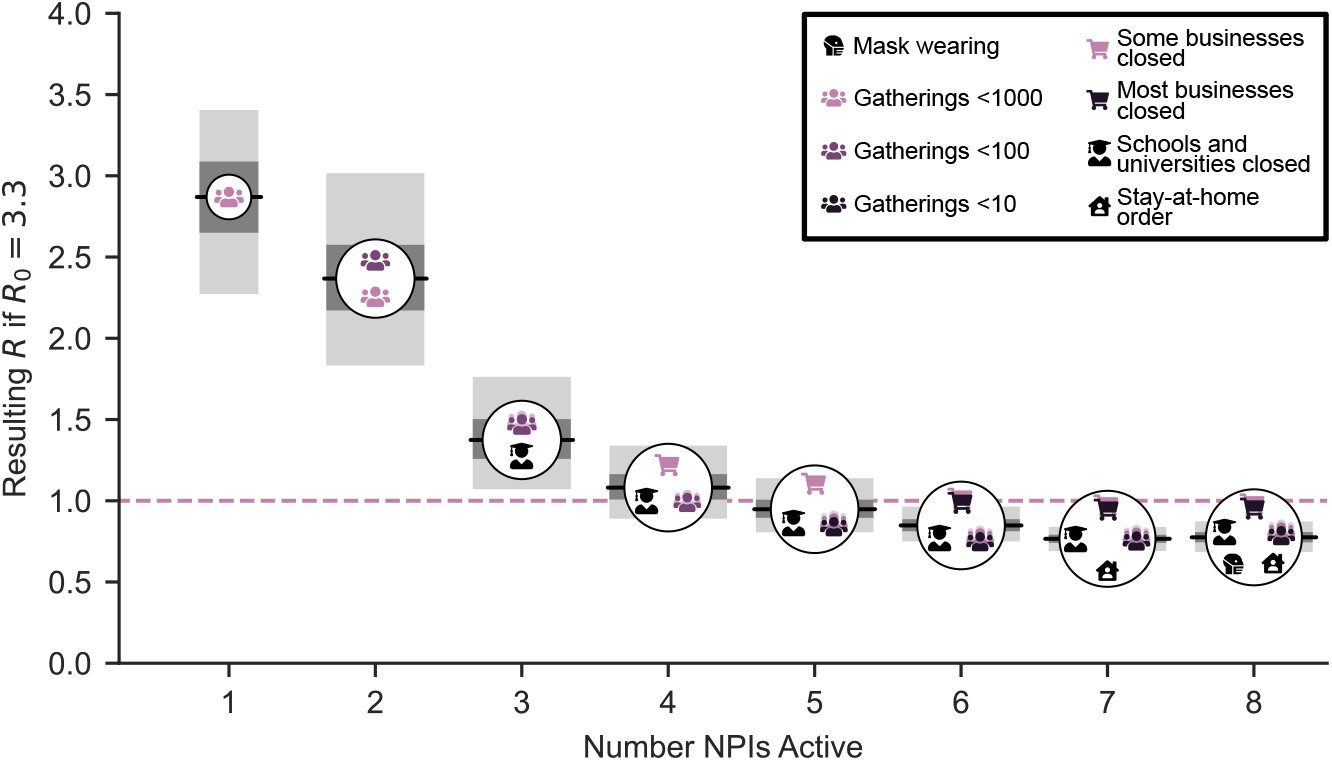 Figure 4
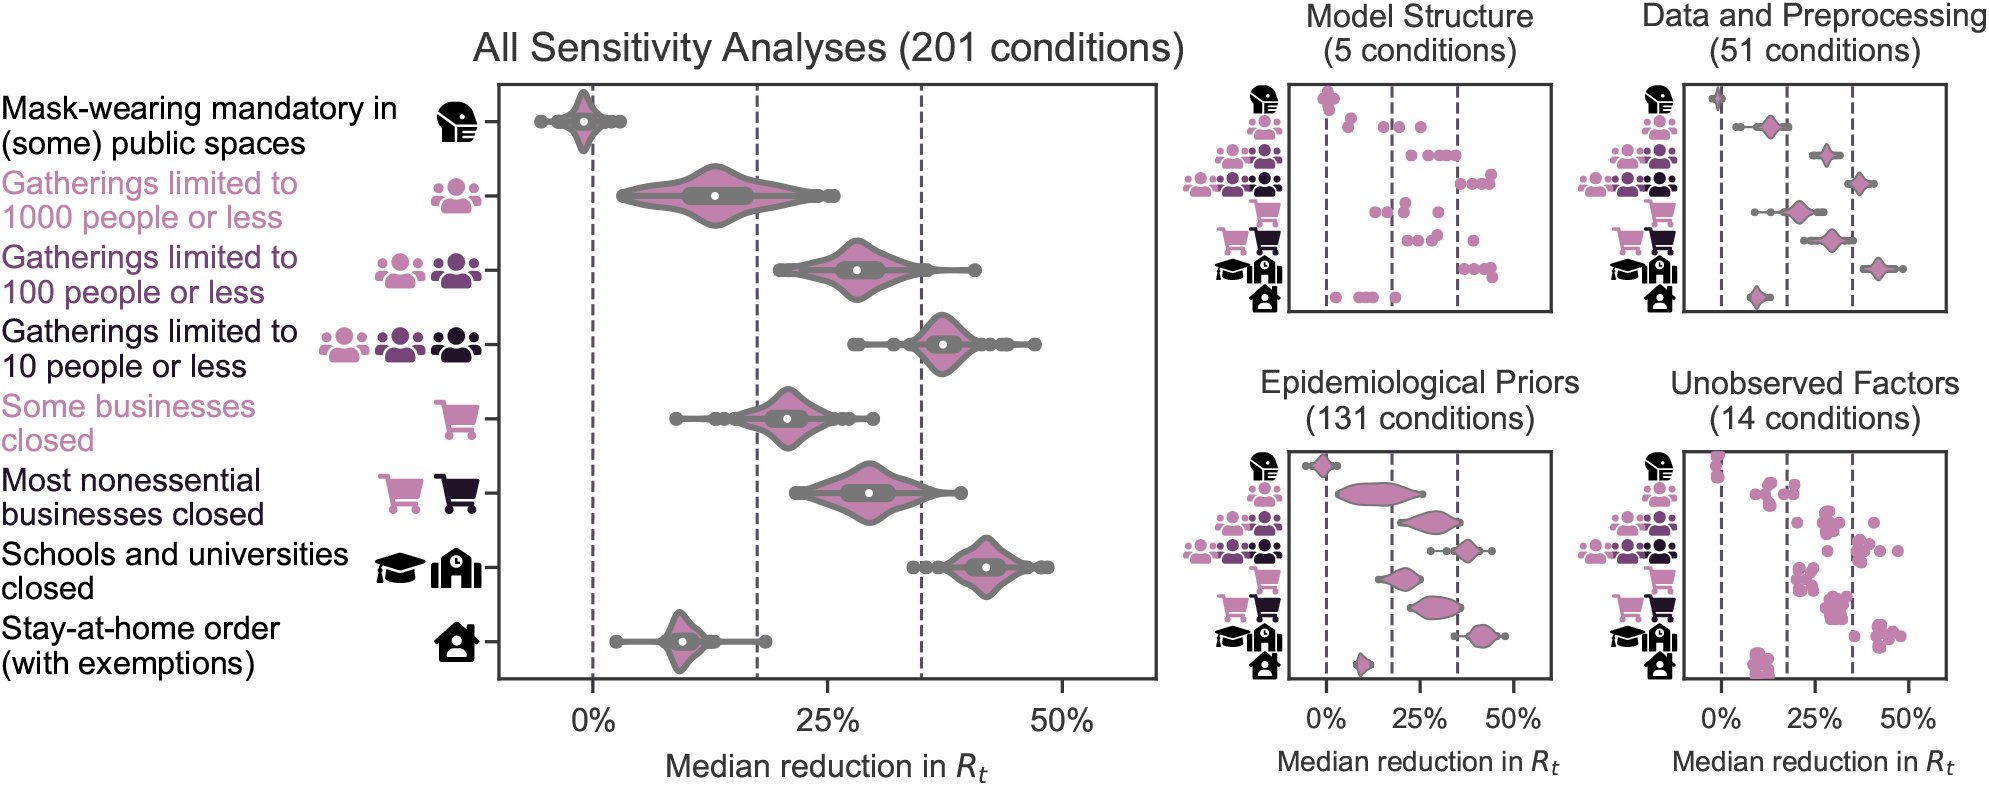 Figure 5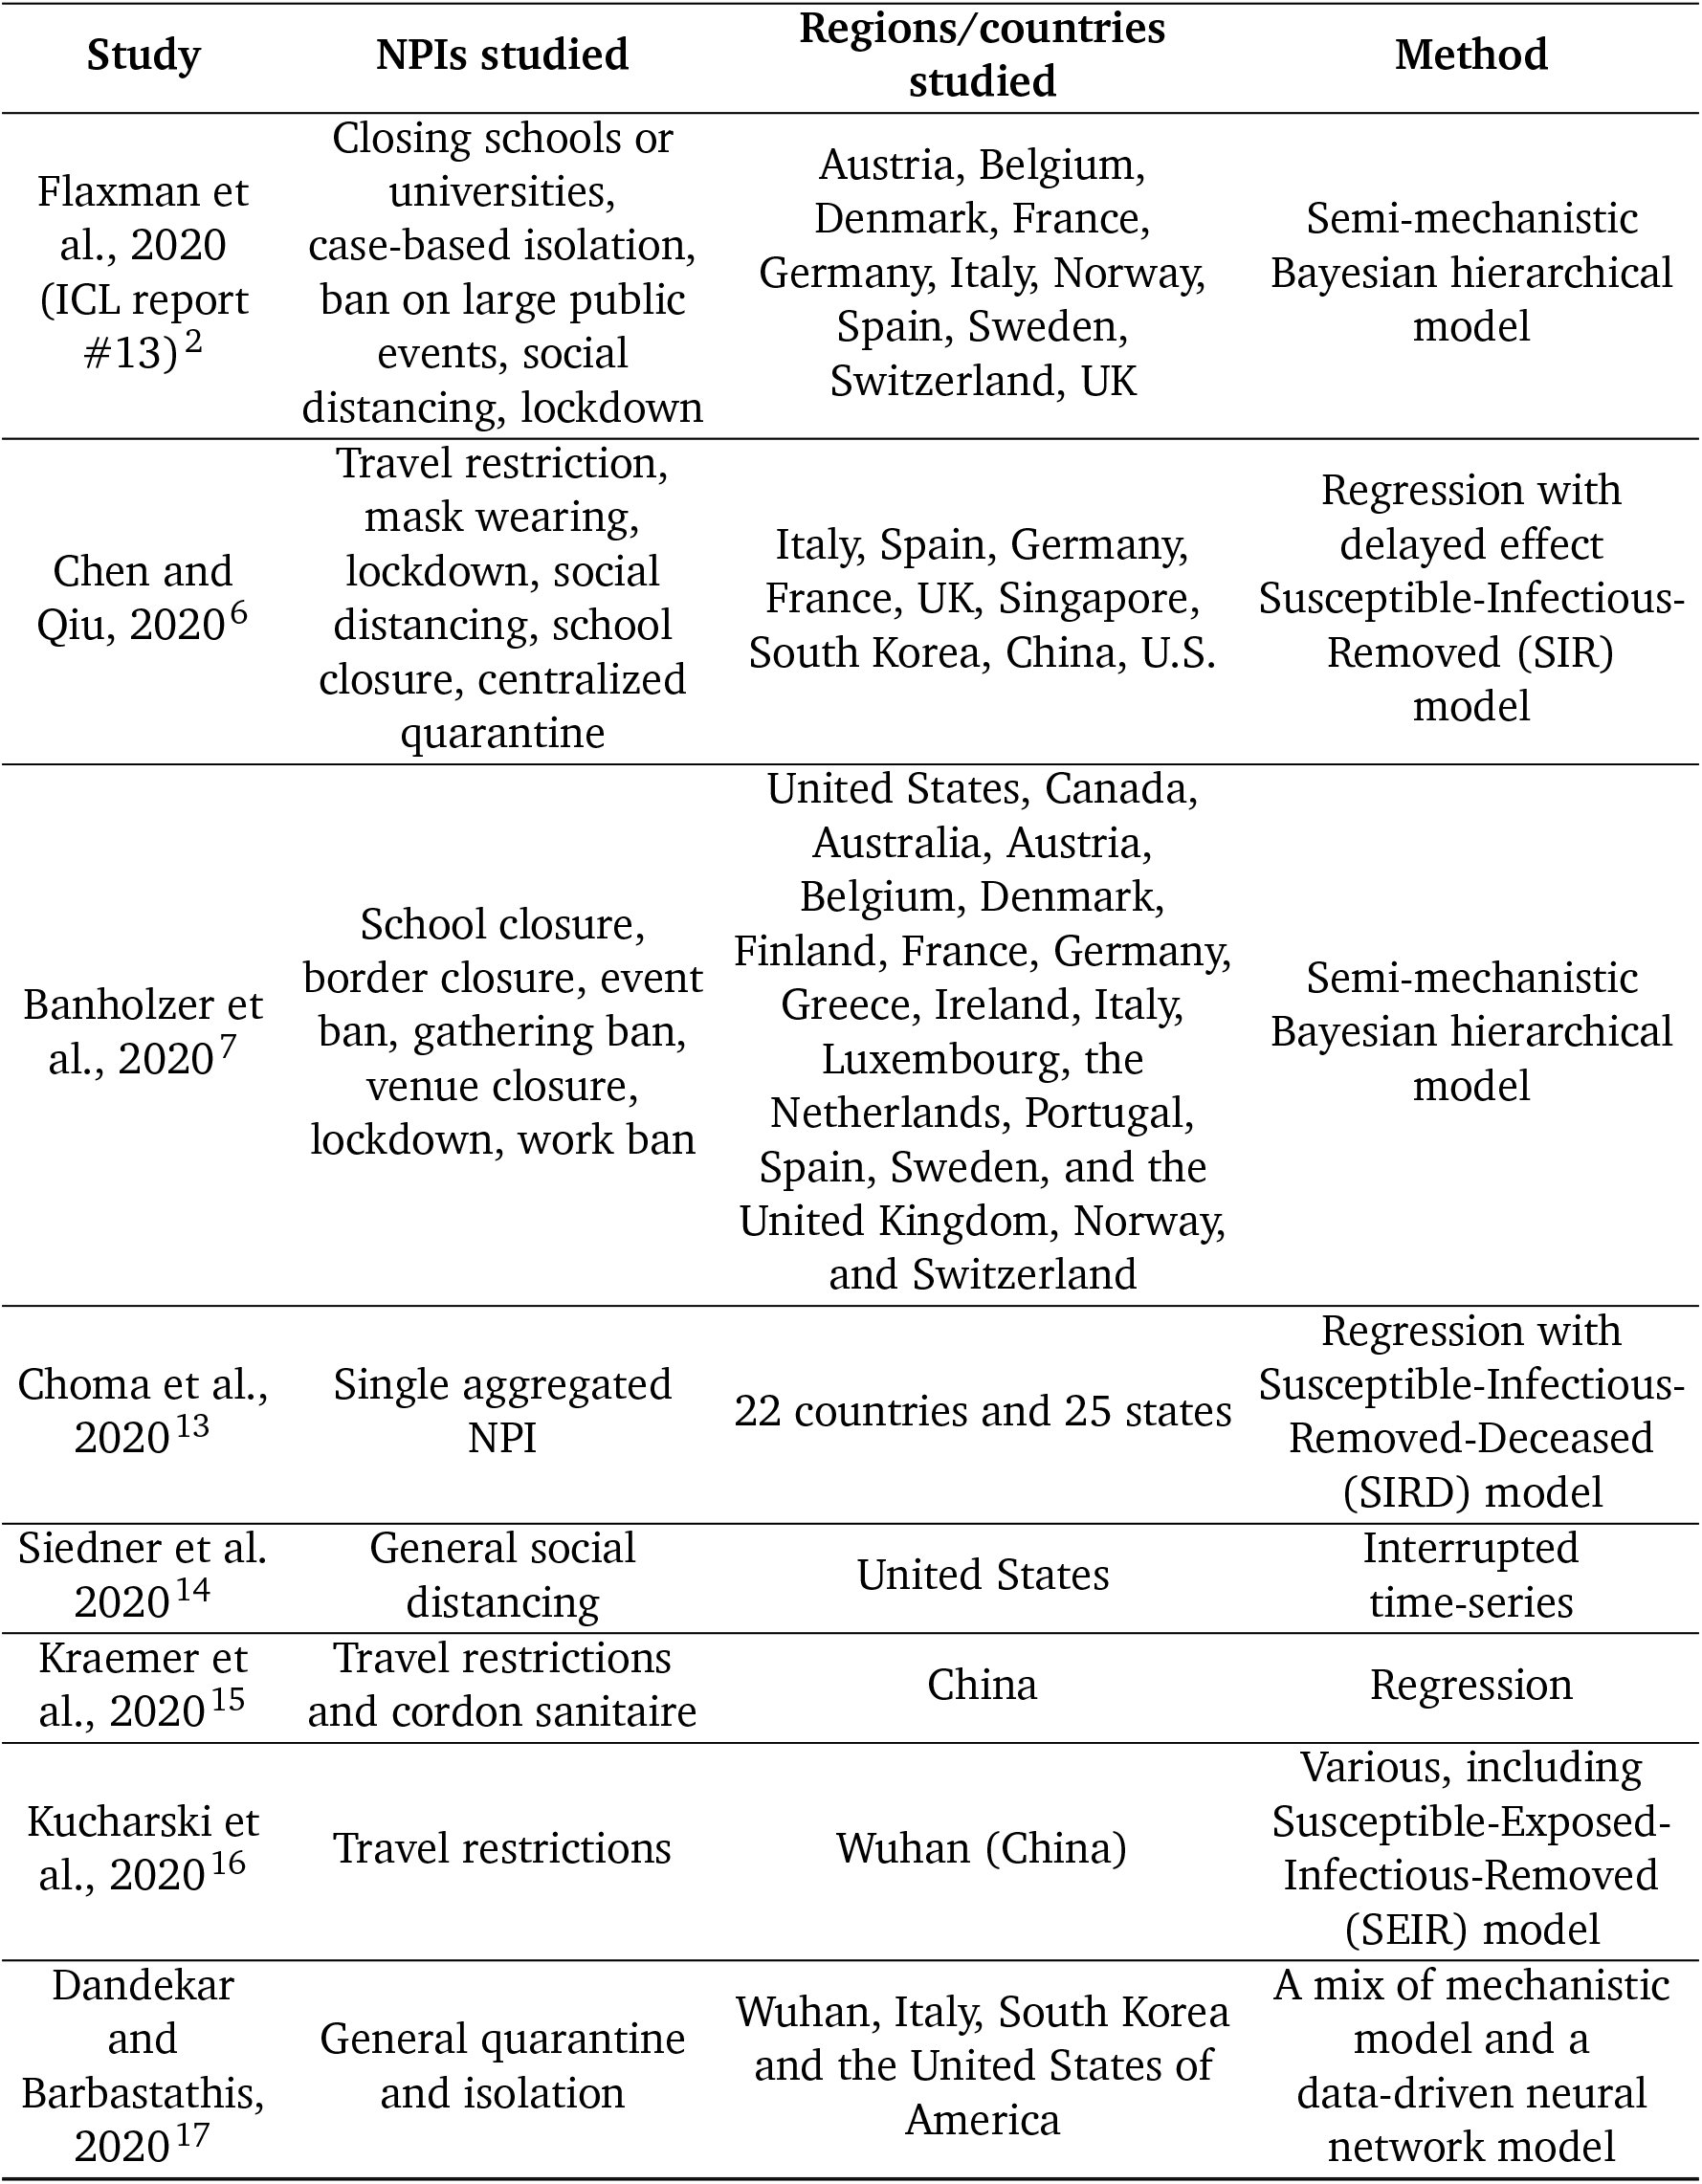

































Peer Reviews
No public reviews on file for this paper yet. If you reviewed it on a platform where reviews are public (OpenReview, ICLR, NeurIPS, ICML), you can paste yours below so the community can read it here.
Videos
No videos yet. Explain this paper in a talk, walkthrough, or lecture? Add one.
Taxonomy
TopicsCOVID-19 epidemiological studies · COVID-19 Pandemic Impacts · COVID-19 Digital Contact Tracing
Introduction
Worldwide, governments have mobilised vast resources to fight the COVID-19 pandemic. A wide range of nonpharmaceutical interventions (NPIs) has been deployed, including drastic measures like stay-at-home orders and the closure of all nonessential businesses. Recent analyses show that these large-scale NPIs were jointly effective at reducing the virus’ effective reproduction number^1^, but it is still largely unknown how effective individual NPIs were. As time progresses and more data become available, we can move beyond estimating the combined effect of a bundle of NPIs and begin to understand the effects of individual interventions. This can help governments efficiently control the epidemic, by focusing on the most effective NPIs to ease the burden put on the population.
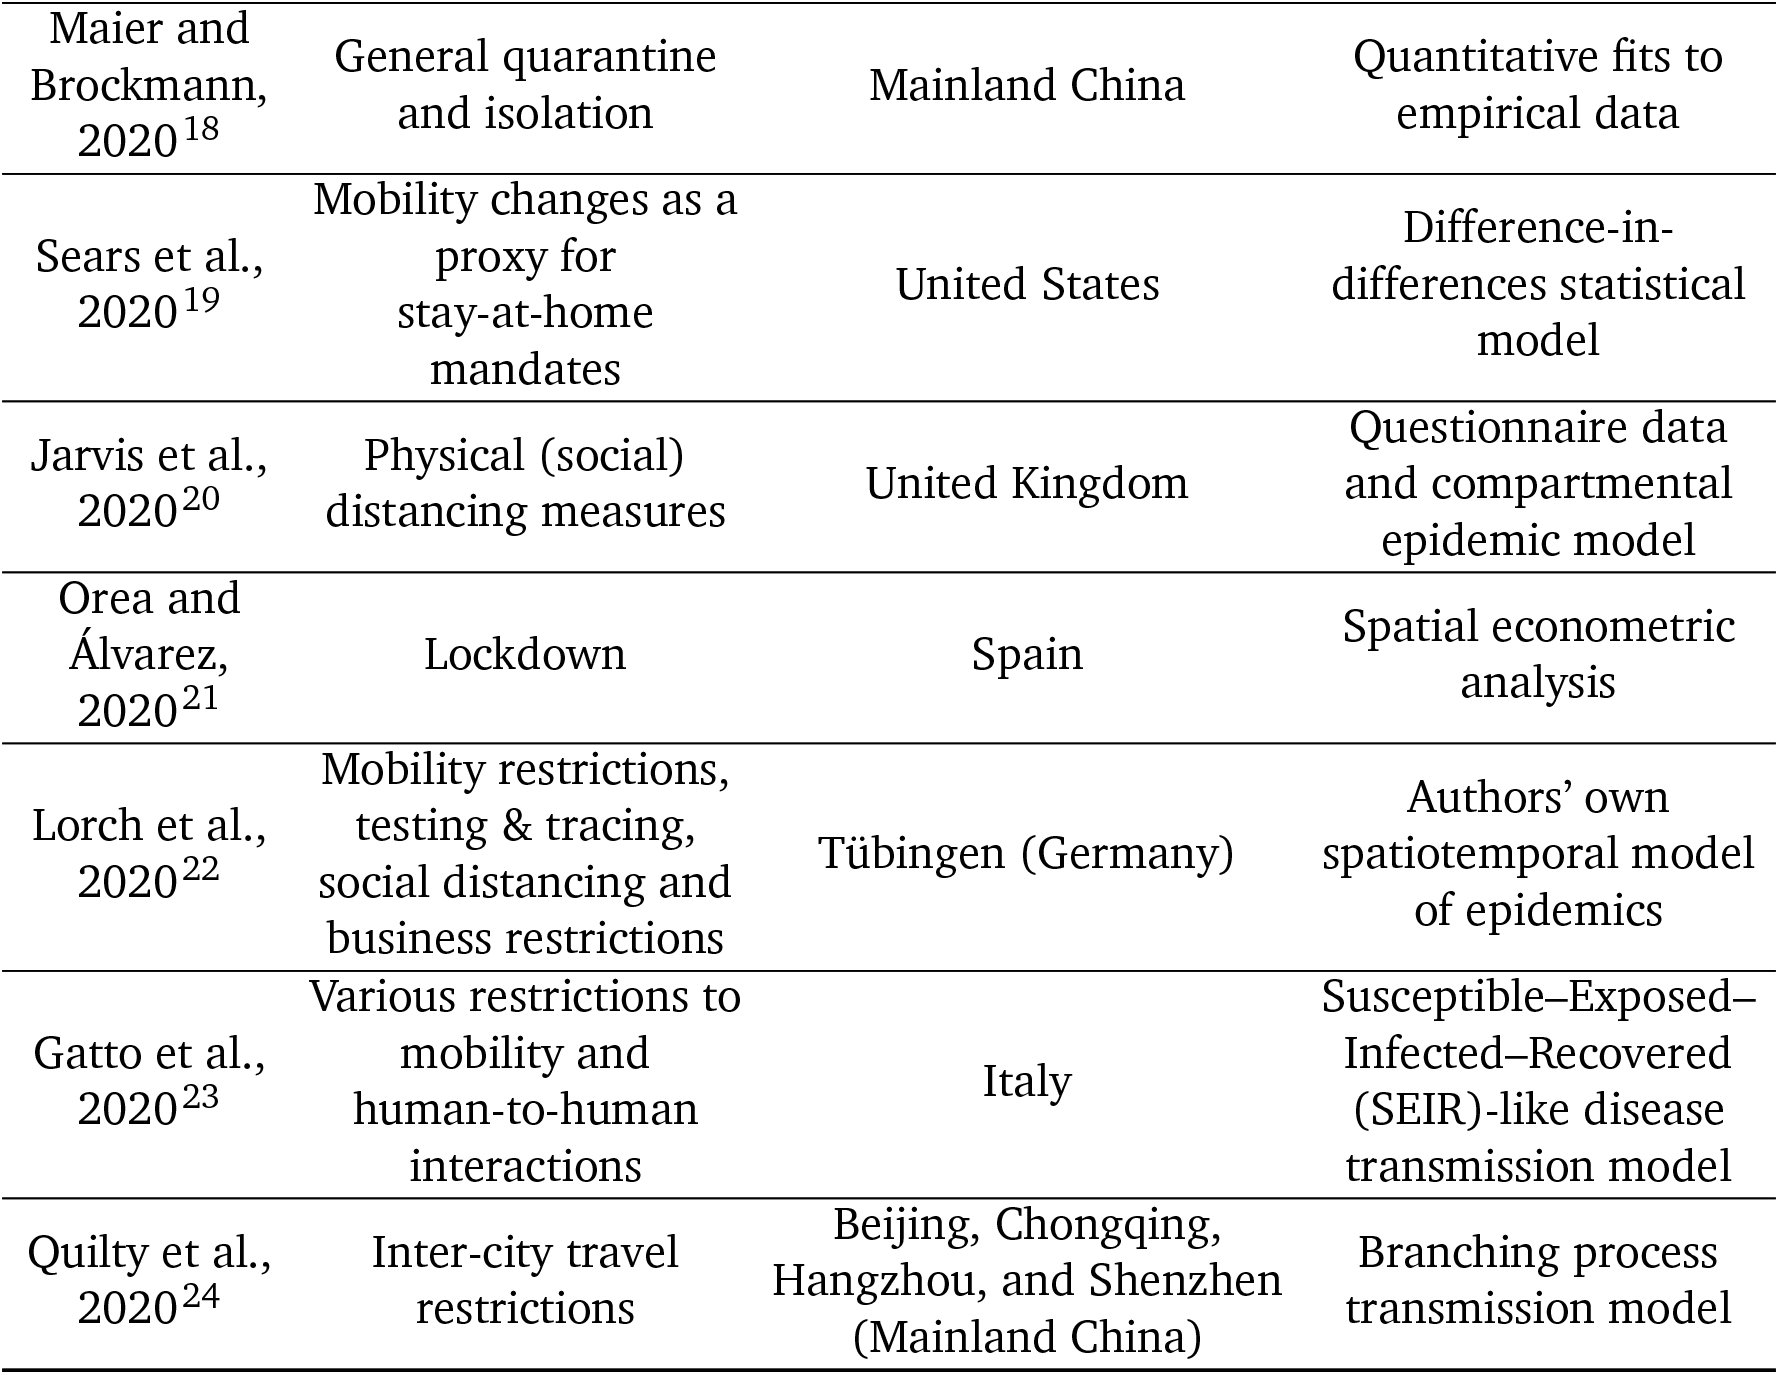
A promising way to estimate NPI effectiveness is data-driven, cross-country modelling: inferring effectiveness by relating the NPIs implemented in different countries to the course of the epidemic in these countries. To disentangle the effects of individual NPIs, we need to leverage data from multiple countries with diverse sets of interventions in place. Previous data-driven studies (Table F.8) estimate effectiveness for individual countries^2–4^ or NPIs, although some exceptions exist^1,5–8^ (summarised in Table F.7). In contrast, we evaluate the impact of 8 NPIs on the epidemic’s growth in 34 European and 7 non-European countries. To isolate the effect of individual NPIs, we also require sufficiently diverse data. If all countries implemented the same set of NPIs on the same day, the individual effect of each NPI would be unidentifiable. However, the COVID-19 response was far less coordinated: countries implemented different sets of NPIs, at different times, in different orders (Figure 1).
Timing of NPI implementations in early 2020. Crossed-out symbols signify when an NPI was lifted. Detailed definitions of the NPIs are given in Table 1.
Even with diverse data from many countries, estimating NPI effects remains a challenging task. First, models are based on epidemiological parameters that are only known with uncertainty; our NPI effectiveness study, to the best of our knowledge, is the first to include some of this uncertainty in the model. Second, the data are retrospective and observational, meaning that unobserved factors could confound the results. Third, NPI effectiveness estimates can be highly sensitive to arbitrary modelling decisions, as demonstrated by two recent replication studies^9,10^. Fourth, large-scale public NPI datasets suffer from frequent inconsistencies^11^ and missing data^12^. For these reasons, the data and the model must be carefully validated, and insufficiently validated results should not be used to guide policy decisions. We collect the largest public dataset on NPI implementation dates that was validated by independent double entry and perform, to our knowledge, the most extensive validation of any COVID-19 NPI effectiveness estimates to date—a crucial but largely absent or incomplete element of NPI effectiveness studies^10^.
Even with extensive validation, we need to be careful when interpreting this study’s results. We only study the impact NPIs had between January and the end of May 2020, and NPI effectiveness may change over time as circumstances change. In particular, lifting an NPI does not imply that transmission will return to its original level. These and other limitations are detailed in the Discussion.
Methods
Dataset
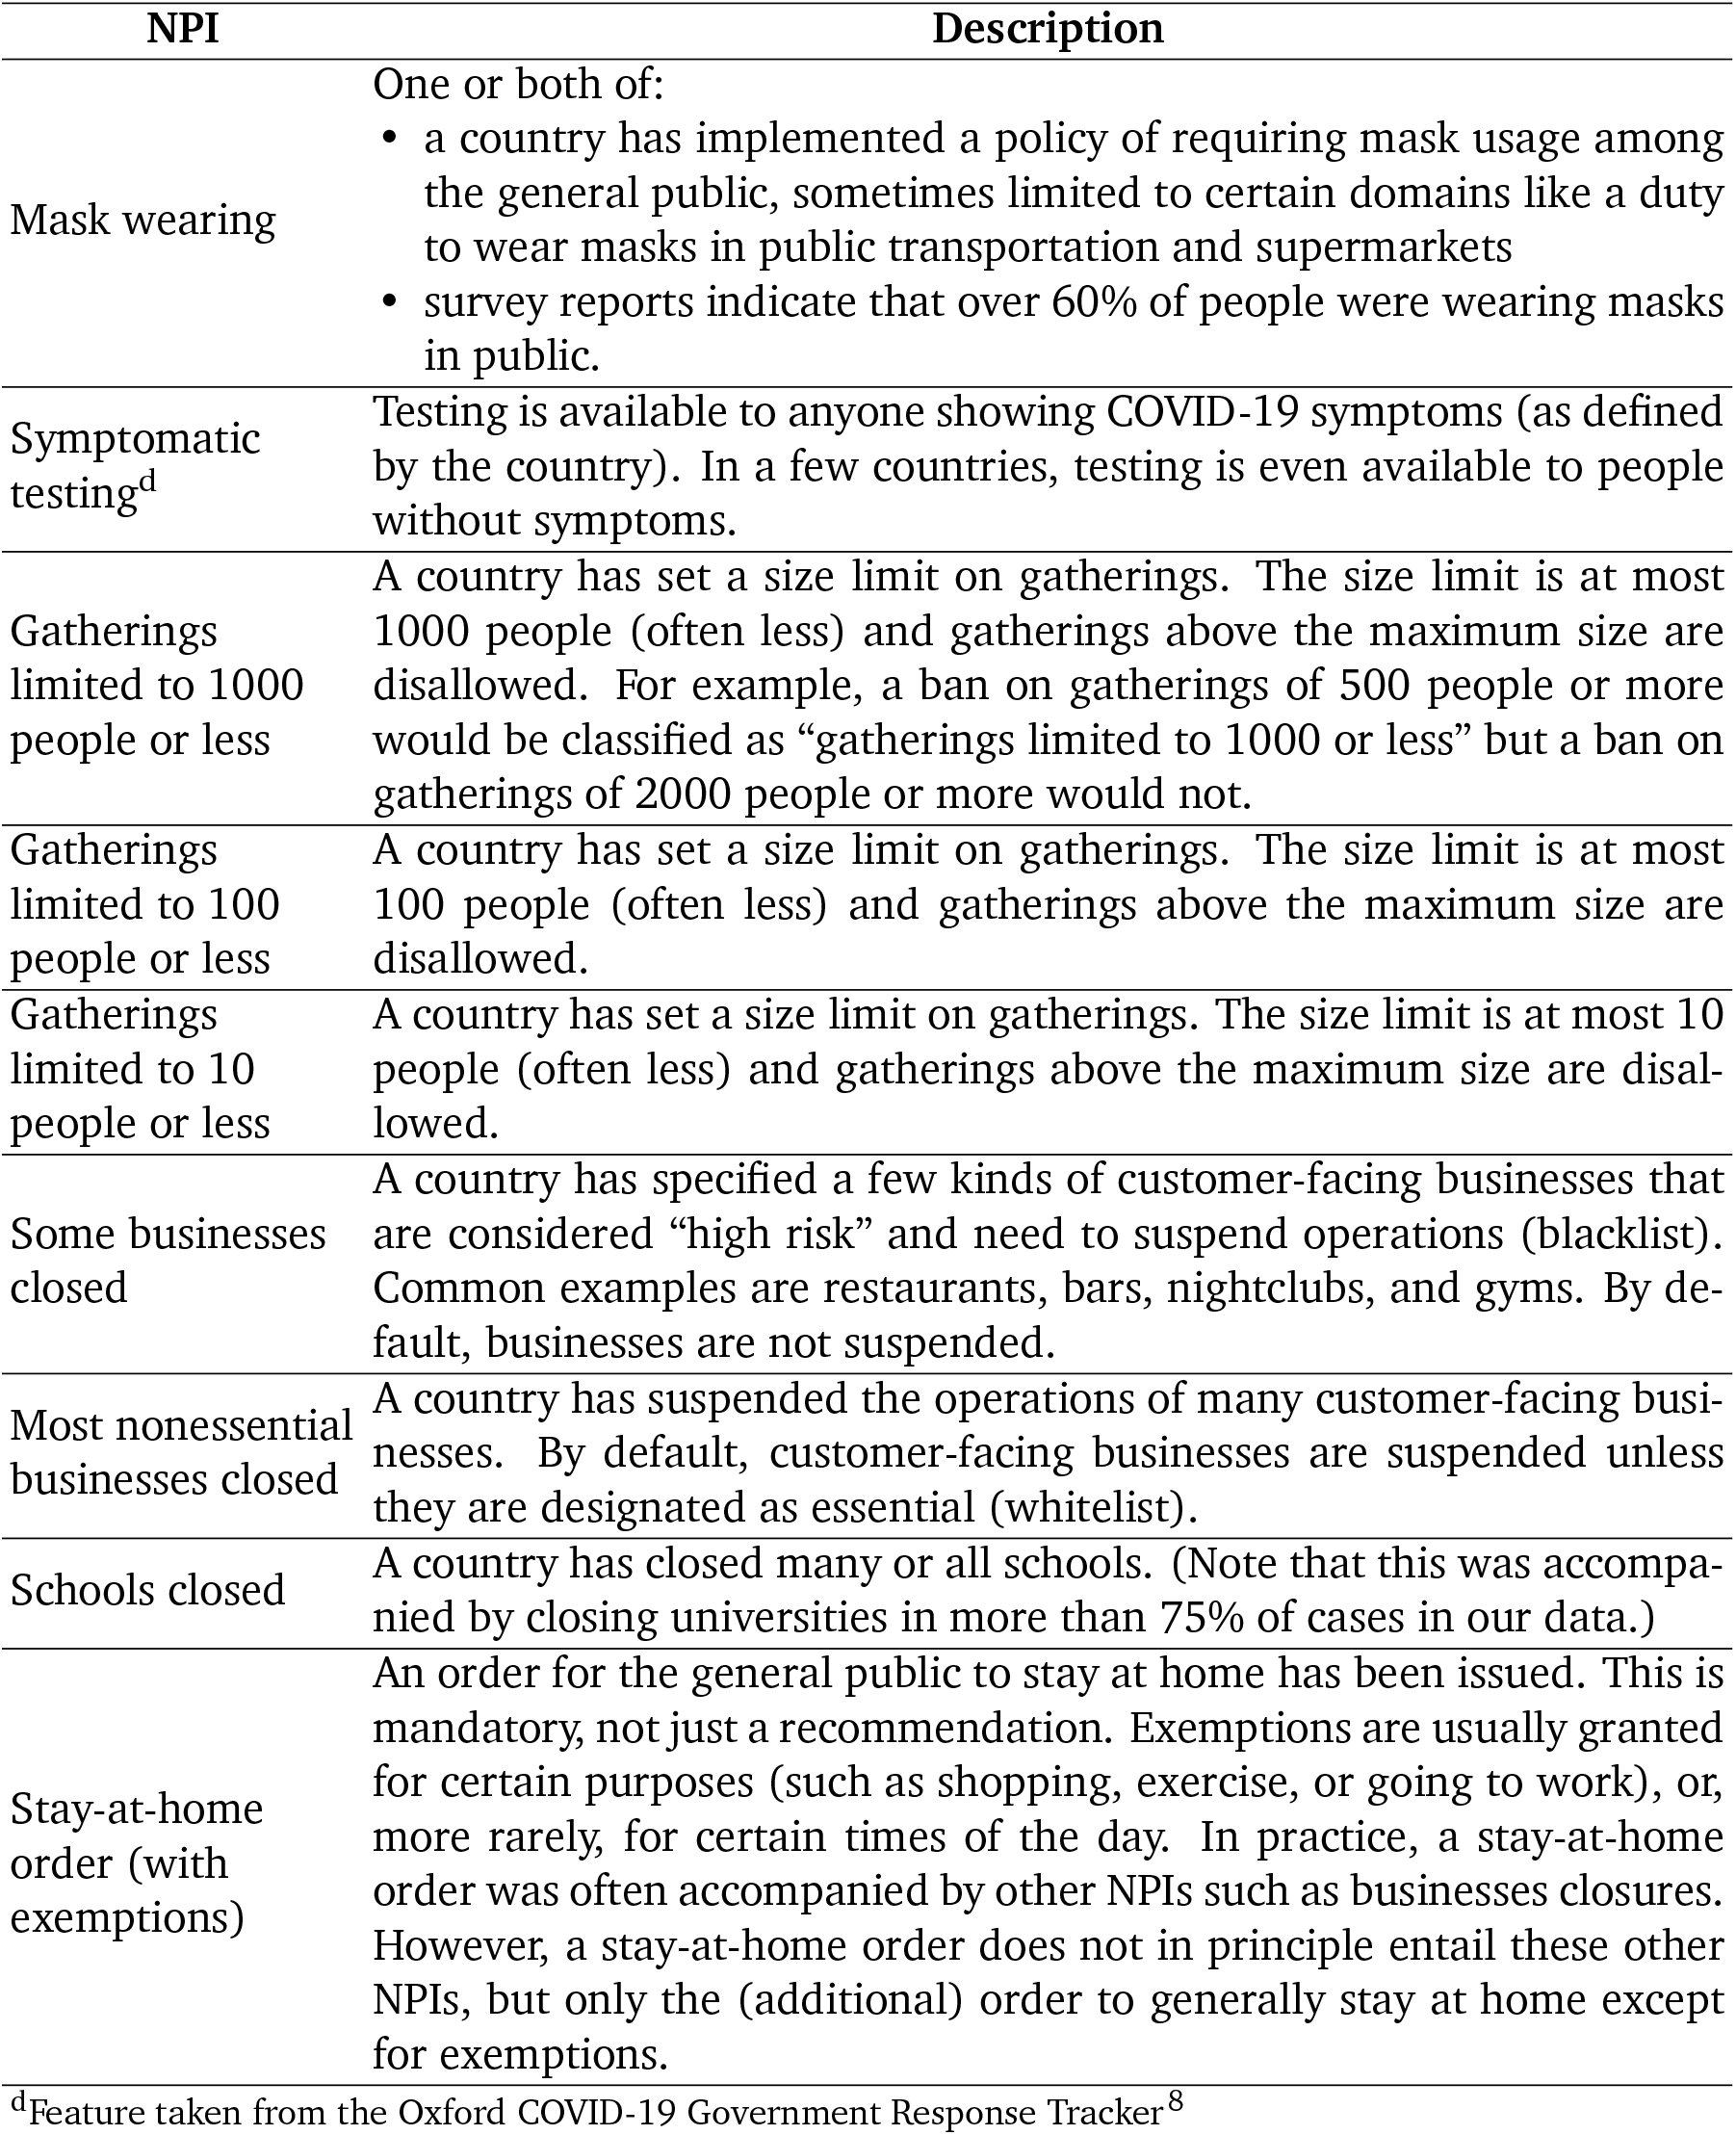
We analyse the effects of NPIs (Table 1) in 41 countries^a^ (see Figure 1). We recorded NPI implementations when the measures were implemented nationally or in most regions of a country (affecting at least three fourths of the population). For each country, the window of analysis starts on the 22nd of January and ends after the first NPI was lifted, or on the 30th of May 2020, whichever was earlier. The reason to end the analysis after the first major reopening^b^ was to avoid a distribution shift. For example, when schools reopened, it was often with safety measures, such as smaller class sizes and distancing rules. It is therefore expected that contact patterns in schools will have been different before school closure compared to after reopening. Modelling this difference explicitly is left for future work. Data on confirmed COVID-19 cases and deaths were taken from the Johns Hopkins CSSE COVID-19 Dataset^13^. The data used in this study, including sources, are available online here.
Table 1:: NPIs included in the study. Appendix G details how edge cases in the data collection were handled.
Data collection
We collected data on the start and end date of NPI implementations, from the start of the pandemic until the 30th of May 2020. Before collecting the data, we experimented with several public NPI datasets, finding that they were not complete enough for our modelling and contained incorrect dates.^c^ By focusing on a smaller set of countries and NPIs than these datasets, we were able to enforce strong quality controls: We used independent double entry and manually compared our data to public datasets for cross-checking.
First, two authors independently researched each country and entered the NPI data into separate spreadsheets. The researchers manually researched the dates using internet searches: there was no automatic component in the data gathering process. The average time spent researching each country per researcher was 1.5 hours.
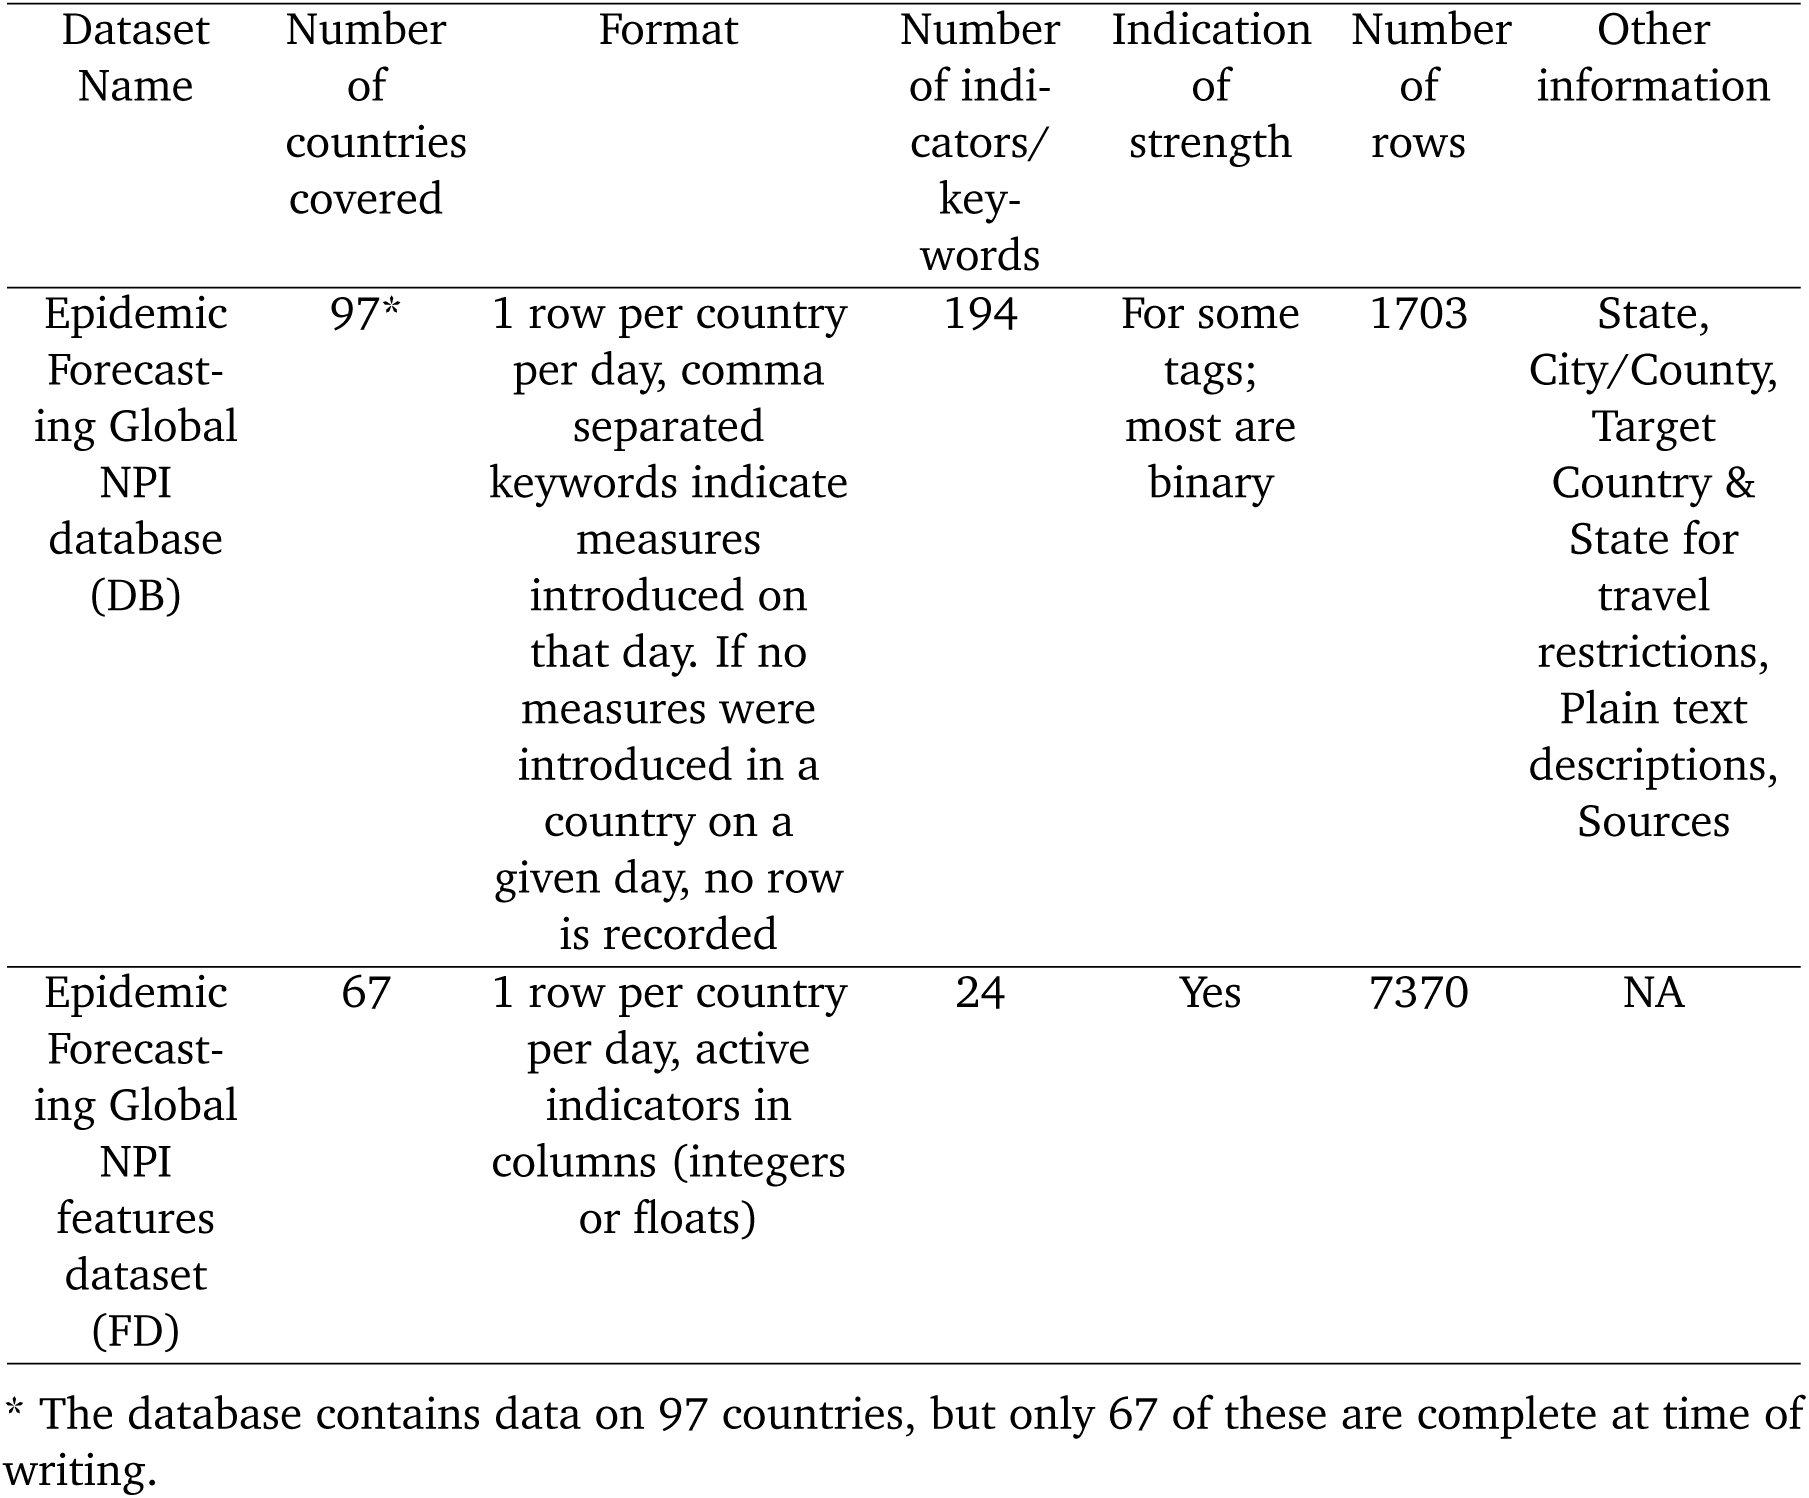
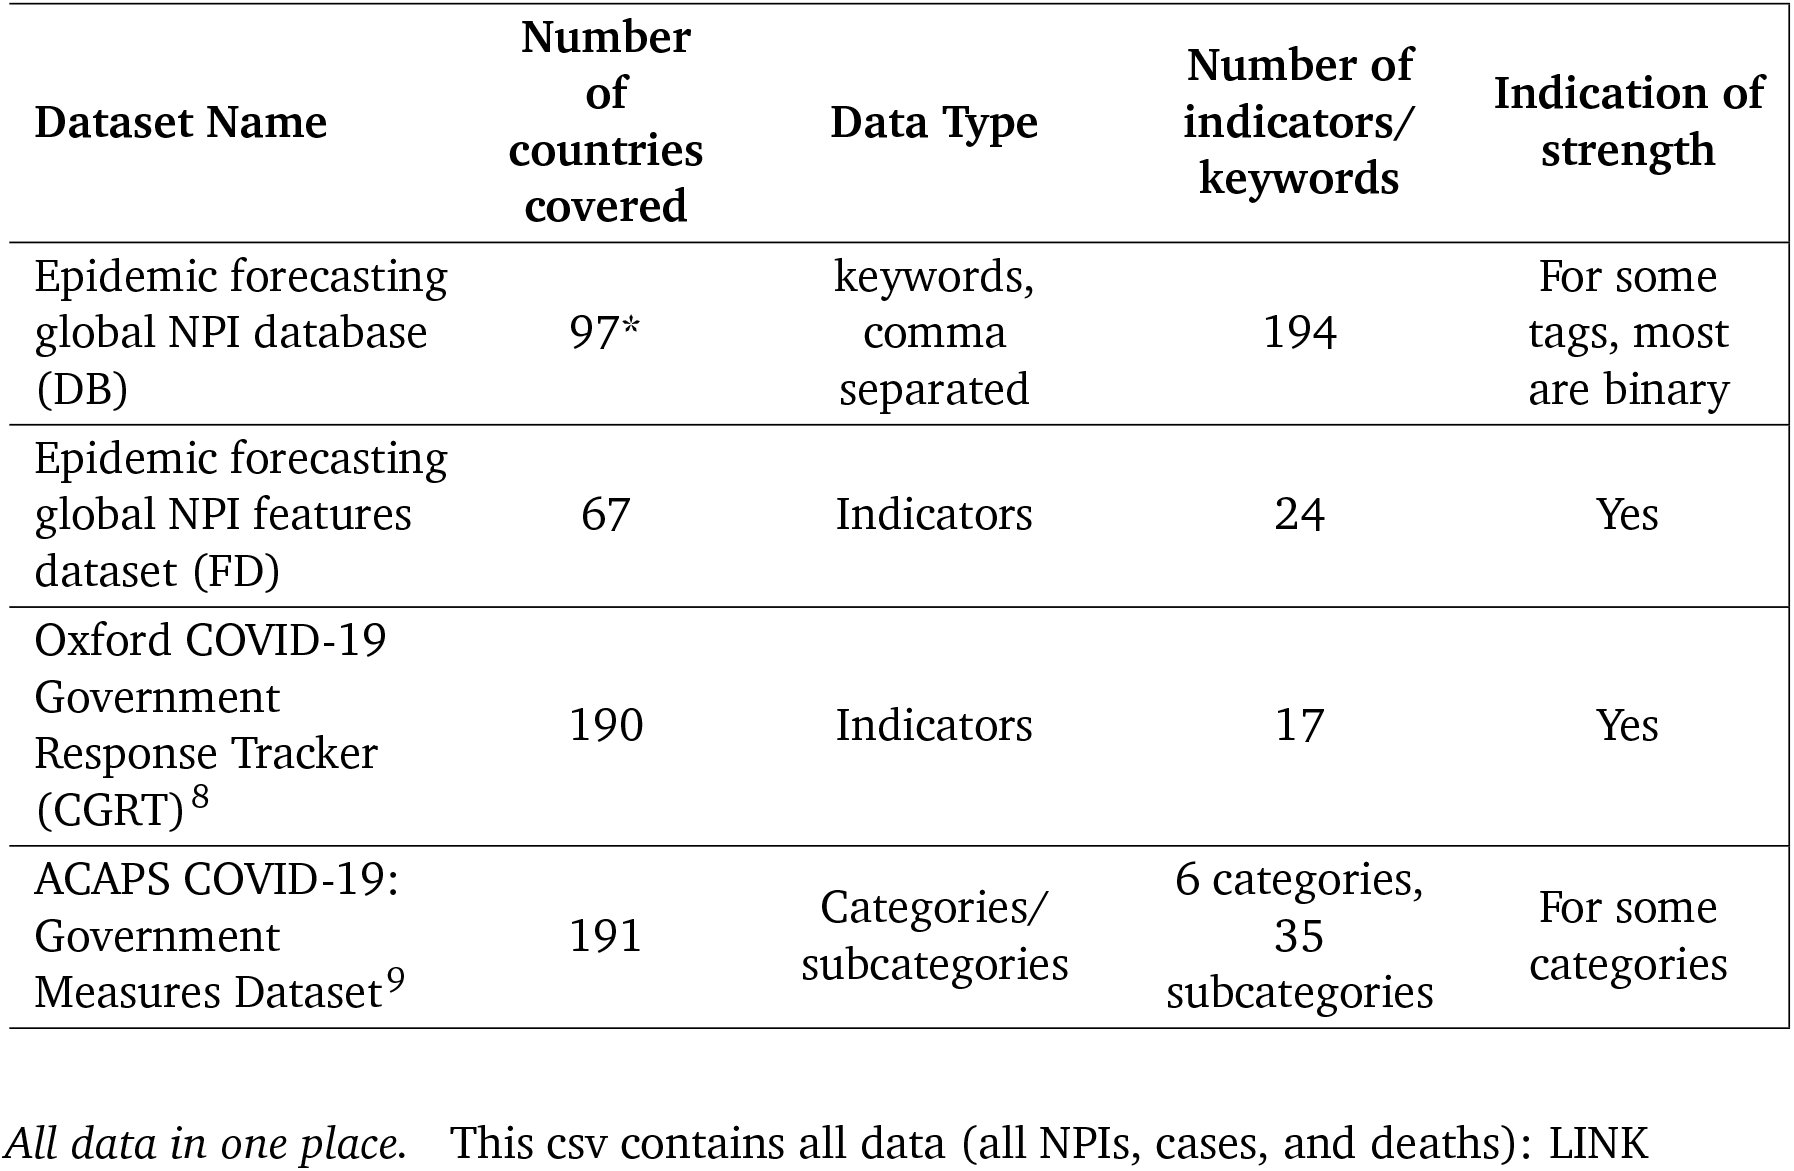
Second, the researchers independently compared their entries to the following public datasets and, if there were conflicts, visited all primary sources to resolve the conflict: the EFGNPI database^14^, the Oxford COVID-19 Government Response Tracker^15^, and the mask4all dataset^16^.
Third, each country and NPI was again independently entered by one to three paid contractors, who were provided with a detailed description of the NPIs and asked to include primary sources with their data. A researcher then resolved any conflicts between this data and one (but not both) of the spreadsheets.
Finally, the two independent spreadsheets were combined and all conflicts resolved by a researcher. The final dataset contains primary sources (government websites and/or media articles) for each entry.
Data Preprocessing
When the case count is small, a large fraction of cases may be imported from other countries and the testing regime may change rapidly. To prevent this from biasing our model, we neglect case numbers before a country has reached 100 confirmed cases and death numbers before a country has reached 10 deaths. We include these thresholds in our sensitivity analysis (Appendix C.3).
Short model description
In this section, we give a short summary of the model (Figure 2). The detailed model description is given in Appendix A. Code is available online here.
Model Overview. Purple nodes are observed. We describe the diagram from bottom to top: The effectiveness of NPI i is represented by αi, which is independent of the country. On each day t, a country’s daily reproduction number Rt, c depends on the country’s basic reproduction number R0,c and the active NPIs. The active NPIs are encoded by Fi, t, c, which is 1 if NPI i is active in country c at time t, and 0 otherwise. Rt, c is transformed into the daily growth rate gt, c using the generation interval parameters, and subsequently is used to compute the new infections and that will turn into confirmed cases and deaths, respectively. Finally, the number of new confirmed cases Ct, c and deaths Dt, c is computed by a discrete convolution of with the respective delay distributions. Our model uses both death and case data: it splits all nodes above the daily growth rate gt, c into separate branches for deaths and confirmed cases. We account for uncertainty in the generation interval, infection-to-case-confirmation delay and the infection-to-death delay by placing priors over the parameters of these distributions.
Our model uses case and death data from each country to ‘backwards’ infer the number of new infections at each point in time, which is itself used to infer the reproduction numbers. NPI effects are then estimated by relating the daily reproduction numbers to the active NPIs, across all days and countries. This relatively simple, data-driven approach allows us to sidestep assumptions about contact patterns and intensity, infectiousness of different age groups, and so forth, that are typically required in modelling studies. We make several additions to the semi-mechanistic Bayesian hierarchical model of Flaxman et al.^1^, allowing our model to observe both cases and death data. This increases the amount of data from which we can extract NPI effects, reduces distinct biases in case and death reporting, and reduces the bias from including only countries with many deaths. Since epidemiological parameters are only known with uncertainty, we place priors over them, following recent recommended practice^17^. Additionally, as we do not aim to infer the total number of COVID-19 infections, we can avoid assuming a specific infection fatality rate (IFR) or ascertainment rate (rate of testing).
The growth of the epidemic is determined by the time- and country-specific reproduction number Rt,c, which depends on: a) the (unobserved) basic reproduction number R0,c given no active NPIs and b) the active NPIs at time t. R0,c accounts for all time-invariant factors that affect transmission in country c, such as differences in demographics, population density, culture, and health systems^18^. We assume that the effect of each NPI on Rt,c is stable across countries and time. The effectiveness of NPI i is represented by a parameter αi, over which we place an Asymmetric Laplace prior that allows for both positive and negative effects but places 80% of its mass on positive effects, reflecting that NPIs are more likely to reduce Rt,c than to increase it. Following Flaxman et al. and others^1,6,8^, each NPI’s effect on Rt,c is assumed to independently affect Rt,c as a multiplicative factor: [eqn] where ϕi,c,t = 1 indicates that NPI i is active in country c on day t (ϕi,c,t = 0 otherwise), and I is the number of NPIs. The multiplicative effect encodes the plausible assumption that NPIs have a smaller absolute effect when Rt,c is already low. We discuss the meaning of effectiveness estimates given NPI interactions in the Results section.
In the early phase of an epidemic, the number of new daily infections grows exponentially. During exponential growth, there is a one-to-one correspondence between the daily growth rate and Rt,c 19. The correspondence depends on the generation interval (the time between successive infections in a chain of transmission), which we assume to have a Gamma distribution. The prior on the mean generation interval has mean 5.06 days, derived from a meta-analysis^20^.
We model the daily new infection count separately for confirmed cases and deaths, representing those infections which are subsequently reported and those which are subsequently fatal. However, both infection numbers are assumed to grow at the same daily rate in expectation, allowing the use of both data sources to estimate each αi. The infection numbers translate into reported confirmed cases and deaths after a stochastic delay. The delay is the sum of two independent distributions, assumed to be equal across countries: the incubation period and the delay from onset of symptoms to confirmation. We put priors over the means of both distributions, resulting in a prior over the mean infection-to-confirmation delay with a mean of 10.92 days^20^, see Appendix A.3. Similarly, the infection-to-death delay is the sum of the incubation period and the delay from onset of symptoms to death, and the prior over its mean has a mean of 21.8 days^20^. Finally, as in related NPI models^1,6^, both the reported cases and deaths follow a negative binomial noise distribution with an inferred noise dispersion.
Using a Markov chain Monte Carlo (MCMC) sampling algorithm^21^, this model infers posterior distributions of each NPI’s effectiveness while accounting for cross-country variations in testing, reporting, and fatality rates as well as uncertainty in the generation interval and delay distributions. To analyse the extent to which modelling assumptions affect the results, our sensitivity analysis includes all epidemiological parameters, prior distributions, and many of the structural assumptions introduced above (Appendix B.2 and Appendix C). MCMC convergence statistics are given in Appendix C.7.
Results
NPI Effectiveness
Our model enables us to estimate the individual effectiveness of each NPI, expressed as a percentage reduction in R. As in related work^1,6,8^, this percentage reduction is modelled as constant over countries and time, and independent of the other implemented NPIs. In practice, however, NPI effectiveness may depend on other implemented NPIs and local circumstances. Thus, our effectiveness estimates ought to be interpreted as the effectiveness averaged over the contexts in which the NPI was implemented, in our data10. Our results thus give the average NPI effectiveness across typical situations that the NPIs were implemented in. Figure 3 (bottom left) visualises which NPIs typically co-occurred, aiding interpretation.
Top: NPI effects under default model settings. The Figure shows the average percentage reductions in R as observed in our data (or, in terms of the model, the posterior marginal distributions of 1 −exp(−αi)), with median, 50% and 95% credible intervals. A negative 1% reduction refers to a 1% increase in R. Cumulative effects are shown for hierarchical NPIs (gathering bans and business closures) i.e., the result for Most nonessential businesses closed shows the cumulative effect of two NPIs with separate parameters and symbols - closing some (high-risk) businesses, and additionally closing most remaining (non-high-risk, but nonessential) businesses given that some businesses are already closed. Bottom Left: Conditional activation matrix. Cell values indicate the frequency that NPI i (x-axis) was active given that NPI j (y-axis) was active. E.g., schools were always closed whenever a stay-at-home order was active (bottom row, third column from the right), but not vice versa. Bottom Right: Total number of days each NPI was active across all countries.
Under the default model settings, the mean percentage reduction in R (with 95% credible interval) associated with each NPI is as follows (Figure 3): mandating mask-wearing in (some) public spaces: −1% (−13%–8%), limiting gatherings to 1000 people or less: 13% (−3%–31%), to 100 people or less: 28% (9%–44%), to 10 people or less: 36% (17%– 53%), closing some high-risk businesses: 20% (0%–40%), closing most nonessential businesses: 29% (8%–47%), closing schools and universities: 41% (23%–56%), and issuing stay-at-home orders (with exemptions): 10% (−2%–22%). Note that we cannot robustly disentangle the individual effects of closing schools and closing universities since the implementation dates of these NPIs coincided nearly perfectly in all countries except Iceland and Sweden (Appendix D.2.1). We thus show the joint effect of closing both schools and universities, and treat “schools and universities closed” as one single NPI going forward.
Some NPIs frequently co-occurred, i.e., were partly collinear. However, we are able to isolate the effects of individual NPIs since the collinearity is imperfect and our dataset is large. For every pair of NPIs, we observe one of them without the other for 748 country-days on average (Appendix D.2.2). The minimum number of country-days for any NPI pair is 143 (for limiting gatherings to 1000 or 100 attendees). Additionally, under excessive collinearity, and insufficient data to overcome it, individual effectiveness estimates are highly sensitive to variations in the data and model parameters^22^. High sensitivity prevented Flaxman et al.^1^, who had a smaller dataset, from disentangling NPI effects^9^. Our estimates are substantially less sensitive (see next section). Finally, the posterior correlations between the effectiveness estimates are weak, suggesting manageable collinearity (Appendix D.2.3).
Although the correlations between the individual estimates are weak, we should take them into account when evaluating combined NPI effects. For example, if two NPIs frequently co-occurred, there may be more certainty about the combined effect than about the two individual effects. Figure 4 shows the combined effectiveness of the sets of NPIs that are most common in our data. Together, our set of NPIs reduced R by 77% (74%–79%) on average. Across countries, the mean R without any NPIs (i.e. the R0) was 3.3 (Table D.5 reports R0 for all countries). Starting from this number, the estimated R likely could have been reduced below 1 by closing schools and universities, high-risk businesses, and limiting gathering sizes. Readers can interactively explore the effects of sets of NPIs at http://epidemicforecasting.org/calc. A CSV file containing the joint effectiveness of all NPI combinations is available online here.
Combined NPI effectiveness for the most common sets of NPIs in our data, by size of the NPI set. Shaded regions denote 50% and 95% credible intervals. Left: Maximum R0 that could be reduced to below 1 for each set of NPIs. Right: Predicted R after implementation of each set of NPIs, assuming R0 = 3.8. Readers can interactively explore the effects of all sets of NPIs at http://epidemicforecasting.org/calc.
Sensitivity and validation
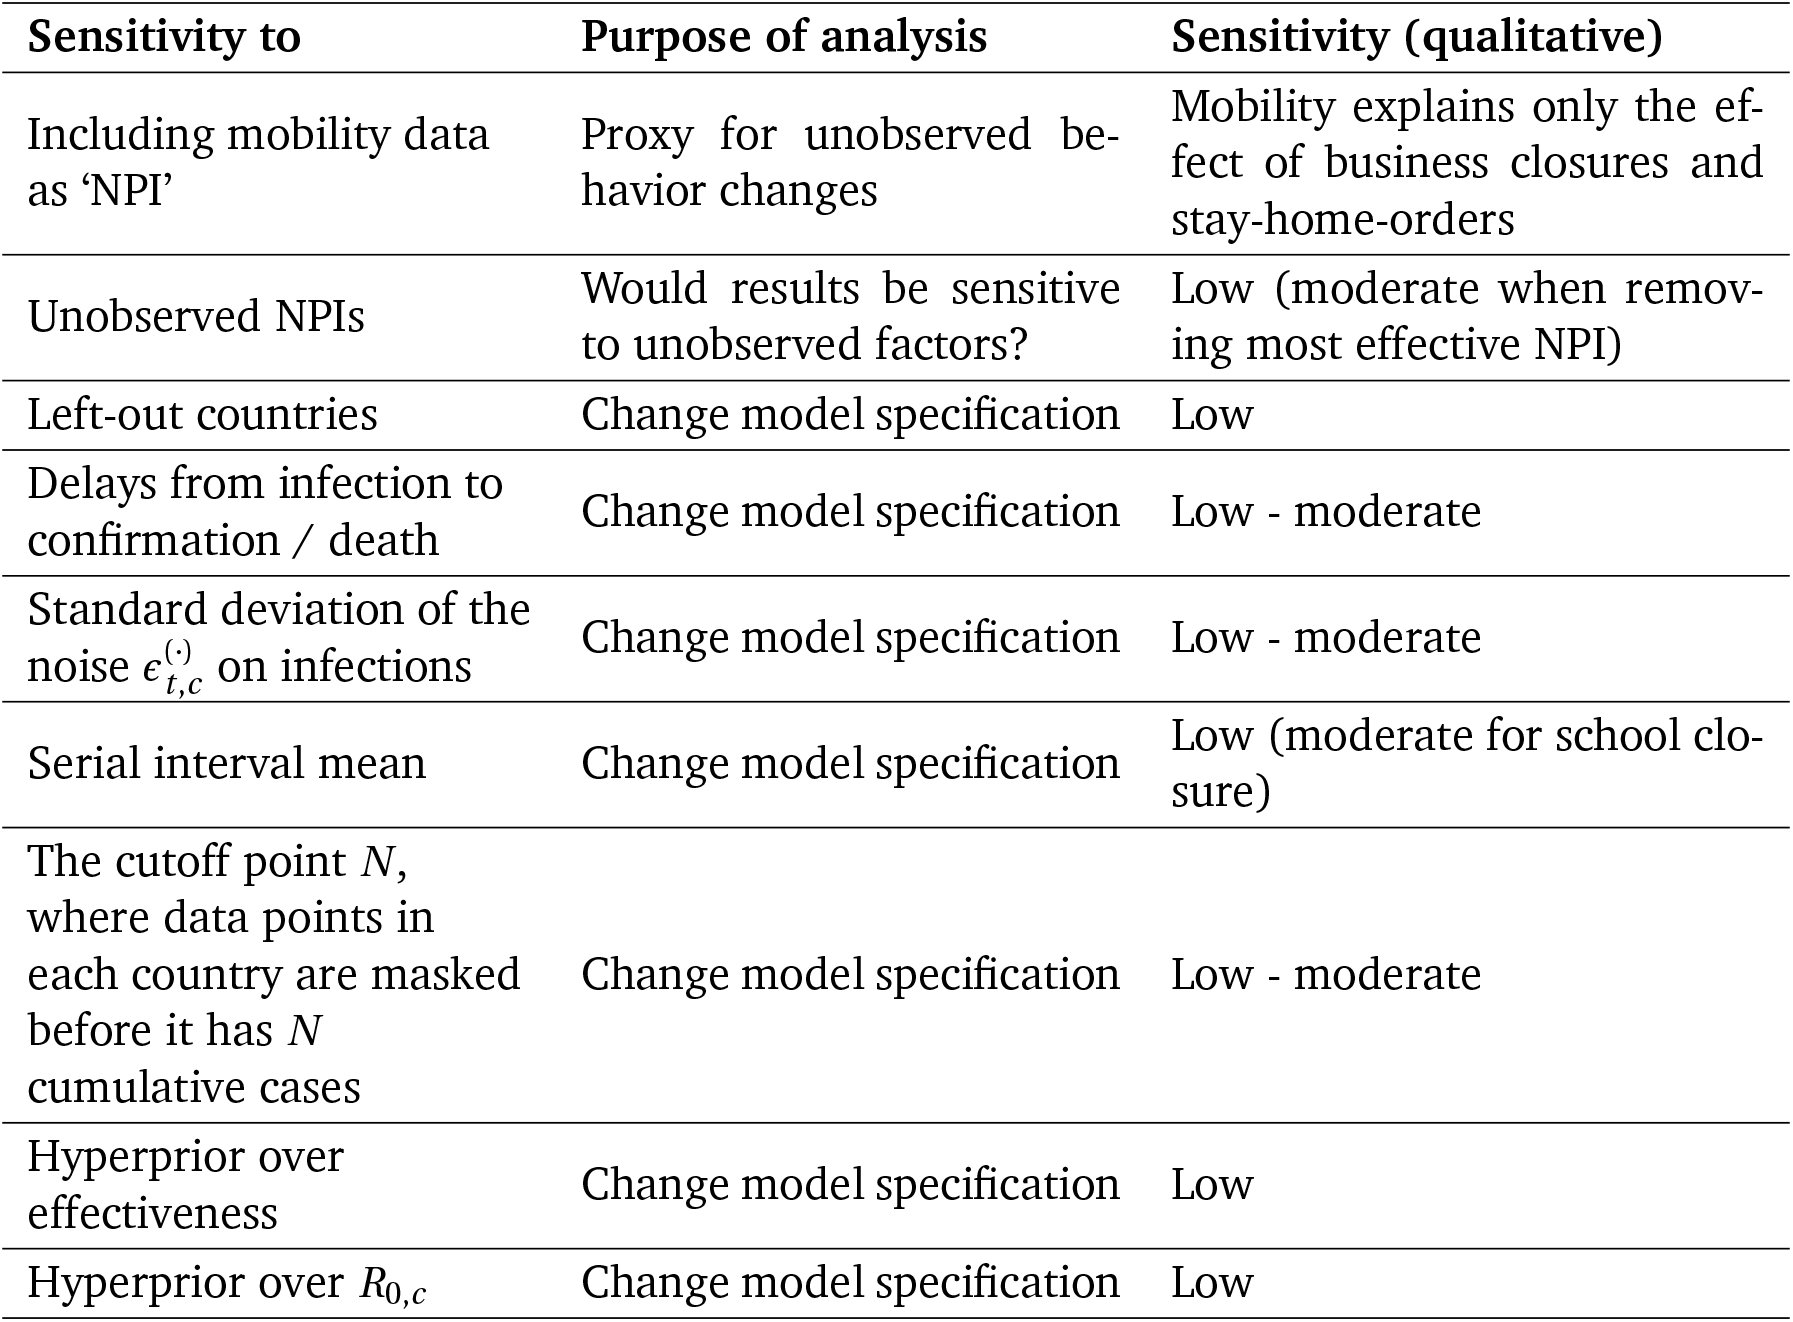
We perform a range of validation and sensitivity experiments (Appendix B, with further experiments in Appendix C). First, we analyse how the model extrapolates to unseen countries and find that it makes calibrated forecasts over periods of up to 2 months, with uncertainty increasing over time. Further, we perform multiple sensitivity analyses, studying how results change if we modify the priors over epidemiological parameters, exclude countries from the dataset, use only deaths or confirmed cases as observations, vary the data preprocessing, and more. Finally, we investigate our key assumptions by showing results for several alternative models (structural sensitivity^10^) and examine possible confounding of our estimates by unobserved factors influencing R. In total, we consider 201 alternative experimental conditions.
Figure 5 (left) shows the median NPI effectiveness across these 201 experimental conditions. Compared to the results under our default settings (Figures 3 and 4), median NPI effects vary under alternative plausible experimental conditions. However, the trends in the results are robust, and some NPIs outperform others under all tested conditions. While we test over large ranges of plausible values, our experiments do not include every possible source of uncertainty and the results might change more substantially under experimental conditions we have not tested.
Median NPI effects across the sensitivity analyses. Left: Median NPI effects (reduction in R) when varying different components of the model or the data in 201 experimental conditions. Results are displayed as violin plots, using kernel density estimation to create the distributions. Inside the violins, the box plots show median and interquartile-range. The vertical lines mark 0%, 17.5%, and 35% (see text). Right: Categorised sensitivity analyses. Structural: Using only cases or only deaths as observations (2 experimental conditions; Figure B.12), varying the model structure (3 conditions; Figure B.13 left). Data: Leaving out one country at a time (41 conditions; Figure B.10), varying the threshold below which cases and deaths are masked (8 conditions; Figure C.17); sensitivity to correcting for undocumented cases and to country-level differences in case ascertainment (2 conditions; Figure B.11). Epidemiological priors: Jointly varying the means of the priors over the means of the generation interval, the infection-to-case-confirmation delay, and the infection-to-death delay (125 conditions; Figure C.15), varying the prior over R0 (4 conditions; Figure C.16 left), varying the prior over NPI effectiveness (2 conditions; Figure C.16 right). Unobserved factors: Excluding observed NPIs one at a time (9 conditions; Figure B.14 left), controlling for additional NPIs from a different dataset (5 conditions; Figure B.14 right).
We categorise NPI effects into small, moderate, and large, which we define as a median reduction in R of less than 17.5%, between 17.5% and 35%, and more than 35% (vertical lines in Figure 5). Six of the NPIs fall into a single category in a large fraction of experimental conditions: school and university closures are associated with a large effect in 99% of experimental conditions, limiting gatherings to 10 people or less in 94%. Closing most nonessential businesses has a moderate effect in 96% of conditions, limiting gatherings to 100 people or less in 97%. Making mask-wearing mandatory in (some) public spaces falls into the “small effect” category in 100% of experimental conditions, issuing stay-at-home orders (with exemptions) in 99%. Two NPIs fall less clearly into one category: Closing some (high-risk) businesses has a moderate effect in 86% of conditions, and limiting gatherings to 1000 people or less has a small effect in 79%. However, both NPIs have small-to-moderate effects in more than 99% of experimental conditions. The effect of limiting gatherings to 1000 people or less is the least stable across the sensitivity analyses, which may reflect its aforementioned partial collinearity with limiting gatherings to 100 people or less.
Aggregating all sensitivity analyses can hide sensitivity to specific assumptions. We display the median NPI effects in four categories of sensitivity analyses (Figure 5, right), and each individual sensitivity analysis is shown in the Appendix. The trends in the results are also stable within the categories.
Discussion
We use a data-driven approach to estimate the effects that eight nonpharmaceutical interventions had on COVID-19 transmission in 41 countries between January and the end of May 2020. We find that several NPIs were associated with a clear reduction in R, in line with the mounting evidence that NPIs can be effective at mitigating and suppressing outbreaks of COVID-19. Furthermore, our results suggest that some NPIs outperformed others. While the exact effectiveness estimates vary with modelling assumptions, the broad conclusions discussed below are largely robust across 201 experimental conditions in 11 sensitivity analyses.
Business closures and gathering bans both seem to have been effective at reducing COVID-19 transmission. Closing only high-risk businesses appears to have been only somewhat less effective than closing most nonessential businesses; the median reduction in R differs only by 9% (6%–12%; mean and 95% interval of median estimates across the experiments settings in Figure 5). Closing only high-risk businesses may thus have been the more promising policy option in some circumstances. Limiting gatherings to 10 people or less was more effective than limits up to 100 or 1000 people. This may reflect the fact that small gatherings are common.
As previously discussed, we estimate the average effect each NPI had in the contexts in which it was implemented. When countries introduced stay-at-home orders, they nearly always also banned gatherings and closed schools, universities, and some or most businesses, if they had not done so already (Figure 3, bottom left). Flaxman et al.^1^ and Hsiang et al.^3^ add the effect of these distinct NPIs to the effectiveness of stay-at-home orders, and accordingly find a large effect. In contrast, we account for these other NPIs separately and isolate the additional effect of ordering the population to stay at home (when large gatherings are banned and educational institutions and some businesses closed).^d^ In accordance with other studies that took this approach, we find a small effect^2,6^. A typical country could have reduced R to below 1 without a stay-at-home order (Figure 4), provided other NPIs were implemented.
Mandating mask-wearing in various public spaces had no clear effect, on average, in the countries we studied. This does not rule out mask-wearing mandates having a larger effect in other contexts. In our data, mask-wearing was only mandated when other NPIs had already reduced public interactions. When most transmission occurs in private spaces, wearing masks in public is expected to be less effective. This might explain why a larger effect was found in studies that included China and South Korea, where mask-wearing was introduced earlier^8,23^. While there is an emerging body of literature indicating that mask-wearing can be effective in reducing transmission, the bulk of evidence comes from healthcare settings^24^. In non-healthcare settings, risk compensation^25^ may play a larger role, potentially reducing effectiveness. While our results cast doubt on reports that mask-wearing is the main determinant shaping a country’s epidemic^23^, the policy still seems promising given all available evidence, due to its comparatively low economic and social costs. Its effectiveness may have increased as other NPIs have been lifted and public interactions have recommenced.
We find a large effect for school and university closures. This finding is remarkably robust across different model structures, variations in the data, and epidemiological assumptions (Figure 5). It remains robust when controlling for NPIs excluded from our study (Figure B.14). Our approach cannot distinguish direct and indirect effects, such as forcing parents to stay at home or causing broader behaviour changes by increasing public concern. Additionally, since school and university closures almost perfectly coincided in the countries we study, our approach cannot distinguish their individual effects (Appendix D.2.1). This limitation likely also holds for other observational studies which do not include data on university closures and estimate only the effect of school closures^1–3,5–8^. Previous evidence on school and university closures is mixed^1,6,26^. Early data suggest that children and young adults are equally susceptible to infection but have a notably lower observed incidence rate than older adults—whether this is due to school and university closures remains unknown^27–30^. Although infected young people are often asymptomatic, they appear to shed similar amounts of virus as older people^31,32^, and might therefore transmit the infection to higher-risk demographics unknowingly. As the role of children in transmission is still unclear^33^ while outbreaks detected in schools are rising^33–35^, this topic merits careful attention.
Our study has several limitations. First, NPI effectiveness may depend on the context of implementation, such as the presence of other NPIs and country-specific factors. Our estimates must be interpreted as the average effectiveness over the contexts in our dataset^10^, and expert judgement is required to adjust them to local circumstances. Second, R may have been reduced by unobserved NPIs or spontaneous behaviour changes. To investigate whether these reductions could be falsely attributed to the observed NPIs, we perform several additional analyses and find that our results are stable to a range of unobserved effects (Appendix B.3). However, this sensitivity check cannot provide certainty. Investigating the role of unobserved effects is an important topic to explore further. Third, our results cannot be used without qualification to predict the effect of lifting NPIs. For example, closing schools and universities seems to have greatly reduced transmission, but this does not mean that reopening them will cause infections to soar. Educational institutions can implement safety measures such as reduced class sizes as they reopen. Further work is needed to analyse the effects of reopenings; we hope that our collected data aids this effort. Fourth, while we included more NPIs than most previous work (Table F.7), several promising NPIs were excluded. For example, testing, tracing, and case isolation may be an important part of a cost-effective epidemic response^36^, but were not included because it is difficult to obtain comprehensive data. We discuss further limitations in Appendix E.
Although our work focuses on estimating the impact of NPIs on the reproduction number R, the ultimate goal of governments may be to reduce the incidence, prevalence, and excess mortality of COVID-19. Controlling R is essential, but the contribution of NPIs towards these goals may also be mediated by other factors such as their duration and timing^37^, periodicity and adherence^38,39^, and successful containment^40^. While each of these factors addresses transmission within individual countries, it can be crucial to additionally synchronise NPIs between countries since cases can be imported^41^.
In conclusion, as governments around the world seek to keep R below 1 while minimising the social and economic costs of their interventions, we hope that our results can inform policy decisions on which NPIs to implement in any potential further wave of infections. Additionally, our work may provide insight on which areas of public life are most in need of restructuring, so that they can continue despite the pandemic. However, our estimates should not be seen as the final word on NPI effectiveness, but rather as a contribution to a diverse body of evidence, alongside other retrospective studies, simulation studies, experimental trials, and clinical experience.
The reference list from the paper itself. Each links out to its DOI / PubMed record.
- 1Seth Flaxman et al. “Estimating the effects of non-pharmaceutical interventions on COVID-19 in Europe”. In: Nature (2020), pp. 1–8.
- 2Jonas Dehning et al. “Inferring change points in the spread of COVID-19 reveals the effectiveness of interventions”. In: Science (2020).
- 3Solomon Hsiang et al. “The effect of large-scale anti-contagion policies on the COVID-19 pandemic”. In: Nature 584.7820 (2020), pp. 262–267.
- 4Shengjie Lai et al. “Effect of non-pharmaceutical interventions to contain COVID-19 in China”. en. In: Nature 585.7825 (Sept. 2020), pp. 410–413. doi: 10.1038/s 41586-020-2293-x. · doi ↗
- 5Yang Liu et al. “The impact of non-pharmaceutical interventions on SARS-Co V-2 trans-mission across 130 countries and territories”. In: med Rxiv (2020).
- 6Nicolas Banholzer et al. “Impact of non-pharmaceutical interventions on documented cases of COVID-19”. In: COVID-19 SARS-Co V-2 preprints from med Rxiv and bio Rxiv (Apr. 2020). DOI: 10.1101/2020.04.16.20062141. URL: https://www.medrxiv.org/content/10.1101/2020.04.16.20062141 v 3. · doi ↗
- 7Nazrul Islam et al. “Physical distancing interventions and incidence of coronavirus disease 2019: natural experiment in 149 countries”. In: bmj 370 (2020).
- 8Xiaohui Chen and Ziyi Qiu. “Scenario analysis of non-pharmaceutical interventions on global COVID-19 transmissions”. In: Covid Economics 7 (Apr. 2020), pp. 46–67.