variancePartition: Interpreting drivers of variation in complex gene expression studies
Gabriel E. Hoffman, Eric E. Schadt

TL;DR
This paper introduces a new tool called variancePartition to help scientists understand what factors most influence gene expression in complex studies.
Contribution
The novel contribution is a statistical framework and visualization tool for prioritizing sources of variation in gene expression data.
Findings
VariancePartition provides genome-wide summaries of variation drivers in gene expression studies.
It identifies genes that deviate from overall trends in variation.
The tool is broadly applicable to various genomics assays.
Abstract
As genomics studies become more complex and consider multiple sources of biological and technical variation, characterizing these drivers of variation becomes essential to understanding disease biology and regulatory genetics. We describe a statistical and visualization framework, variancePartition, to prioritize drivers of variation with a genome-wide summary, and identify genes that deviate from the genome-wide trend. variancePartition enables rapid interpretation of complex gene expression studies and is applicable to many genomics assays.
Click any figure to enlarge with its caption.
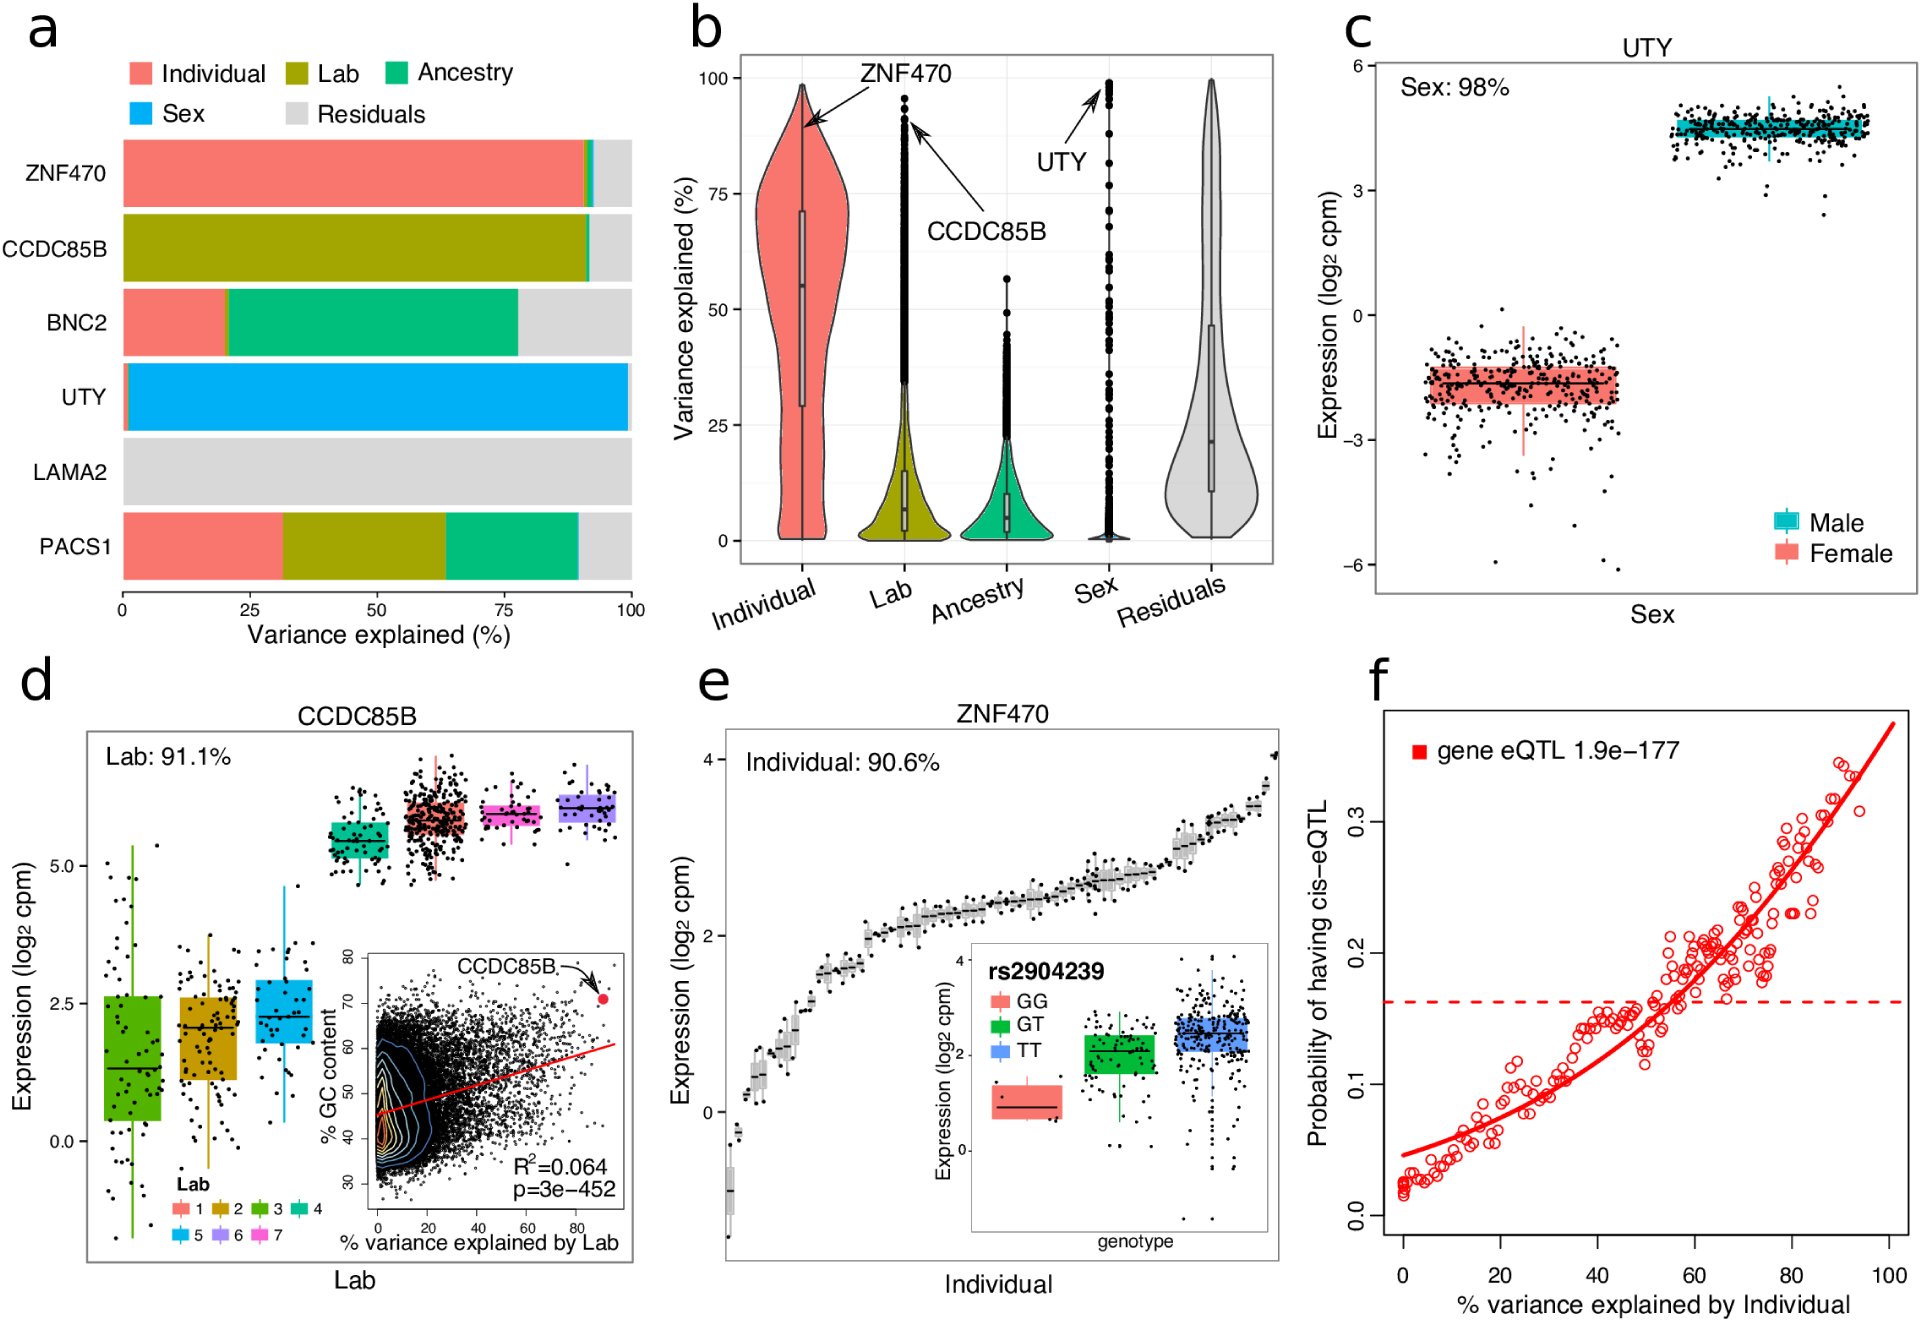 Figure 1
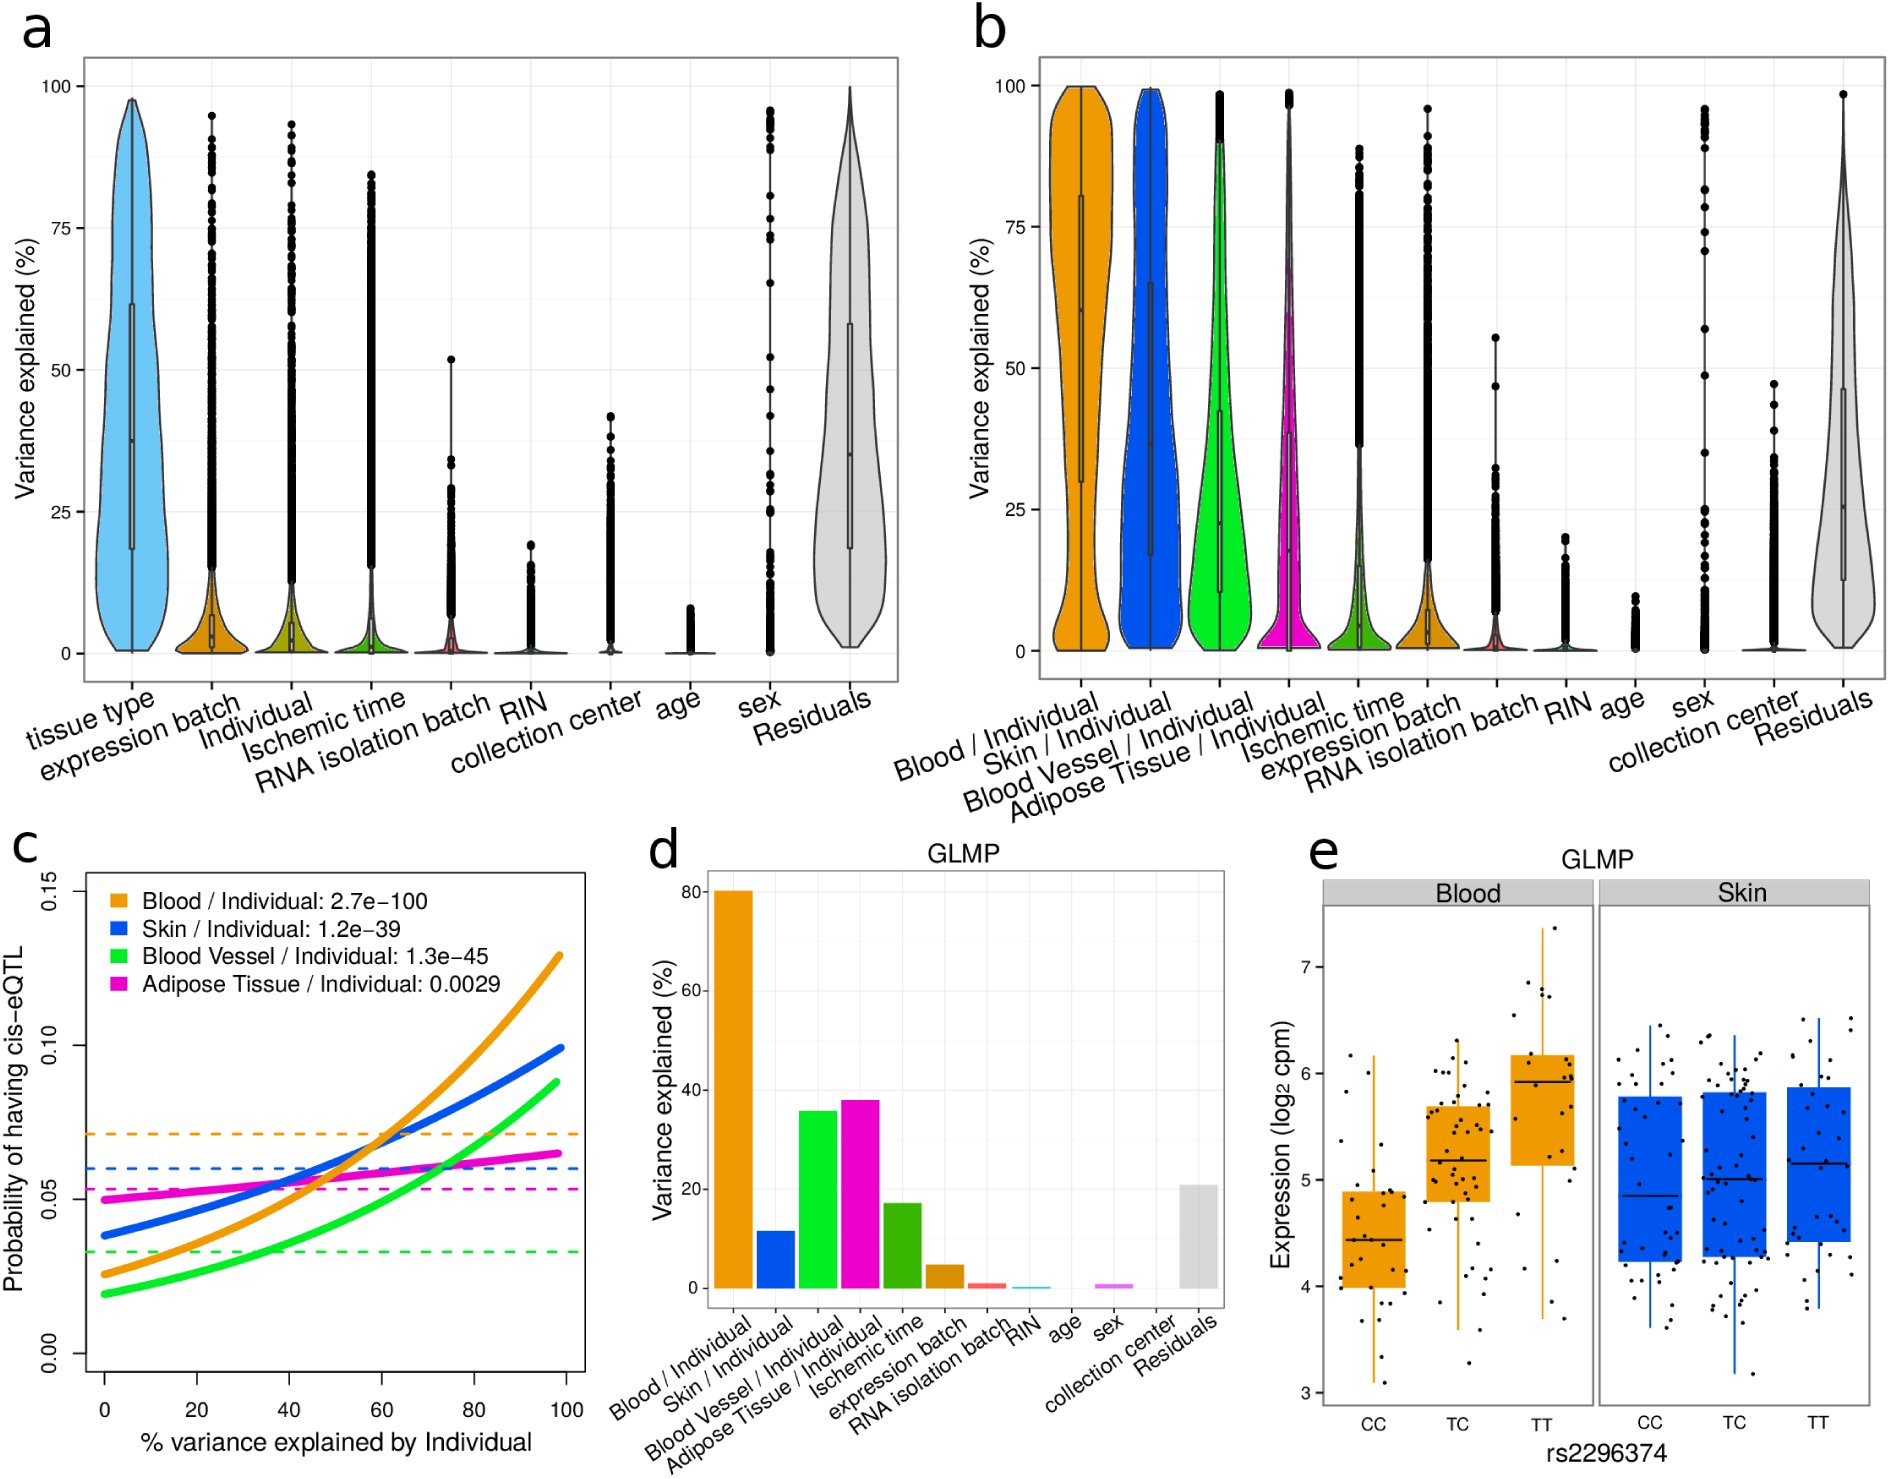 Figure 2








Peer Reviews
No public reviews on file for this paper yet. If you reviewed it on a platform where reviews are public (OpenReview, ICLR, NeurIPS, ICML), you can paste yours below so the community can read it here.
Videos
No videos yet. Explain this paper in a talk, walkthrough, or lecture? Add one.
Taxonomy
TopicsGene expression and cancer classification · Genetic Associations and Epidemiology · Genetic and phenotypic traits in livestock
High-throughput genomics assays have revolutionized our understanding of the molecular etiology of human disease, molecular biology of cell lineage and genetic regulation of gene expression. Transcriptome profiling in particular has been widely applied to detect variation in transcript levels attributable to differences in disease state, cell type or regulatory genetics. As transcriptome profiling studies have expanded in size and scope, they have grown increasing complex and consider multiple sources of biological and technical variation. Recent studies have simultaneously considered multiple dimensions of variation to understand the impact of cell type^1^, tissue type^2^, brain region^3^, experimental stimuli^4^, time duration following stimulus^5^ or ancestry^1,4,6^ on the genetic regulation of gene expression. More studies are including a disease axis, for example to characterize the role of regulatory genetics on late onset A lzheimer’s disease in multiple brain regions^7^.
The fundamental challenge in the analysis of complex datasets is to quantify and interpret the contribution of multiple sources of variation. Indeed the most pressing questions concern the relationship between these sources of variation. How does cell or tissue type effect the genetic regulation of gene expression, and does it vary by ancestry^1,2^? What is the relative contribution of experimental stimulus versus regulatory genetics to variation in gene expression^5^? Is technical variability of RNA-Seq low enough to study regulatory genetics and disease biology, and what are the major drivers of this technical variability^2,8,9^? A rich understanding of complex datasets requires answering these questions with both a genome-wide summary and gene-level resolution.
Recently, statistical methods that decompose variation in gene expression into the variance attributable to multiple variables in the experimental design have yielded valuable insight into the biological and technical components driving expression variation^8,10–12^. Yet statistical limitations of previous methods and the lack of a convenient and scalable implementation for analysis and visualization have prevented wider application of this analysis framework.
In order to improve interpretation of these complex datasets, we have developed a statistical and visualization framework, variancePartition. variancePartition leverages the power of the linear mixed model^13^ to jointly quantify the contribution of multiple sources of variation in high-throughput genomics studies. In applications to transcriptome profiling, variance Partition fits a linear mixed model for each gene and partitions the total variance into the fraction attributable to each aspect of the study design, plus the residual variation. Because it is built on the first principles of the linear mixed model, variancePartition has well characterized theoretical properties and accurately estimates the variance fractions even for complex experimental designs where the standard ANOVA method is inadequate (Supplementary Note). Moreover, variancePartition gives strong interpretations about the drivers of expression variation, and we demonstrate that these findings are reproducible across multiple datasets.
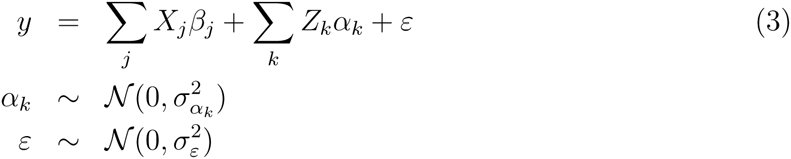
As an example we consider the 660 RNA-Seq experiments from the GEUVADIS study^6,8^ of lymphoblastoid cell lines from 462 individuals of 5 ancestries and 2 sexes sequenced across 7 laboratories. For a single gene, the total variation can be partitioned into the contributions of these components of variance plus residual variance: [eqn]
The contribution of each driver of variation can be interpreted based on the fraction of total variation it explains. Thus the fraction of variance due to variation across individuals is [eqn] and the fractions from all components of variation sum to 1.
Because these statistics are simple to describe, the variancePartition framework can give particular insight into how each of these dimensions of variation drive transcriptional variability. A typical variancePartition analysis comprises 1) fitting a linear mixed model to quantify the contribution of each dimension of variation to each gene, 2) visualizing the results, and 3) integrating additional data about each gene to interpret drivers of this variation. Here we apply variancePartition to four gene expression studies to demonstrate how the method facilitates interpretation of drivers of expression variation in complex study designs with multiple dimensions of variation. While these datasets are already well-characterized, we illustrate how variancePartition enables rapid interpretation of complex datasets.
Applying variancePartitition to the GEUVADIS^6,8^ dataset illustrates how the method can decouple biological and technical variation, and further decompose biological variation into multiple components. Expression variation across individuals, ancestries and sexes is biological, variation across the labs where the samples were sequenced comprise technical artifacts, while the residual variation remains uncharacterized. Results from representative genes illustrate how variancePartition identifies genes where the majority of variation in expression is explained by a single variable such as individual or sex, while variation in other genes is driven by multiple variables (Figure 1a, Supplementary Table 1). Since the variance fractions sum to 1 for each gene, it is simple to compare results across genes and across sources of variation. Visualizing these results genome-wide illustrates that variation across individuals is the major source of expression variation and explains a median of 55.1% of variance genome-wide (Figure 1b). The median variance explained by laboratory (6.8%), ancestry (4.9%) and sex (0%) is substantially smaller. We note that the variance explained by individual increases to 63.8% when ancestry is removed from the analysis since ancestry is a biological property of each individual (Supplementary Figure 1, Supplementary Note).
Yet particular genes show substantial deviation from the genome-wide trend. This is particularly noticeable for sex, where of the 51 genes for which sex explains more that 10% variance 46 are on the X or Y chromosomes. For example, variation across sex explains 98% variance in UTY on the Y chromosome (Figure 1c). While differential expression measures the differences in mean expression between the sexes, variancePartition measures the variance within and between each sex. This analysis indicates that variation across sexes explains very little variation genome-wide, but has a strong effect on a small number of genes.
Integrating additional data with gene-level results from variancePartition can give a clear interpretation of the drivers of variation. For example, 91.1% of variation in CCDC85B is explained by variation across laboratory. This gene has a very high GC content of 70.9% and is consistent with the genome-wide pattern where the degree of variation across laboratories is positively correlated with GC content (Figure 1d). While technical variation in RNA-Seq is known to depend on GC content^8,9^, variancePartition gives a clear illustration of how the effect of technical artifacts varies substantially across genes. Moreover, this analysis can be used to identify other correlates underlying technical issues in expression variation.
In addition, variancePartition gives a strong interpretation to genes whose expression varies across individuals by relating the gene-level results to cis-regulatory variation. For example, the fact that 90.6% of variation in ZNF470 is explained by individual suggests that this variation is driven by genetics, and, in fact, ZNF470 has a cis-eQTL (Figure 1e). This observation is also seen genome-wide, as genes with a greater fraction of variation across individuals have a significantly higher probability of having a cis-eQTL detected in this study (Figure 1f). This analysis explicitly demonstrates how expression variation across individuals is driven by cis-regulatory variation.
Application of variancePartition to post mortem RNA-Seq data of multiple tissues tissues from the GTEx Consortium^2^ decouples the influence of multiple biological and technical drivers of expression variation. We analyzed 489 experiments from 103 individuals in 4 tissues (blood, blood vessel, skin and adipose tissue) in order to restict the analysis to tissues with RNA-Seq data for most individuals (Supplementary Table 2). Variation across tissues is the major source of variation (median 37.4%) while the technical variables expression batch (2.9%), ischemic time (1.2%), RNA isolation batch (0.4%), and RIN (0.2%) have a moderate effect on expression variation genome-wide (Figure 2a). Variation across expression batches is correlated with GC content but to a lesser degree that other datasets (Supplementary Figure 2). Cumulatively, these technical variables explain only 4.7% of the total expression variation. Concerns about reliability of RNA-Seq data from post mortem samples has been raised due to the potential effects of RNA degradation following cell death^14,15^. variancePartition analysis indicates that variation in ischemic time has as relatively small effect genome-wide and the fraction of variance it explains is comparable to other technical effects, yet the effect varies substantially across genes.
The flexibility of the linear mixed model framework allows variancePartition to analyze cross-individual variation within each tissue. Since the variance is analyzed within multiple subsets of the data, the total variation explained no longer sums to 1 as it does for standard application of variancePartition. Yet the results allow ranking of dimensions of variation based on genome-wide contribution to variance and enables analysis of gene-level results (Supplementary Note). While variation across individuals explains only a median of 2.3% of variation when all tissues types are considered together, there is substantial variation across individuals within each tissue separately (Figure 2b). Cross-individual variation is highest in blood (median 60.3%), while skin (36.5%), blood vessel (22.5%), and adipose tissue (17.7%) exhibit lower cross-individual variation. The fraction of variation explained by individual within each tissue is directly related to the probability of each gene having a cis-eQTL within the corresponding tissue (Figure 2c). This association is not as strong as in other datasets likely due to the smaller number of individuals and to the relatively small fraction of crossindividual variation in adipose tissue.
At the gene-level, varianceParition can prioritize genes based on multiple criteria. For examples, GLMP exhibits higher variation across individuals within blood but low variation in skin (Figure 2d). This is consistent of a tissue-specific regulatory variation, and, in fact, the cis-eQTL rs2296374 influences gene expression in blood but not in skin (Figure 2e).
The conclusions drawn here from variancePartition analysis are reproducible across multiple datasets, and we illustrate further applications to datasets from the ImmVar^1^ and SEQC projects^9^ (Supplementary Note, Supplementary Figures 3-4).
A variancePartition analysis produces a genome-wide summary but also reports gene-level results to identify genes that deviate from the genome-wide trend. The fraction of variation is an interpretable statistic which can easily be compared across genes, across drivers of variation and across datasets. Decomposing expression variation into its constituent parts facilitates prioritizing drivers of variation based on their contribution at both the genome-wide and gene-level. By comparing the influence of multiple drivers of variation, this analysis directly addresses questions about the extent to which biological signal or technical artifacts are driving variation in the data. Moreover, the fraction of variation is also interpretable in terms of intra-class correlation, a metric used to assess biological and technical reproducibility^13,16^(Supplementary Note).
Finally, variancePartition provides a general statistical and visualization framework applicable to studying drivers of variation in many types of high-throughput genomic assays including RNA-Seq (gene‐, exon‐ and isoform-level quantification, splicing efficiency), protein quantification, metabolite quantification, metagenomic assays, methylation arrays and epigenomic sequencing assays. Although we have focused here on large-scale studies, variancePartition analysis has given valuable insight into RNA-Seq datasets with as few as 20 samples. The variancePartition software is an open source R package and is freely available on Bioconductor. The software provides a user-friendly interface for analysis and visualization with extensive documentation, and will enable routine application to a range of genomics datasets.
The reference list from the paper itself. Each links out to its DOI / PubMed record.
- 1Raj, T., Rothamel, K., Mostafavi, S., Ye, C., Lee, M. N., Replogle, J. M., Feng, T., Asinovski, N., Frohlich, I., Imboywa, S., Von Korff, A., Okada, Y., Patsopoulos, N. A., Davis, S., Mc Cabe, C., Paik, H.-i., Srivastava, G. P., Raychaudhuri, S., Hafler, D. A., Koller, D., Regev, A., Hacohen, N., Mathis, D., Benoist, C., Stranger, B. E., and De Jager, P. L. Polarization of the effects of autoimmune and neurodegenerative risk alleles in leukocytes. Science 344(6183), 519–23 (2014).
- 2GT Ex Consortium. The Genotype-Tissue Expression (GT Ex) pilot analysis: M. ultitissue gene regulation in humans. 348(6235), 648–660 (2015).
- 3Ramasamy, A., Trabzuni, D., Guelfi, S., Varghese, V., Smith, C., Walker, R., De, T., Hardy, J., Ryten, M., Trabzuni, D., Guelfi, S., Weale, M. E., Ramasamy, A., Forabosco, P., Smith, C., Walker, R., Arepalli, S., Cookson, M. R., Dillman, A., Gibbs, J. R., Hernandez, D. G., Nalls, M. a., Singleton, A. B., Traynor, B., van der Brug, M., Ferrucci, L., Johnson, R., Zielke, R., Longo, D. L., Troncoso, J., Zonderman, A., Coin, L., de Silva, R., Cookson, M. R., Singleton, A. B., Hardy, J., Ryten, M., a
- 4Lee, M. N., Ye, C., Villani, A.-C., Raj, T., Li, W., Eisenhaure, T. M., Imboywa, S. H., Chipendo, P. I., Ran, F. A., Slowikowski, K., Ward, L. D., Raddassi, K., Mc Cabe, C., Lee, M. H., Frohlich, I. Y., Hafler, D. a., Kellis, M., Raychaudhuri, S., Zhang, F., Stranger, B. E., Benoist, C. O., De Jager, P. L., Regev, A., and Hacohen, N. Common genetic variants modulate pathogen-sensing responses in human dendritic cells. Science 343(6175), 1246980 (2014).
- 5Fairfax, B. P., Humburg, P., Makino, S., Naranbhai, V., Wong, D., Lau, E., Jostins, L., Plant, K., Andrews, R., Mc Gee, C., and Knight, J. C. Innate immune activity conditions the effect of regulatory variants upon monocyte gene expression. Science 343(6175), 1246949 (2014).
- 6Lappalainen, T., Sammeth, M., Friedländer, M. R., âĂŸt Hoen, P. A. C., Monlong, J., Rivas, M. A., Gonzàlez-Porta, M., Kurbatova, N., Griebel, T., Ferreira, P. G., Barann, M., Wieland, T., Greger, L., van Iterson, M., Almlöf, J., Ribeca, P., Pulyakhina, I., Esser, D., Giger, T., Tikhonov, A., Sultan, M., Bertier, G., Mac Arthur, D. G., Lek, M., Lizano, E., Buermans, H. P. J., Padioleau, I., Schwarzmayr, T., Karlberg, O., Ongen, H., Kilpinen, H., Beltran, S., Gut, M., Kahlem, K., Amstislavskiy, V.,
- 7Zhang, B., Gaiteri, C., Bodea, L.-G., Wang, Z., Mc Elwee, J., Podtelezhnikov, A. a., Zhang, C., Xie, T., Tran, L., Dobrin, R., Fluder, E., and Clurman, B. Integrated systems approach identifies genetic nodes and networks in late-onset Alzheimer’s disease. Cell 153(3), 707–20(2013).
- 8’t Hoen, P. a. C., Friedländer, M. R., Almlöf, J., Sammeth, M., Pulyakhina, I., Anvar, S. Y., Laros, J. F. J., Buermans, H. P. J., Karlberg, O., Brannväll, M., den Dunnen, J. T., van Ommen, G.-J. B., Gut, I. G., Guigó, R., Estivill, X., Syvänen, A.-C., Dermitzakis, E. T., and Lappalainen, T. Reproducibility of high-throughput m RNA and small RNA sequencing across laboratories. Nature Biotechnology 31(11), 1015–22 (2013).