Hilbert-Schmidt and Sobol sensitivity indices for static and time series Wnt signaling measurements in colorectal cancer - Part A
shriprakash sinha

TL;DR
This paper uses advanced computational methods to study the Wnt signaling pathway in colorectal cancer, revealing hidden biological insights.
Contribution
The study introduces a novel synergy of density-based sensitivity indices and higher-dimensional representations to analyze Wnt signaling.
Findings
Density-based indices outperform variance-based indices in capturing nonlinear relations in Wnt signaling.
Time series analysis reveals when and which factors influence the pathway in colorectal cancer.
Combining biological knowledge with computational methods uncovers hidden biological information.
Abstract
Ever since the accidental discovery of Wingless [Sharma R.P., Drosophila information service, 1973, 50, p 134], research in the field of Wnt signaling pathway has taken significant strides in wet lab experiments and various cancer clinical trials, augmented by recent developments in advanced computational modeling of the pathway. Information rich gene expression profiles reveal various aspects of the signaling pathway and help in studying different issues simultaneously. Hitherto, not many computational studies exist which incorporate the simultaneous study of these issues. This manuscript • explores the strength of contributing factors in the signaling pathway, • analyzes the existing causal relations among the inter/extracellular factors effecting the pathway based on prior biological knowledge and • investigates the deviations in fold changes in the recently found prevalence of…
Genes, proteins, chemicals, diseases, species, mutations and cell lines named across the full text — each resolved to its canonical identifier and authoritative record.
Click any figure to enlarge with its caption.
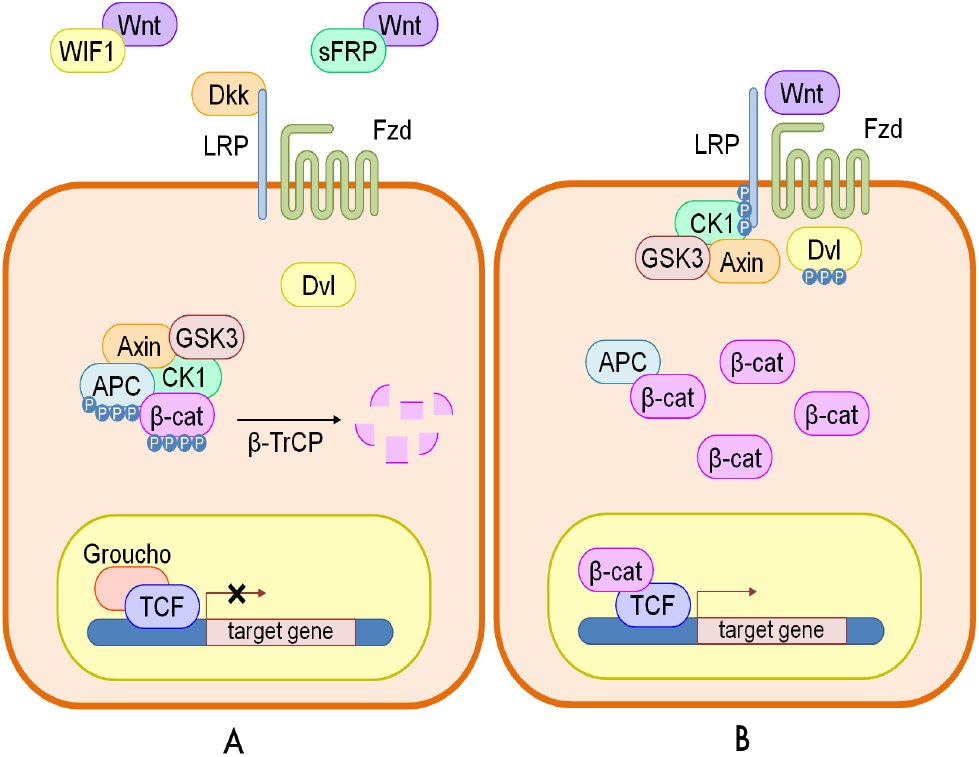 Fig. 1
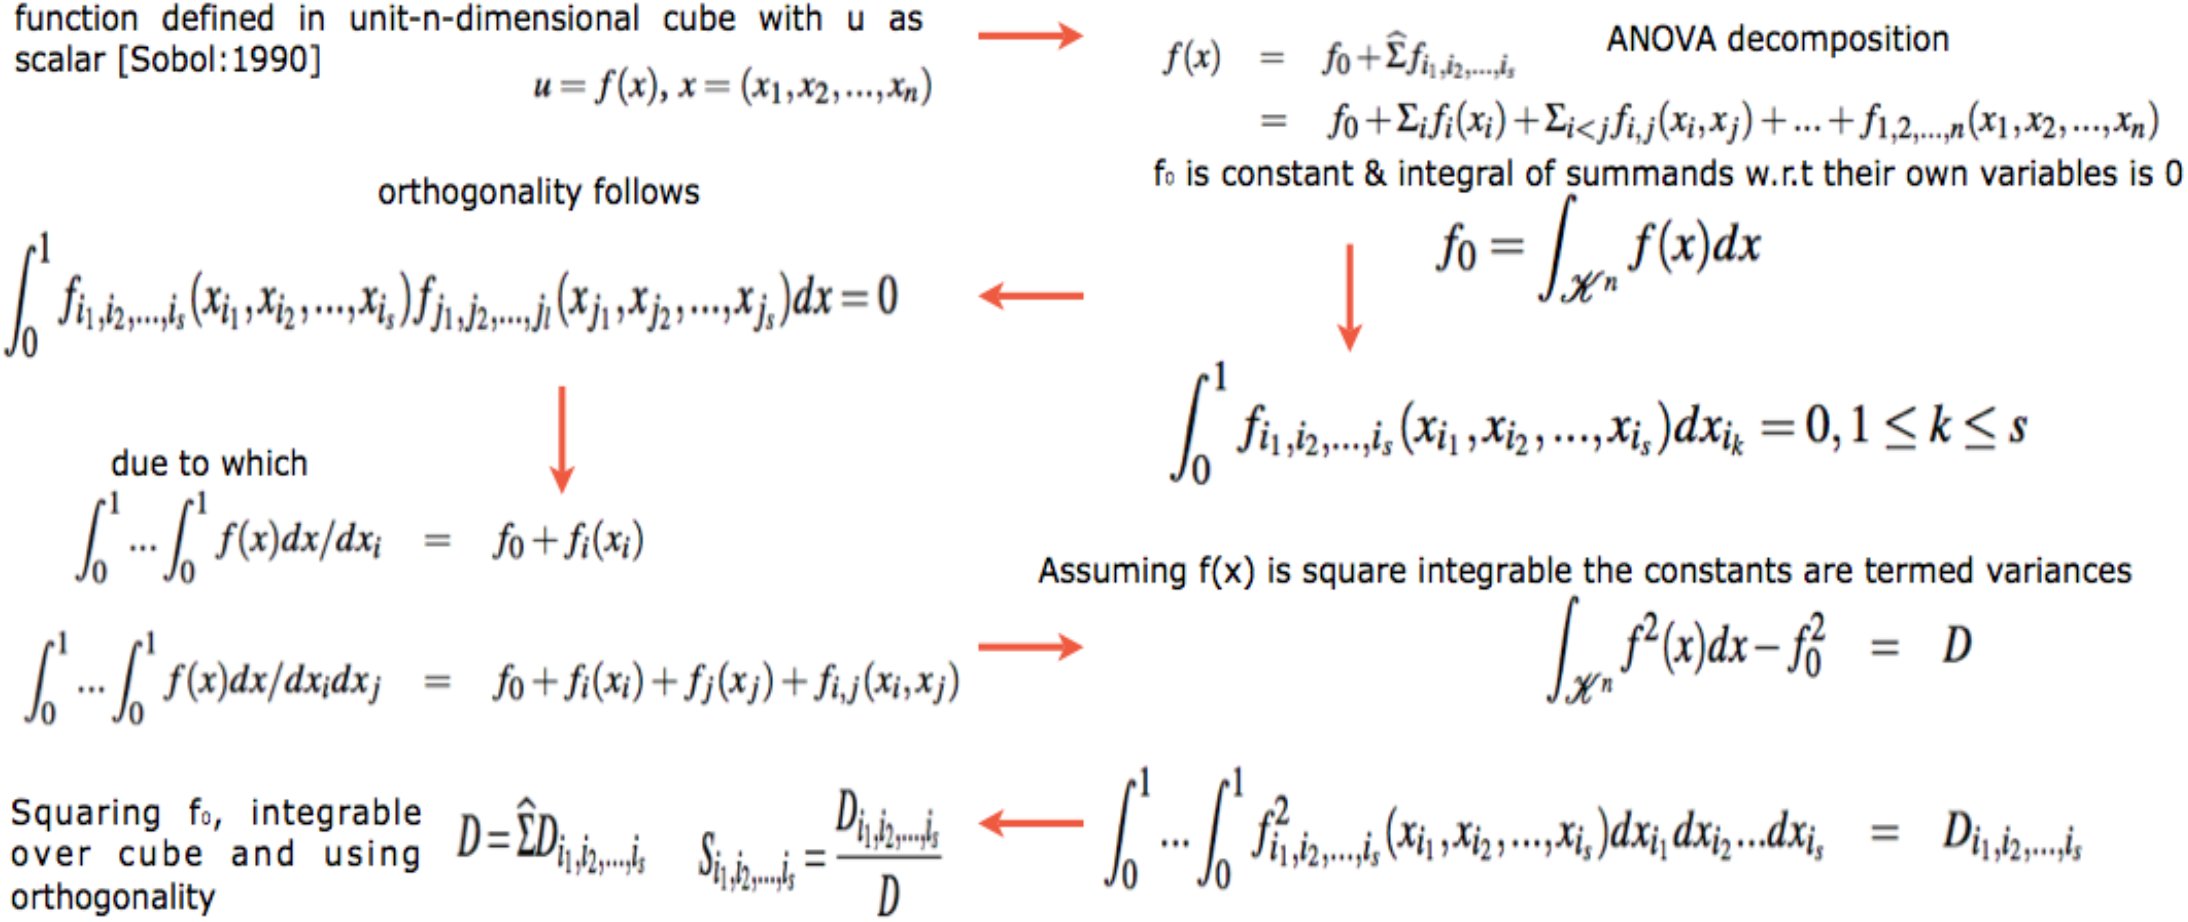 Fig. 2
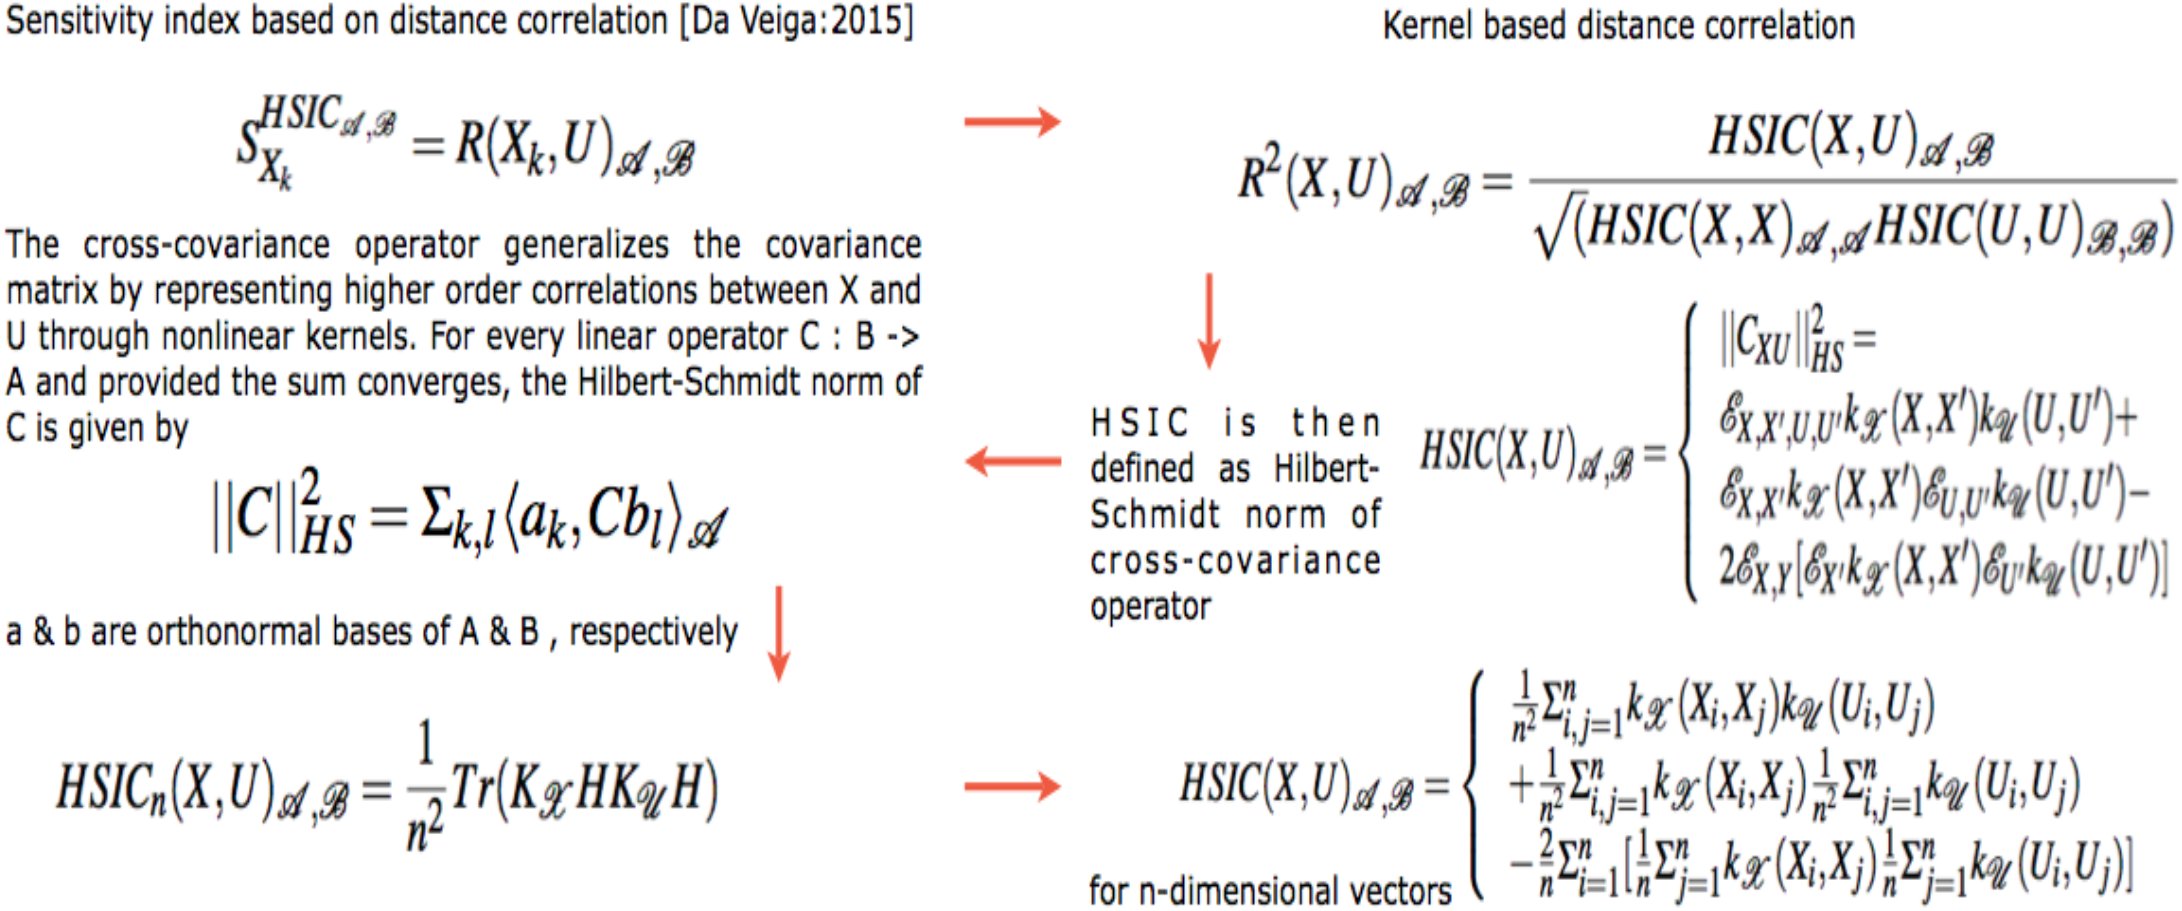 Fig. 3
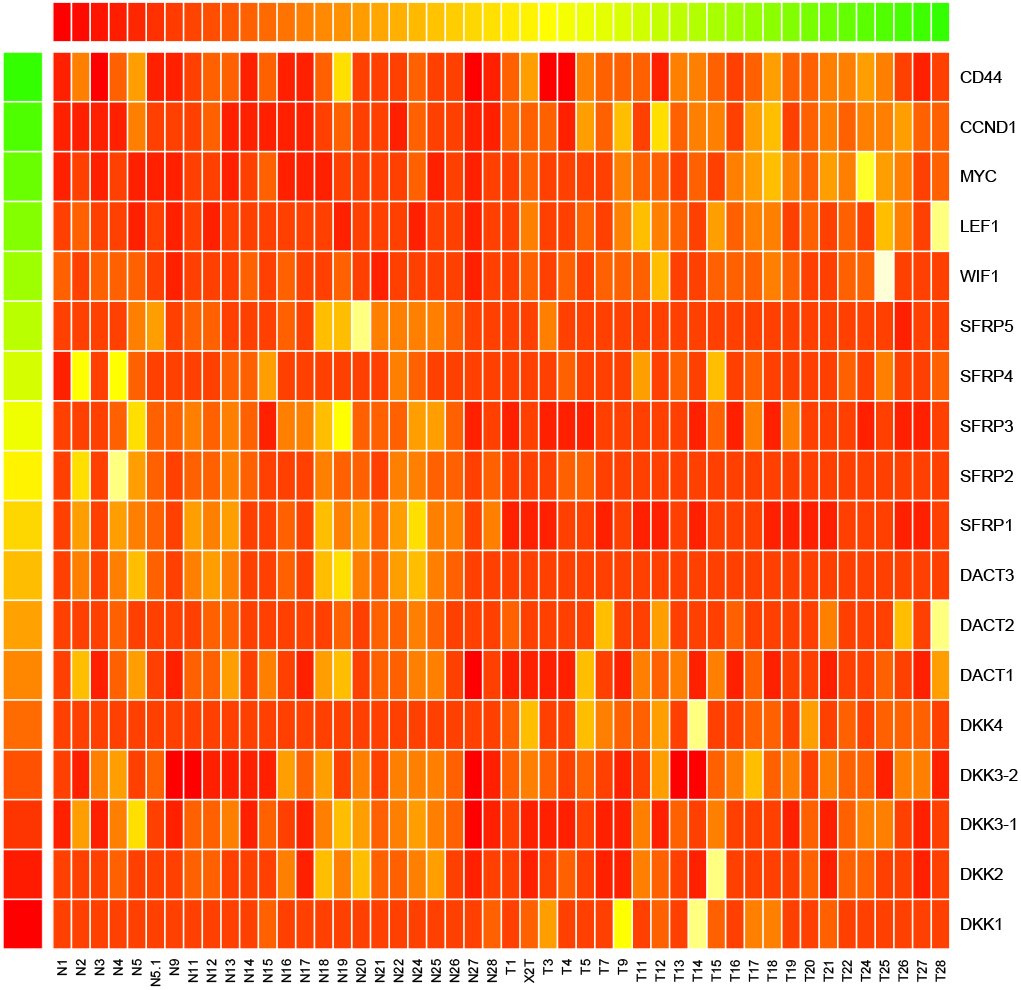 Fig. 4
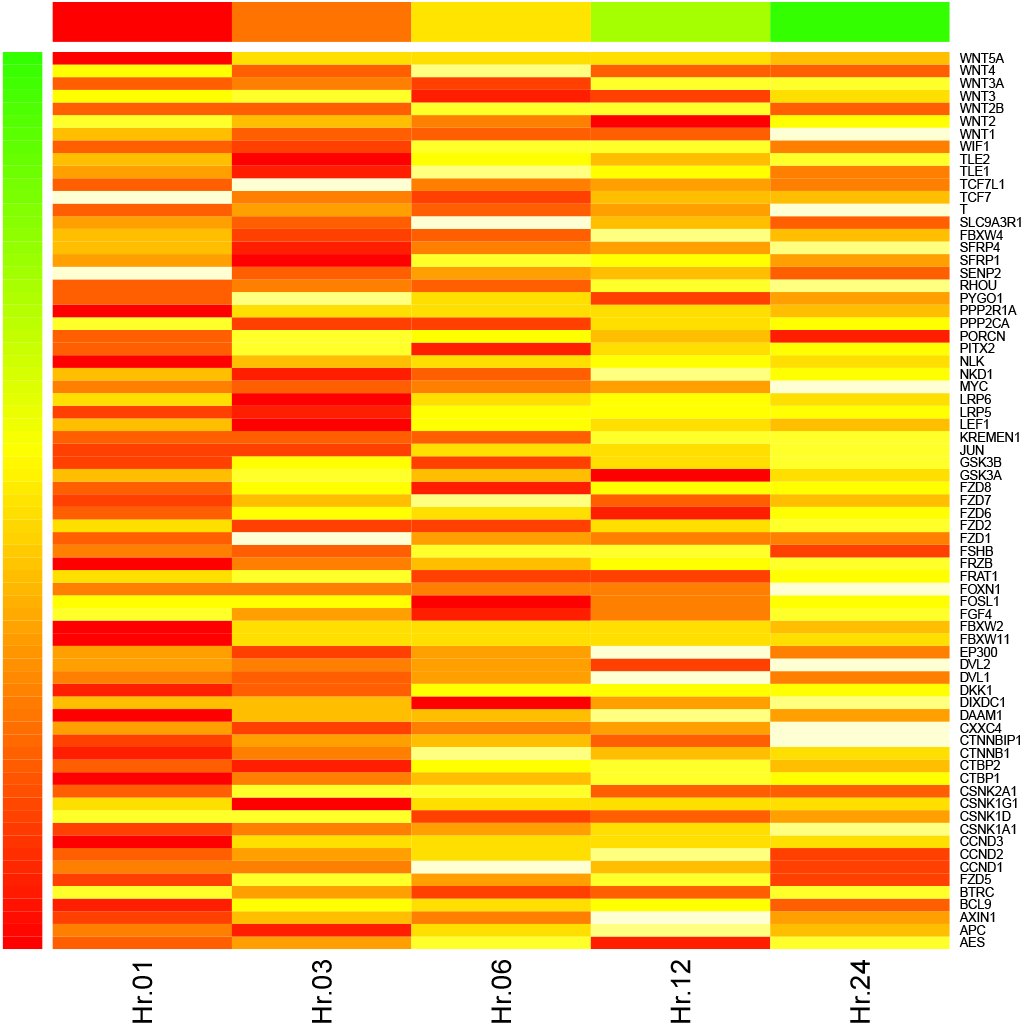 Fig. 5
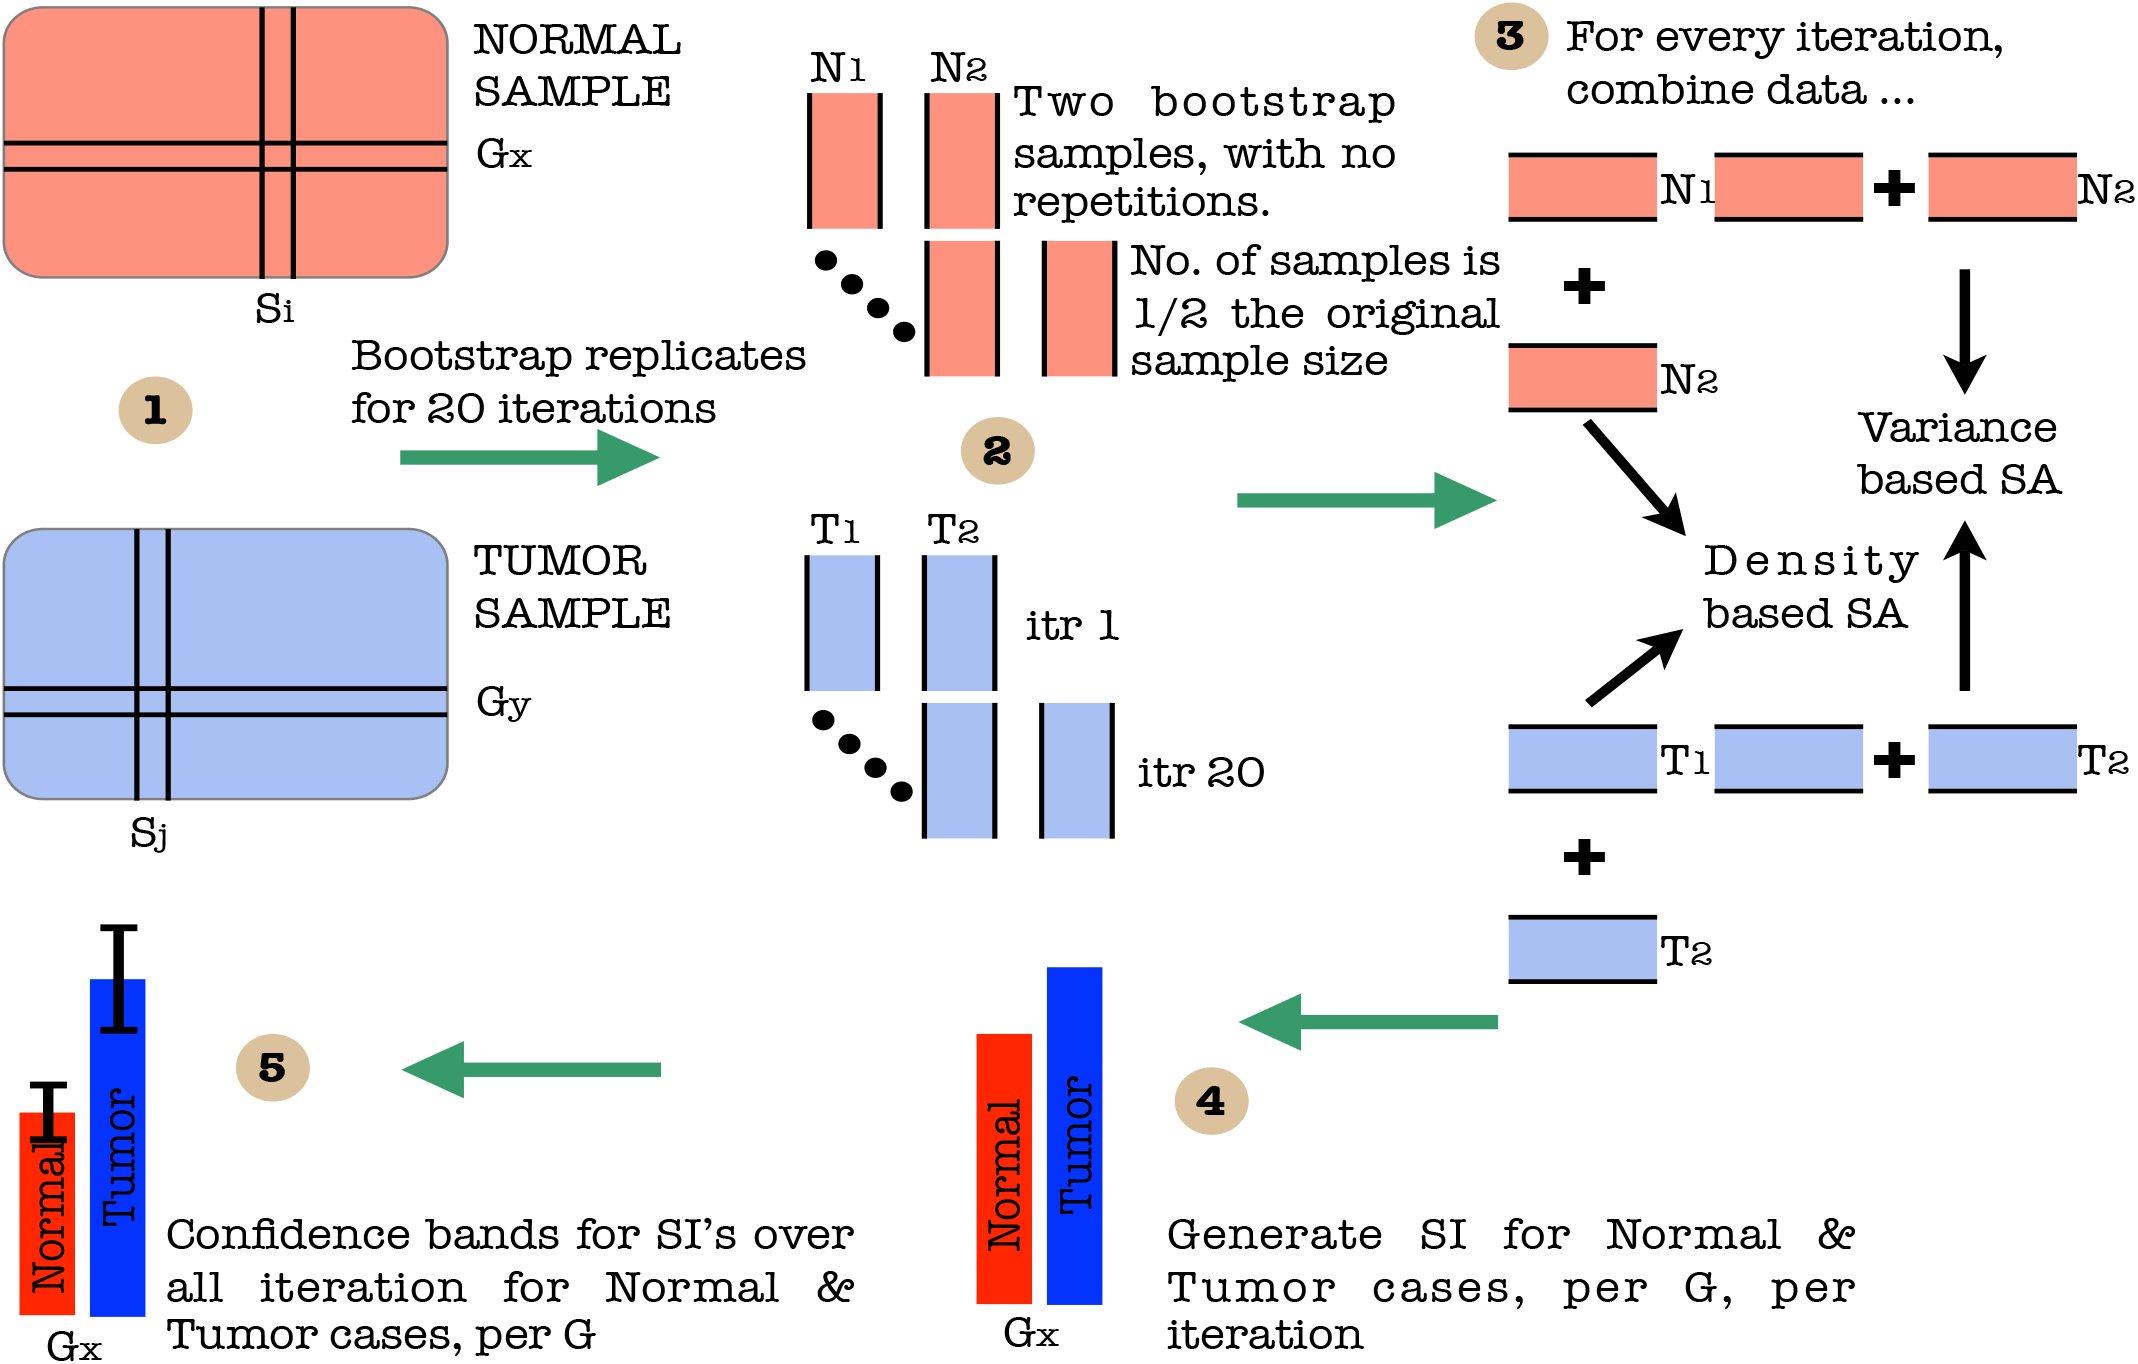 Fig. 6
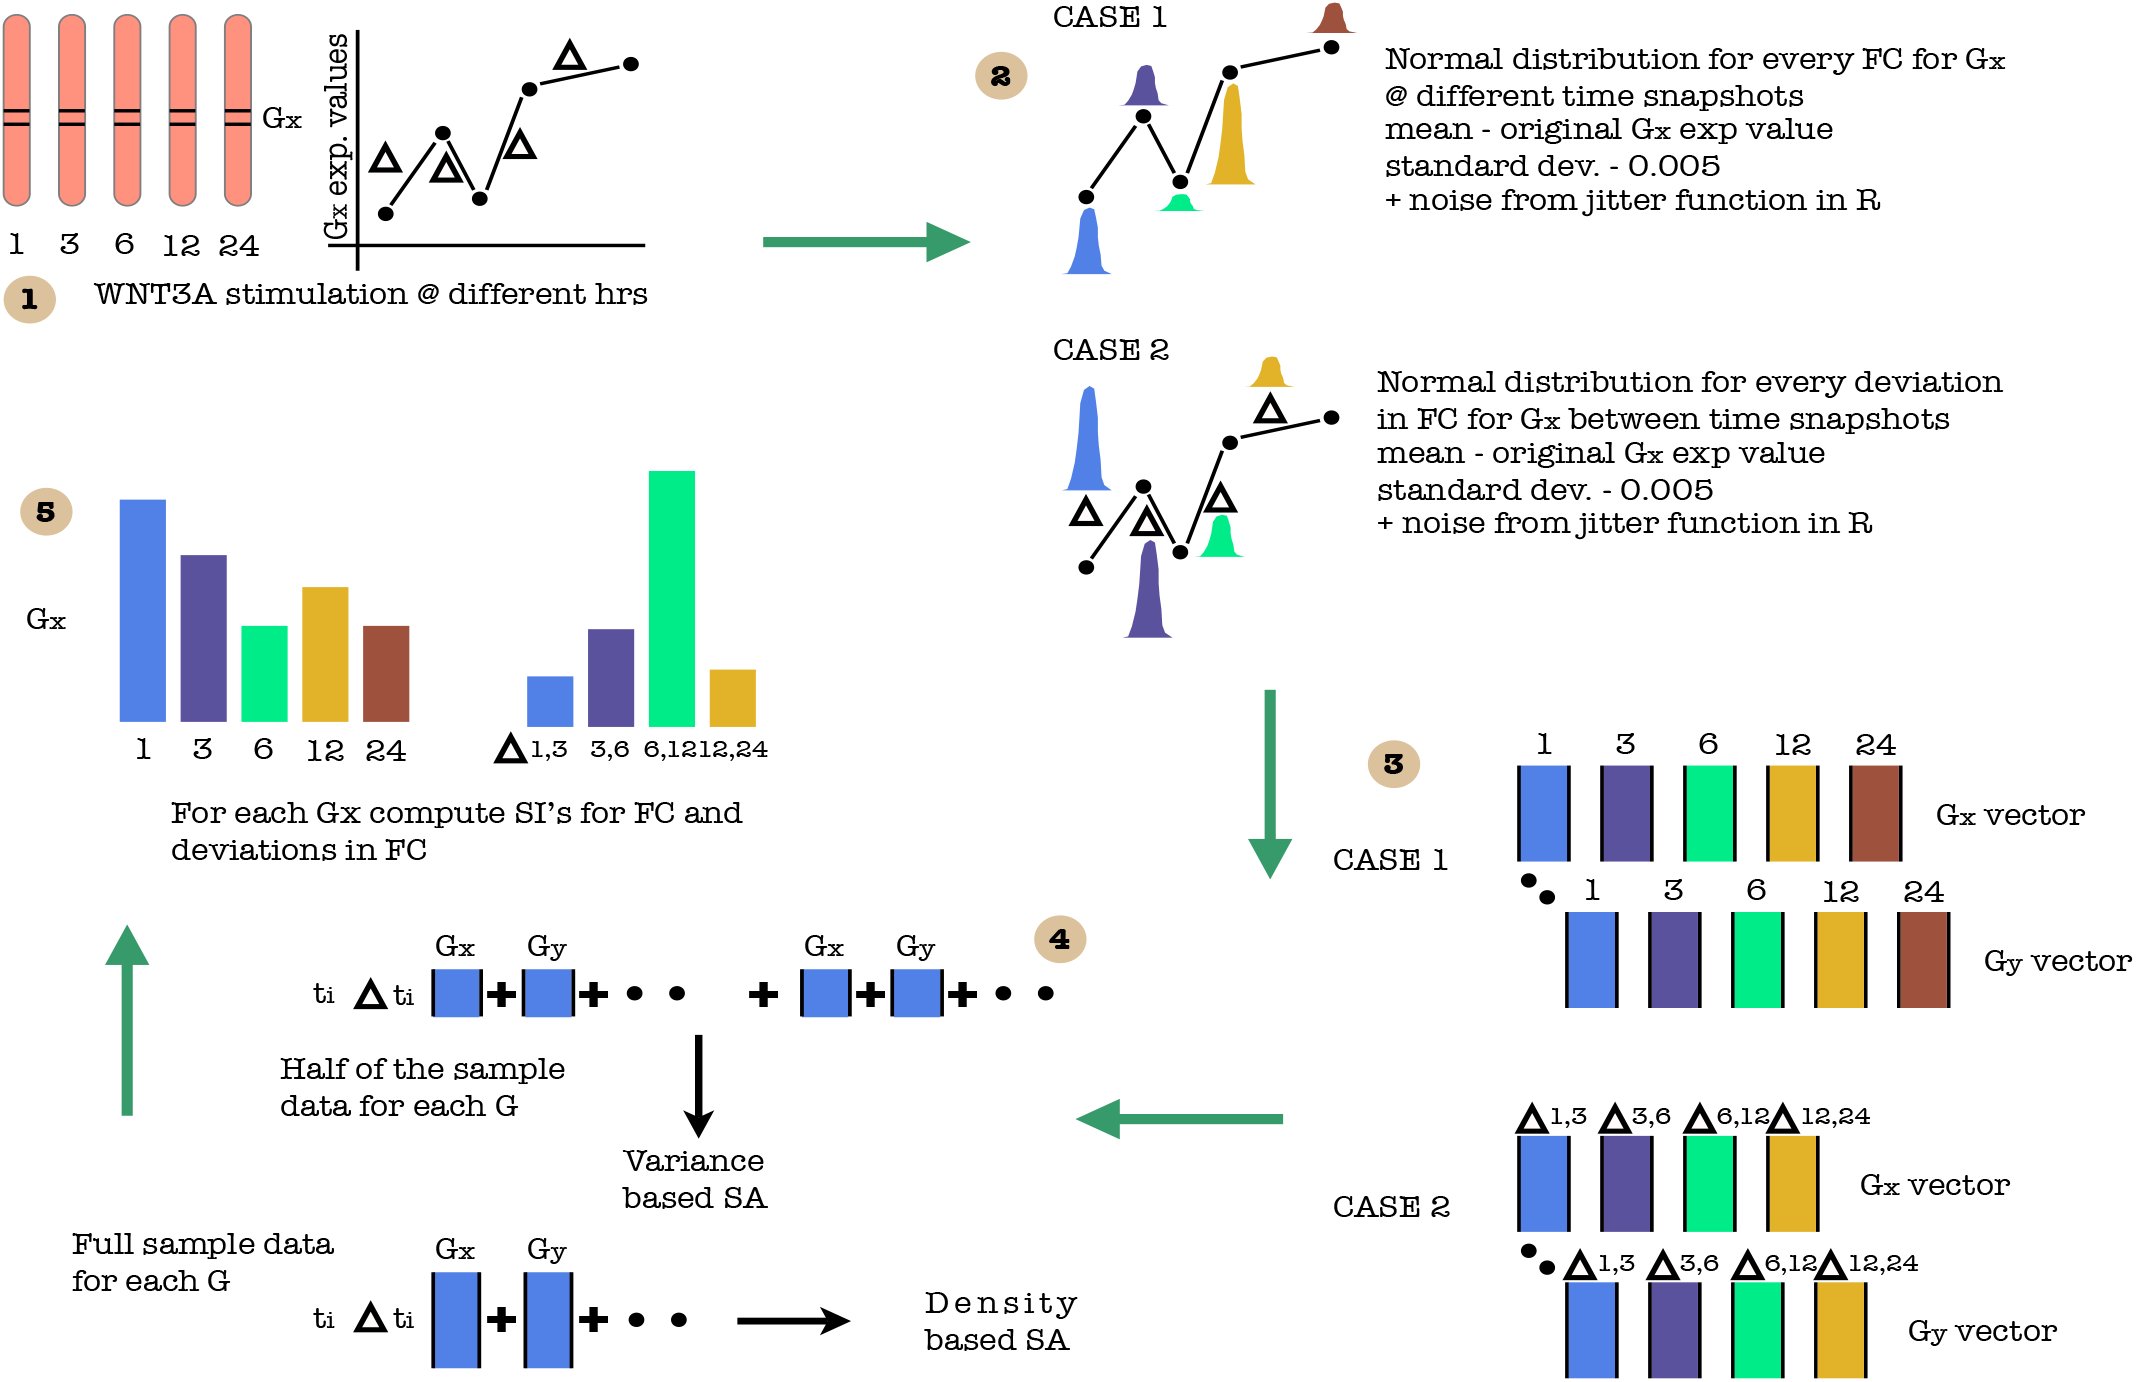 Fig. 7
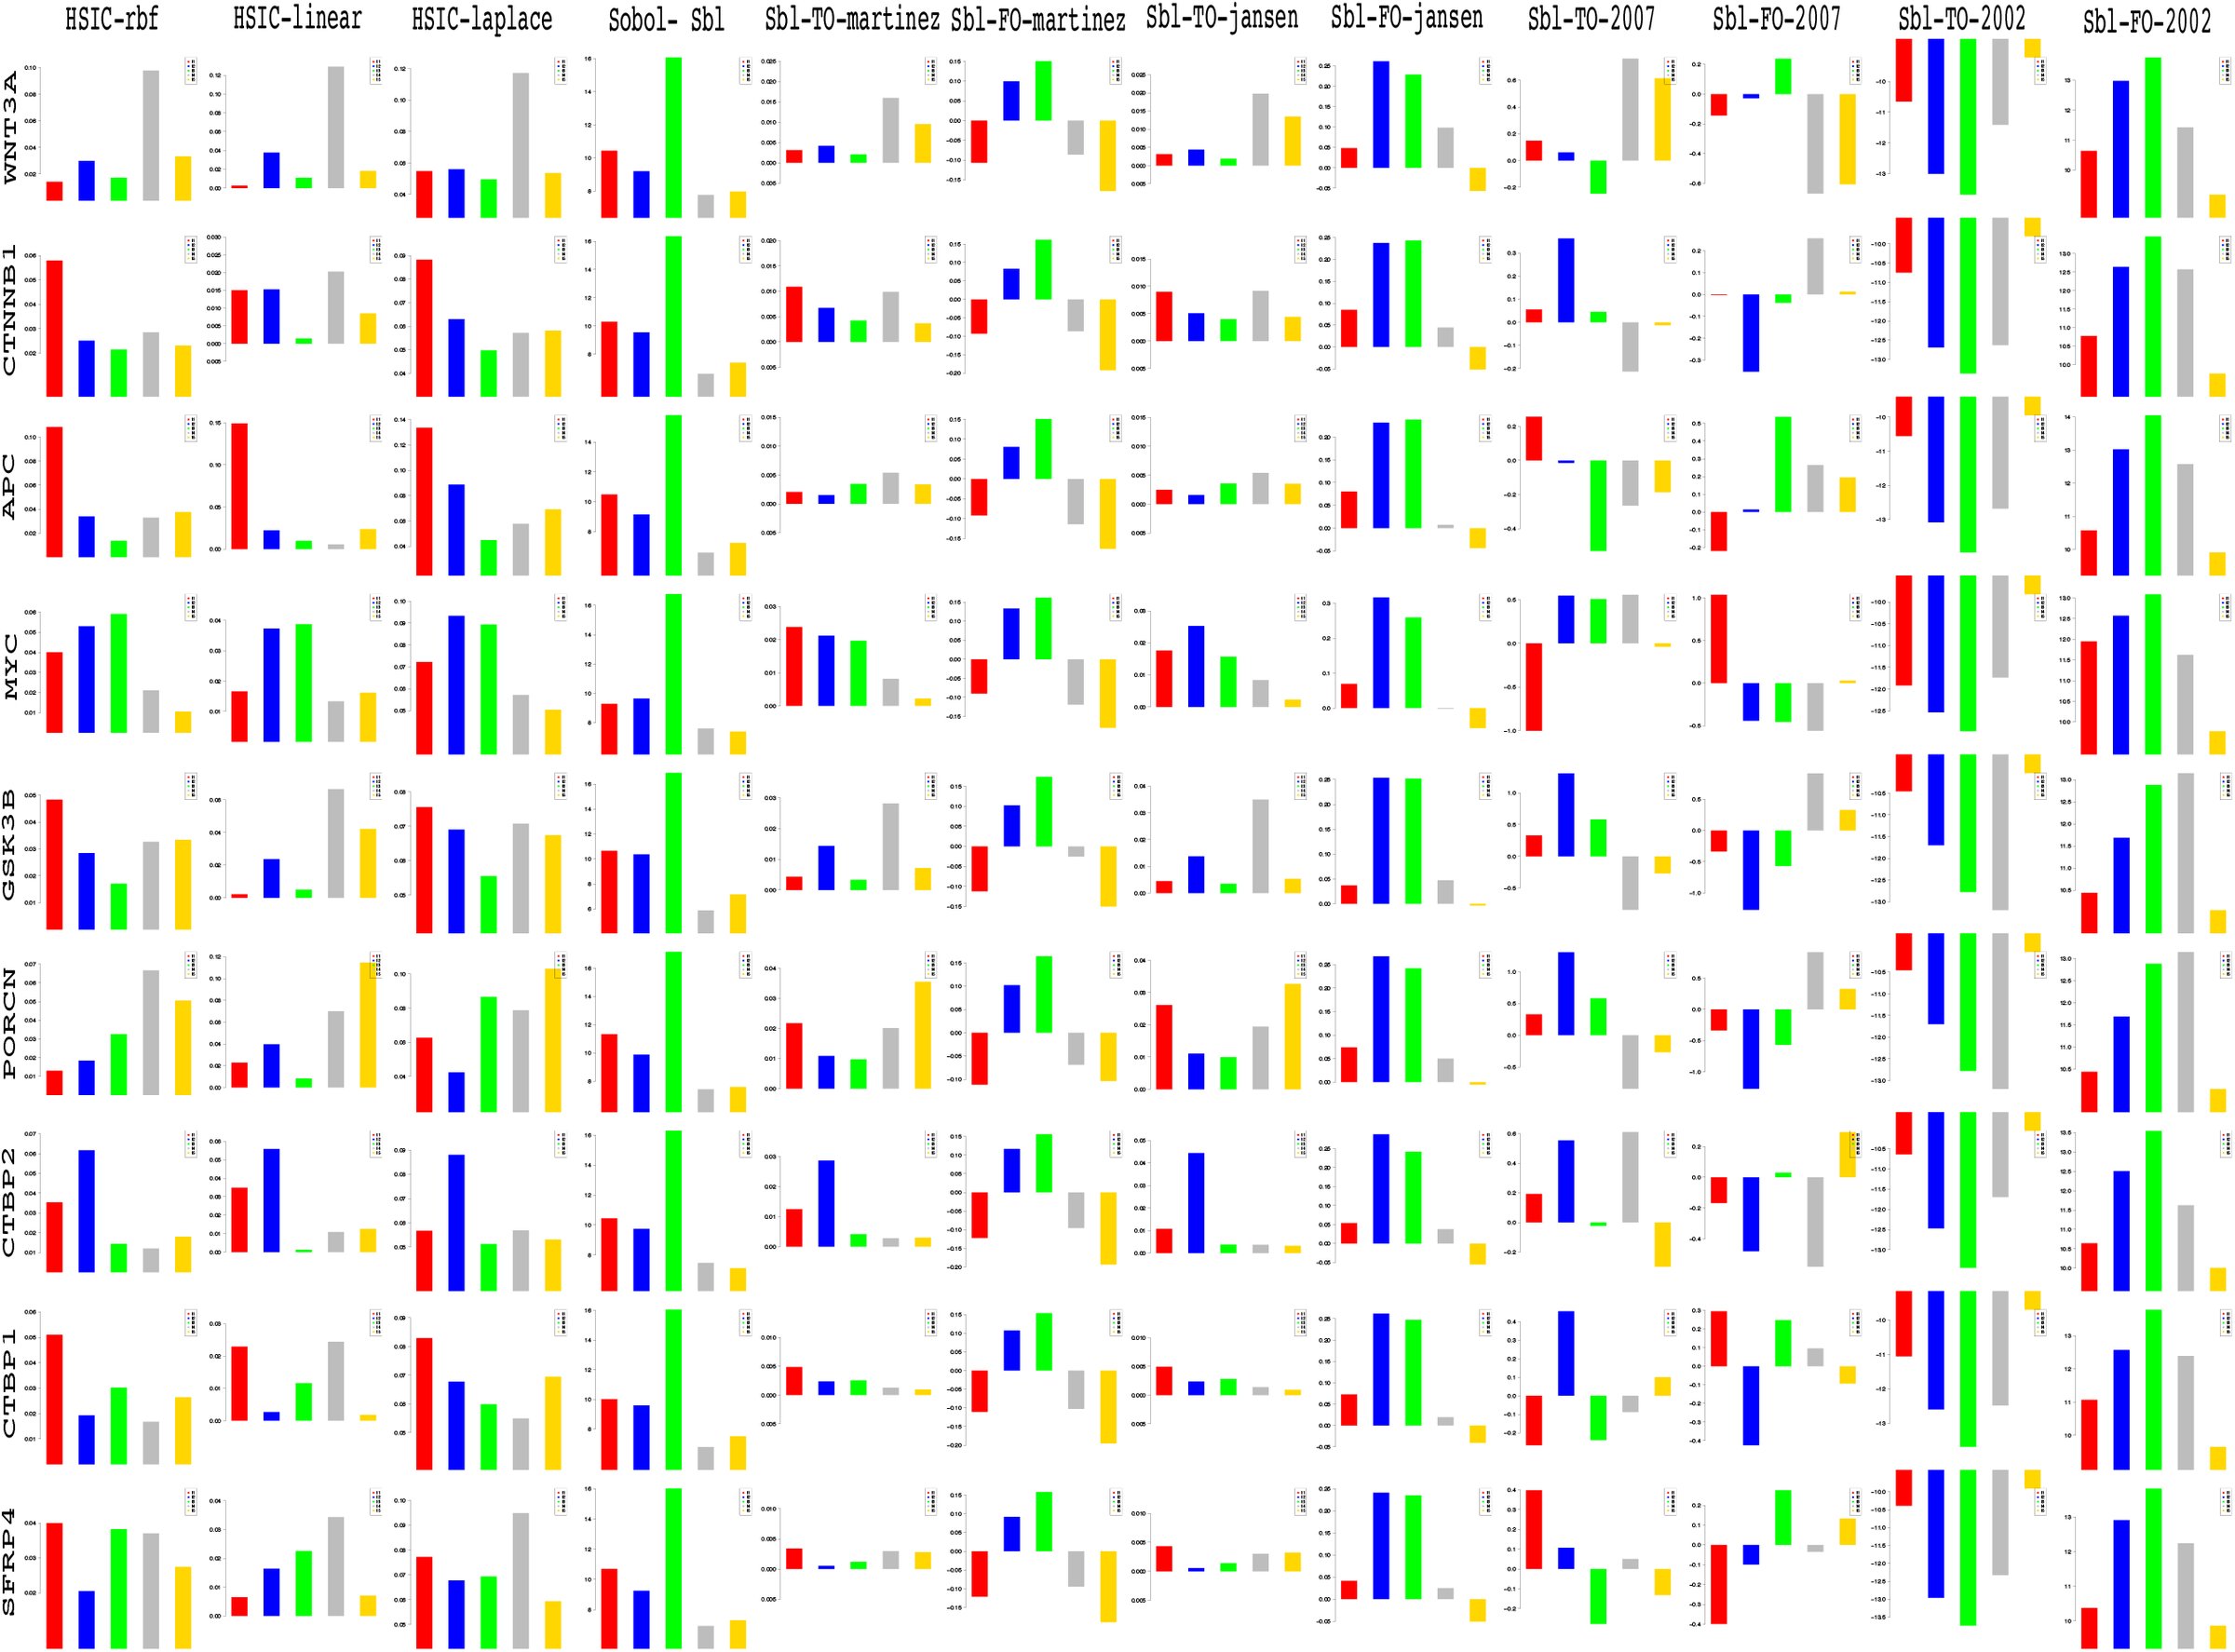 Fig. 8
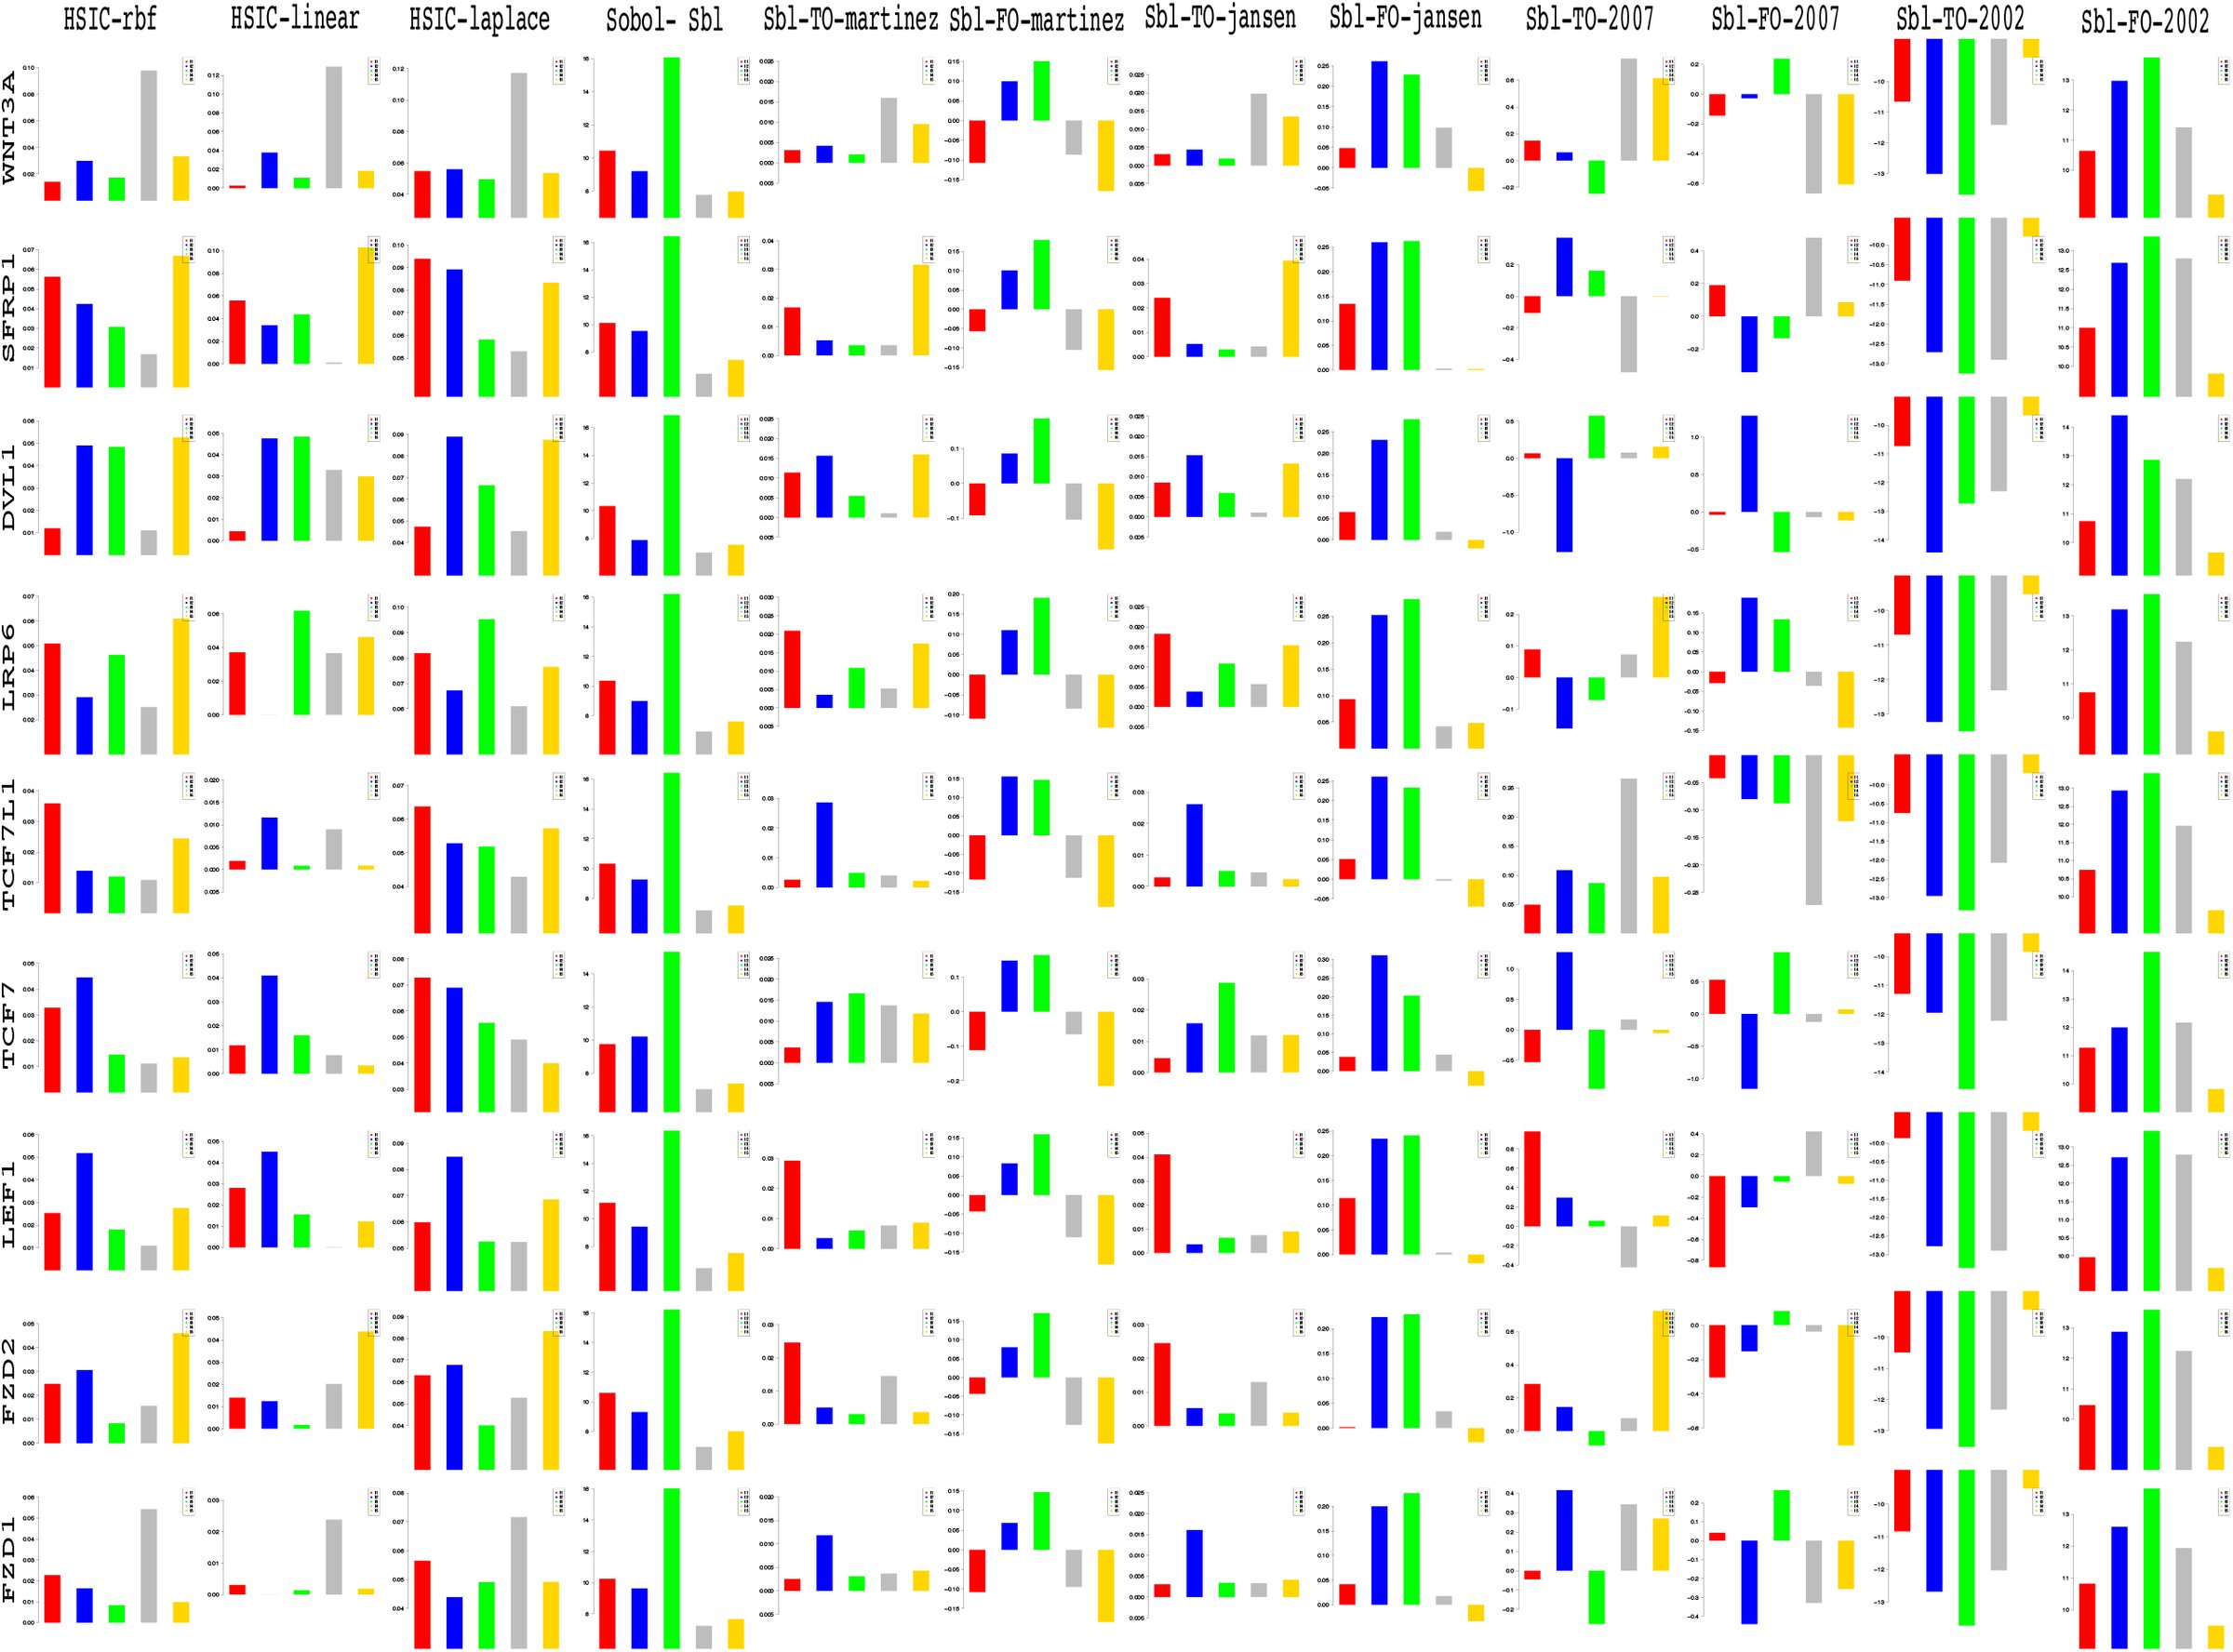 Fig. 9
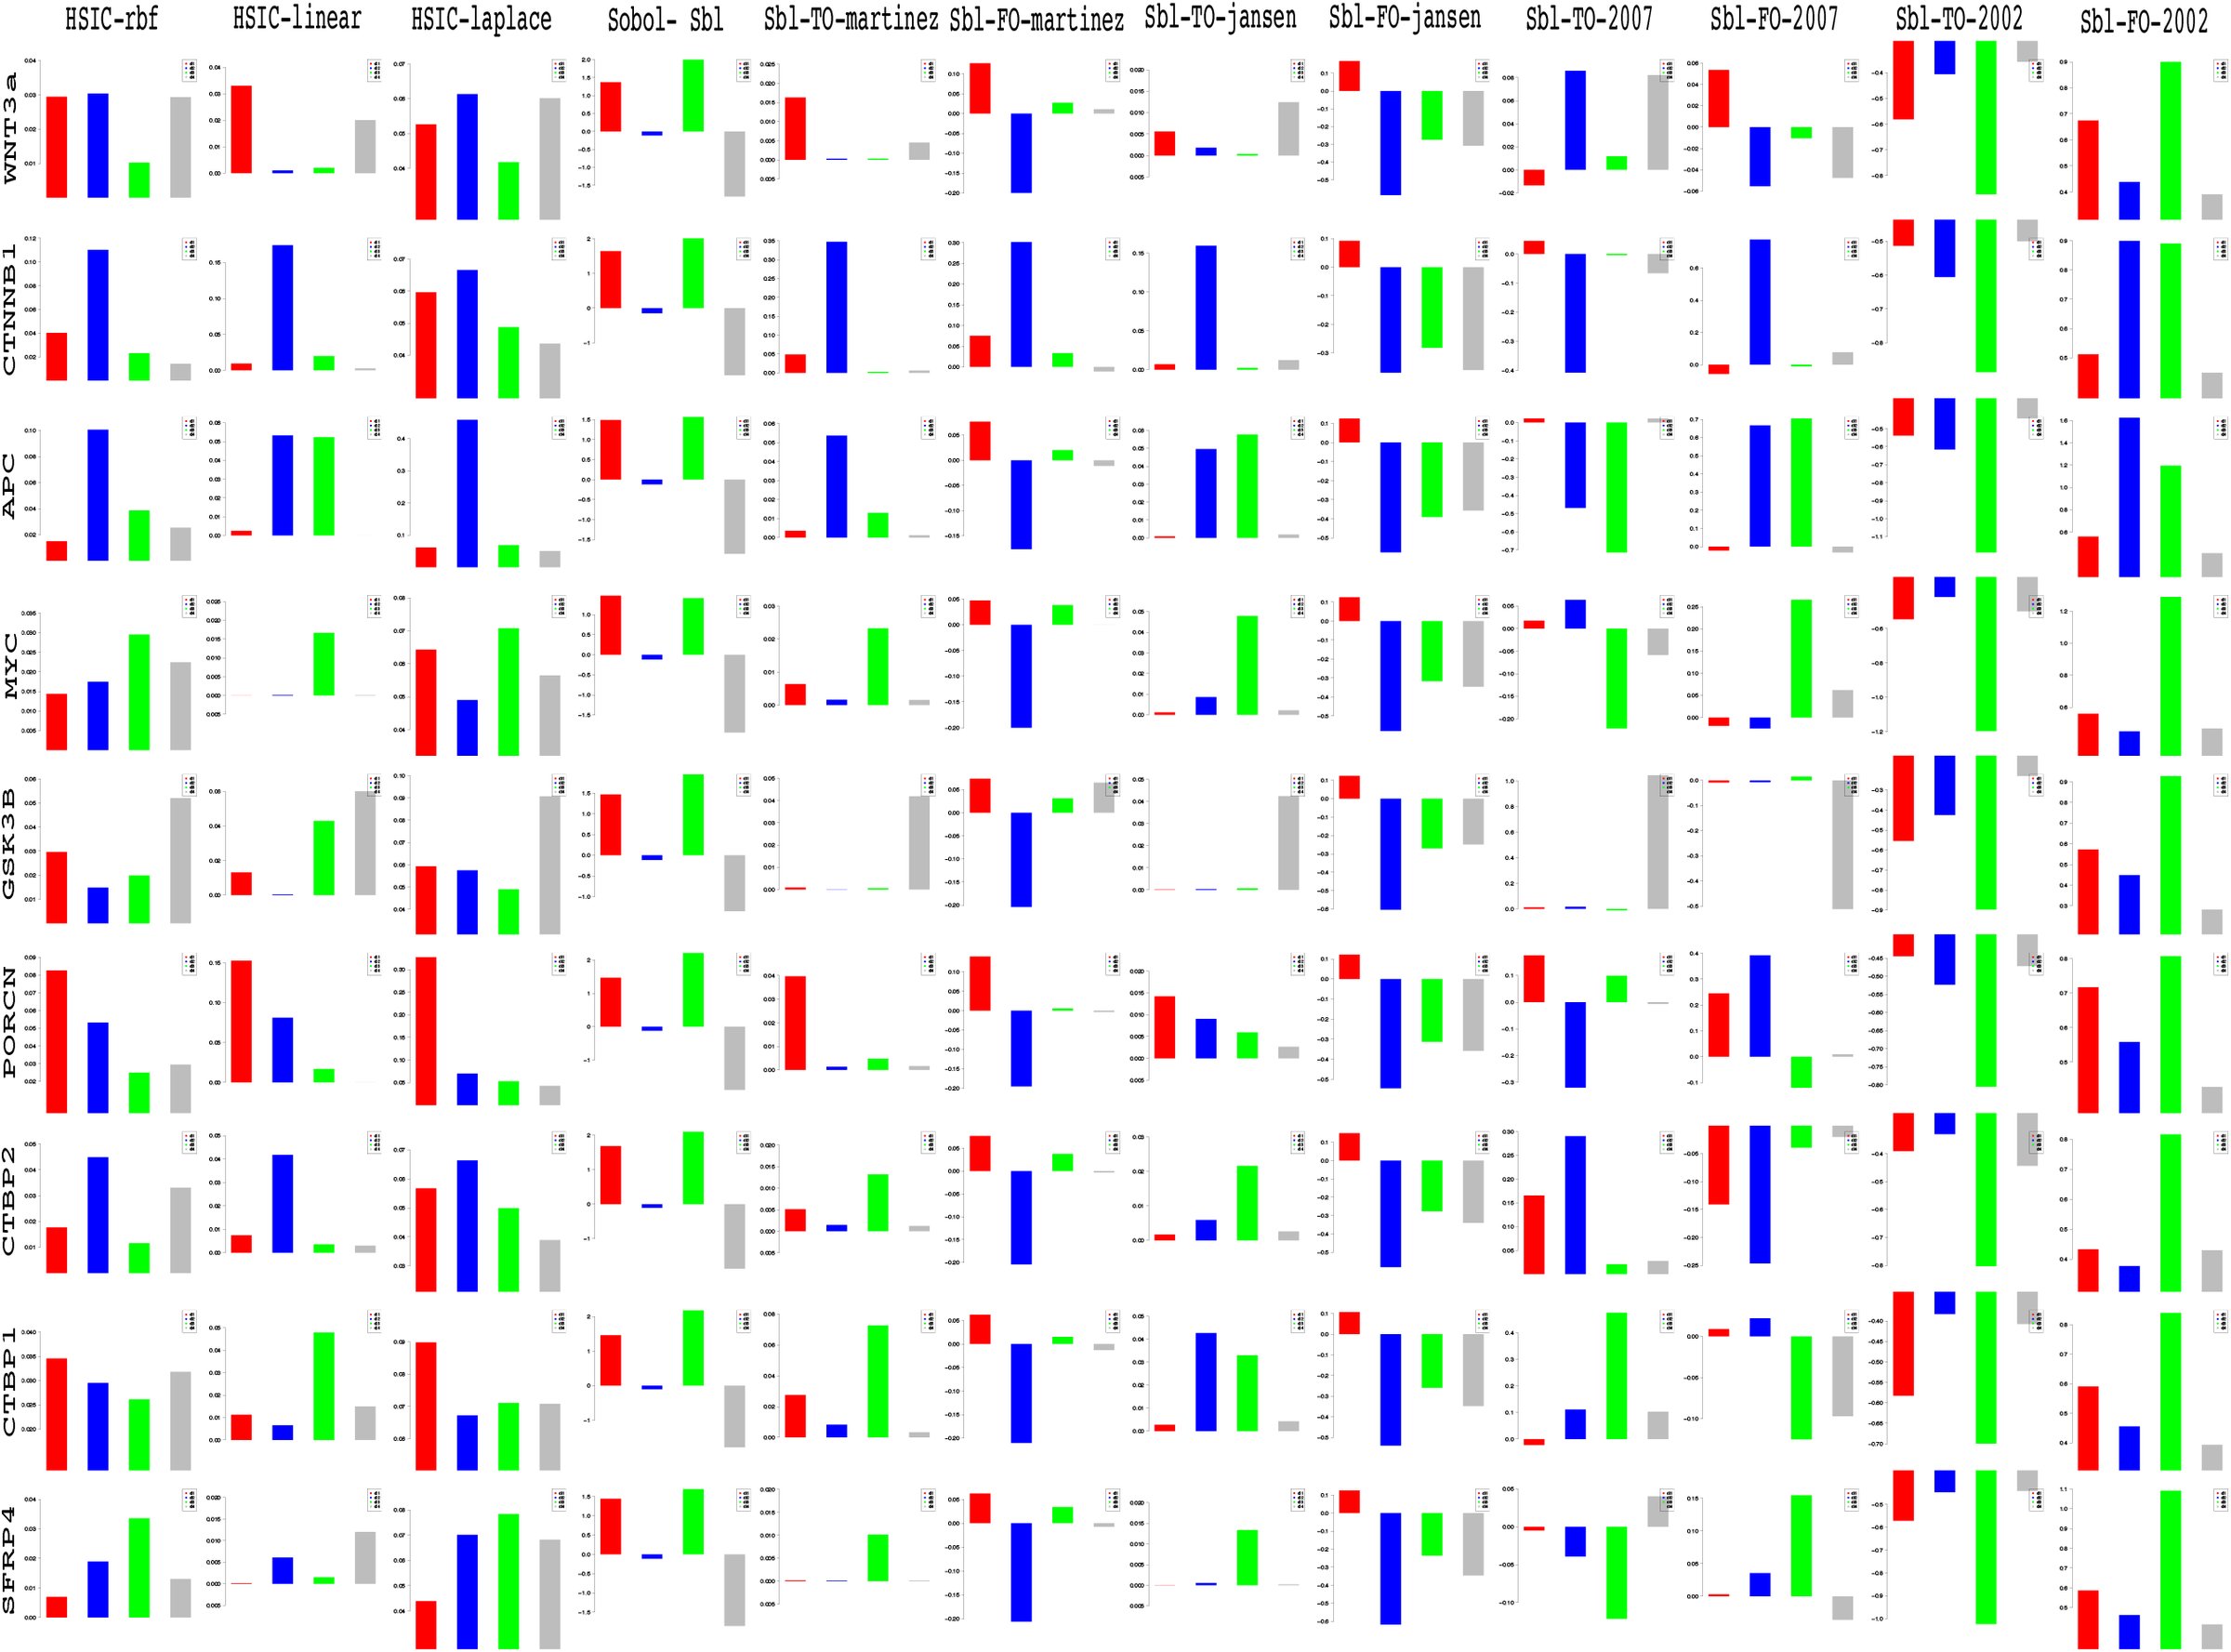 Fig. 10
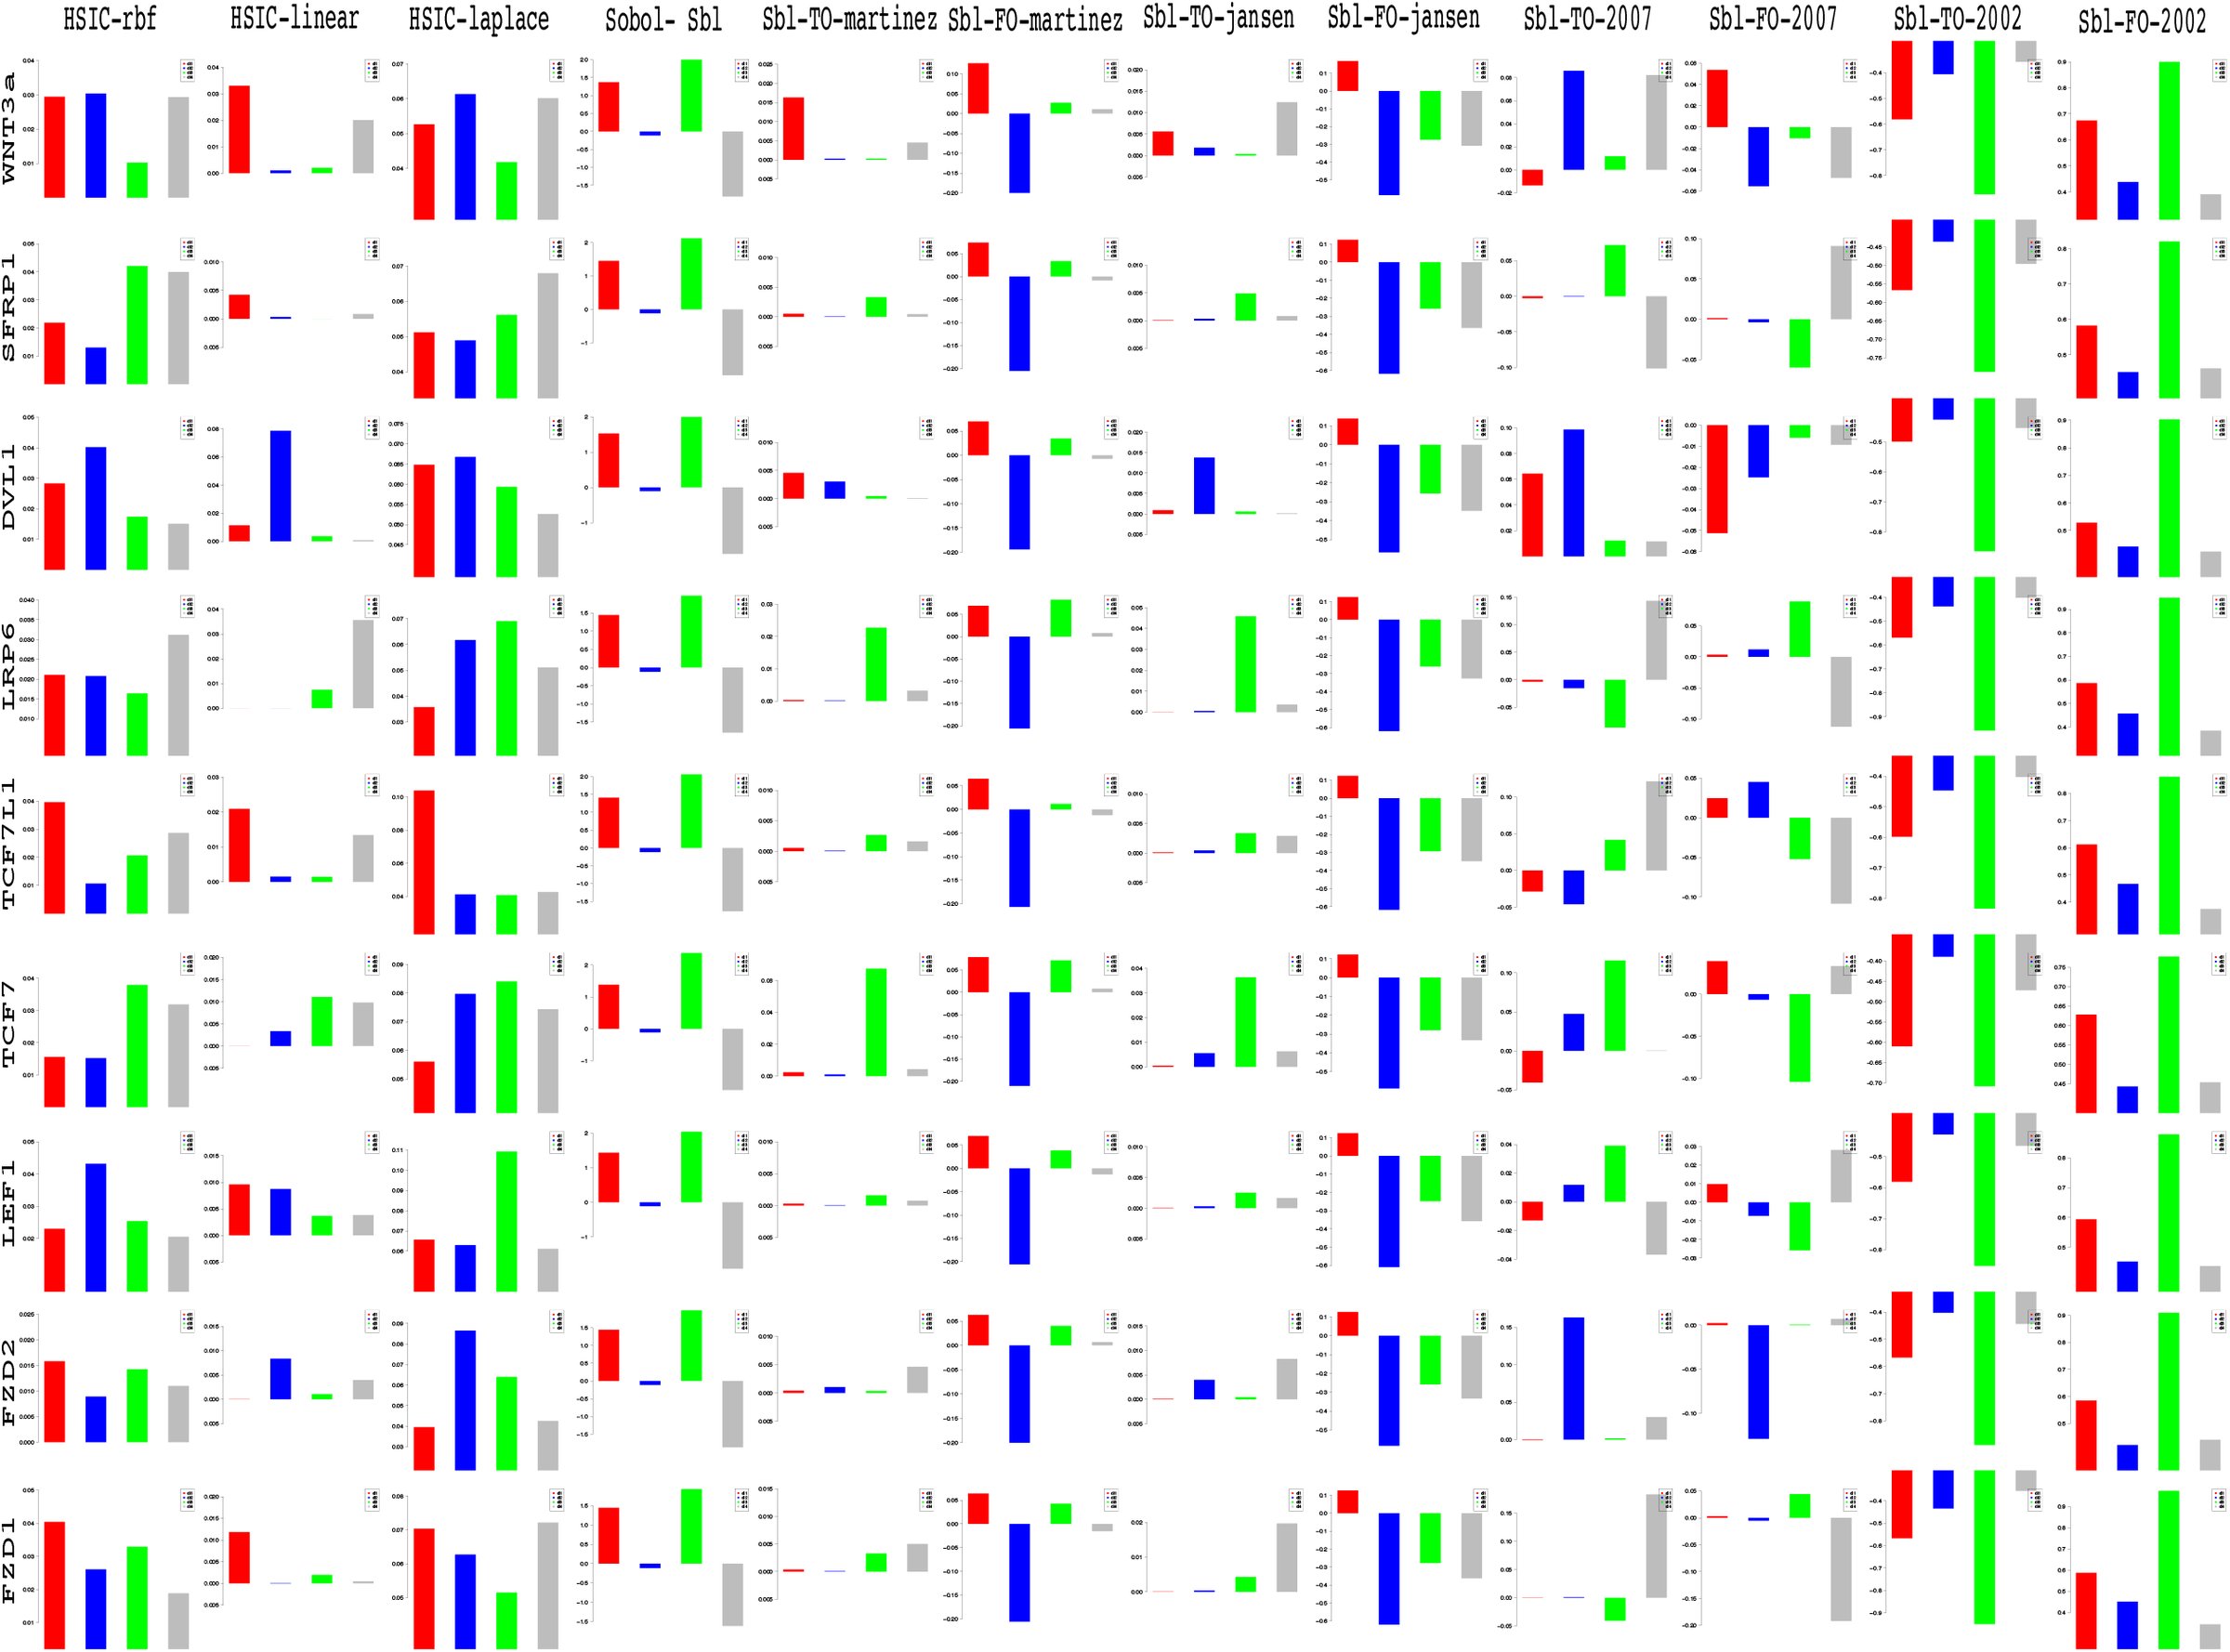 Fig. 11



























Peer Reviews
No public reviews on file for this paper yet. If you reviewed it on a platform where reviews are public (OpenReview, ICLR, NeurIPS, ICML), you can paste yours below so the community can read it here.
Videos
No videos yet. Explain this paper in a talk, walkthrough, or lecture? Add one.
Taxonomy
TopicsHeat shock proteins research · RNA Research and Splicing · Protein Structure and Dynamics
Introduction
1
A short review
1.1
Sharma1’s accidental discovery of the Wingless played a pioneering role in the emergence of a widely expanding research field of the Wnt signaling pathway. A majority of the work has focused on issues related to • the discovery of genetic and epige-netic factors affecting the pathway (Thorstensen et al.2 & Baron and Kneissel3), • implications of mutations in the pathway and its dominant role on cancer and other diseases (Clevers4), • investigation into the pathway’s contribution towards embryo development (Sokol5), homeostasis (Pinto et al.6, Zhong et al.7) and apoptosis (Pećina-Šlaus8) and • safety and feasibility of drug design for the Wnt pathway (Kahn9, Garber10, Voronkov and Krauss11, Blagodatski et al.12 & Curtin and Lorenzi13). Approximately forty years after the discovery, important strides have been made in the research work involving several wet lab experiments and cancer clinical trials (Kahn9, Curtin and Lorenzi13) which have been augmented by the recent developments in the various advanced computational modeling techniques of the pathway. More recent informative reviews have touched on various issues related to the different types of the Wnt signaling pathway and have stressed not only the activation of the Wnt signaling pathway via the Wnt proteins (Rao and Kühl14) but also the on the secretion mechanism that plays a major role in the initiation of the Wnt activity as a prelude (Yu and Virshup15).
The work in this paper investigates some of the current aspects of research regarding the pathway via sensitivity analysis while using static (Jiang et al.16) and time series (Gujral and MacBeath17) gene expression data retrieved from colorectal cancer samples.
Canonical Wnt signaling pathway
1.2
Before delving into the problem statement, a brief introduction to the Wnt pathway is given here. From the recent work of Sinha19, the canonical Wnt signaling pathway is a transduction mechanism that contributes to embryo development and controls homeostatic self renewal in several tissues (Clevers4). Somatic mutations in the pathway are known to be associated with cancer in different parts of the human body. Prominent among them is the colorectal cancer case (Gregorieff and Clevers20). In a succinct overview, the Wnt signaling pathway works when the Wnt ligand gets attached to the Frizzled(FZD)/LRP coreceptor complex. FZD may interact with the Dishevelled (DVL) causing phosphorylation. It is also thought that Wnts cause phosphorylation of the LRP via casein kinase 1 (CK 1) and kinase GSK3. These developments further lead to attraction of Axin which causes inhibition of the formation of the degradation complex. The degradation complex constitutes of AXIN, the β-catenin transportation complex APC, CK1 and GSK3. When the pathway is active the dissolution of the degradation complex leads to stabilization in the concentration of β-catenin in the cytoplasm. As β-catenin enters into the nucleus it displaces the GROUCHO and binds with transcription cell factor TCF thus instigating transcription of Wnt target genes. GROUCHO acts as lock on TCF and prevents the transcription of target genes which may induce cancer. In cases when the Wnt ligands are not captured by the coreceptor at the cell membrane, AXIN helps in formation of the degradation complex. The degradation complex phosphorylates β-catenin which is then recognized by FBOX/WD repeat protein β-TRCP. β-TRCP is a component of ubiquitin ligase complex that helps in ubiquitination of β-catenin thus marking it for degradation via the proteasome. Cartoons depicting the phenomena of Wnt being inactive and active are shown in figures 1(A) and 1(B), respectively.
A cartoon of Wnt signaling pathway contributed by Verhaegh et al.18. Part (A) represents the destruction of β-catenin leading to the inactivation of the Wnt target gene. Part (B) represents activation of Wnt target gene.
Problem statement & sensitivity analysis
2
Succinctly the endeavour is to address the following issues - • explore the strength of contributing factors in the signaling pathway, • analyse the existing causal relations among the inter/extracellular factors effecting the pathway based on prior biological knowledge and • investigate the significance of deviations in fold changes in the recently found prevalence of psychophysical laws working in the pathway in a multi-parameter setting. The issues related to • inference of hidden biological relations among the factors, that are yet to be discovered and • discovery of new causal relations using hypothesis testing, will be addressed in a subsequent manuscript. The current manuscript analyses the sensitivity indices for fold changes and deviations in fold changes in 17 different genes from a set of 74 genes as presented by Gujral and MacBeath17. An immediate followup of the manuscript is the analysis of the remaining57 genes which happens to the part B of this manuscript.
In order to address the above issues, sensitivity analysis (SA) is performed on either the datasets or results obtained from biologically inspired causal models. The reason for using these tools of sensitivity analysis is that they help in observing the behaviour of the output and the importance of the contributing input factors via a robust and an easy mathematical framework. In this manuscript both local and global SA methods are used. Where appropriate, a description of the biologically inspired causal models ensues before the analysis of results from these models. The approach taken here is that first a problem will be addressed and then the analysis of results and discussion ensues before working with the next issue.
Sensitivity analysis
2.1
Seminal work by Russian mathematician Sobol’21 lead to development as well as employment of SA methods to study various complex systems where it was tough to measure the contribution of various input parameters in the behaviour of the output. A recent unpublished review on the global SA methods by Iooss and Lemaître22 categorically delineates these methods with the following functionality • screening for sorting influential measures (Morris23 method, Group screening in Moon et al.24 & Dean and Lewis25, Iterated factorial design in Andres and Hajas26, Sequential bifurcation in Bettonvil and Kleijnen27 and Cotter28 design), • quantitative indicies for measuring the importance of contributing input factors in linear models (Christensen29, Saltelli et al.30, Helton and Davis31 and McKay et al.32) and nonlinear models (Homma and Saltelli33, Sobol34, Saltelli35, Saltelli et al.36, Saltelli et al.37, Cukier et al.38, Saltelli et al.39, & Taran-tola et al.40 Saltelli et al.41, Janon et al.42, Owen43, Tissot and Prieur44, Da Veiga and Gamboa45, Archer et al.46, Tarantola et al.47, Saltelli et al.41 and Jansen48) and • exploring the model behaviour over a range on input values (Storlie and Helton49 and Da Veiga et al.50, Li et al.51 and Hajikolaei and Wang52). Iooss and Lemaître22 also provide various criteria in a flowchart for adapting a method or a combination of the methods for sensitivity analysis. Figure 2 shows the general flow of the mathematical formulation for computing the indices in the variance based Sobol method. The general idea is as follows - A model could be represented as a mathematical function with a multidimensional input vector where each element of a vector is an input factor. This function needs to be defined in a unit dimensional cube. Based on ANOVA decomposition, the function can then be broken down into ƒ0 and summands of different dimensions, if ƒ0 is a constant and integral of summands with respect to their own variables is 0. This implies that orthogonality follows in between two functions of different dimensions, if at least one of the variables is not repeated. By applying these properties, it is possible to show that the function can be written into a unique expansion. Next, assuming that the function is square integrable variances can be computed. The ratio of variance of a group of input factors to the variance of the total set of input factors constitute the sensitivity index of a particular group. Detailed derivation is present in the Appendix.
Computation of variance based sobol sensitivity indices. For detailed notations, see appendix.
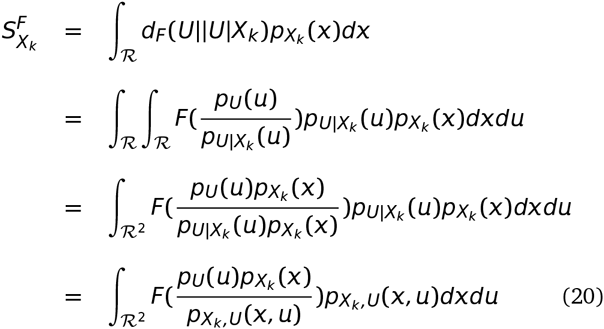
Besides the above Sobol’21’s variance based indicies, more recent developments regarding new indicies based on density, derivative and goal-oriented can be found in Borgonovo53, Sobol and Kucherenko54 and Fort et al.55, respectively. In a latest development, Da Veiga56 propose new class of indicies based on density ratio estimation (Borgonovo53) that are special cases of dependence measures. This in turn helps in exploiting measures like distance correlation (Székely et al.57) and Hilbert-Schmidt independence criterion (Gretton et al.58) as new sensitivity indi-cies. The framework of these indicies is based on use of Csiszár et al.59 f-divergence, concept of dissimilarity measure and kernel trick Aizerman et al.60. Finally, Da Veiga56 propose feature selection as an alternative to screening methods in sensitivity analysis. The main issue with variance based indicies (Sobol’21) is that even though they capture importance information regarding the contribution of the input factors, they • do not handle mul-tivariate random variables easily and • are only invariant under linear transformations. In comparison to these variance methods, the newly proposed indicies based on density estimations (Borgonovo53) and dependence measures are more robust. Figure 3 shows the general flow of the mathematical formulation for computing the indices in the density based HSIC method. The general idea is as follows - The sensitivity index is actually a distance correlation which incorporates the kernel based Hilbert-Schmidt Information Criterion between two input vectors in higher dimension. The criterion is nothing but the Hilbert-Schmidt norm of cross-covariance operator which generalizes the covariance matrix by representing higher order correlations between the input vectors through nonlinear kernels. For every operator and provided the sum converges, the Hilbert-Schmidt norm is the dot product of the orthonormal bases. For a finite dimensional input vectors, the Hilbert-Schmidt Information Criterion estimator is a trace of product of two kernel matrices (or the Gram matrices) with a centering matrix such that HSIC evalutes to a summation of different kernel values. Detailed derivation is present in the Appendix.
Computation of density based hsic sensitivity indices. For detailed notations, see appendix.
It is this strength of the kernel methods that HSIC is able to capture the deep nonlinearities in the biological data and provide reasonable information regarding the degree of influence of the involved factors within the pathway. Improvements in variance based methods also provide ways to cope with these nonlineari-ties but do not exploit the available strength of kernel methods. Results in the later sections provide experimental evidence for the same.
Relevance in systems biology
2.2
Recent efforts in systems biology to understand the importance of various factors apropos output behaviour has gained prominence. Sumner et al.61 compares the use of Sobol’21 variance based indices versus Morris23 screening method which uses a One-at-a-time (OAT) approach to analyse the sensitivity of GSK3 dynamics to uncertainty in an insulin signaling model. Similar efforts, but on different pathways can be found in Zheng and Rundell62 and Marino et al.63.
SA provides a way of analyzing various factors taking part in a biological phenomena and deals with the effects of these factors on the output of the biological system under consideration. Usually, the model equations are differential in nature with a set of inputs and the associated set of parameters that guide the output. SA helps in observing how the variance in these parameters and inputs leads to changes in the output behaviour. The goal of this manuscript is not to analyse differential equations and the parameters associated with it. Rather, the aim is to observe which input genotypic factors have greater contribution to observed pheno-typic behaviour like a sample being normal or cancerous in both static and time series data. In this process, the effect of fold changes and deviations in fold changes in time is also considered for analysis in the light of the recently observed psychophysical laws acting downstream of the Wnt pathway (Goentoro and Kirschner64).
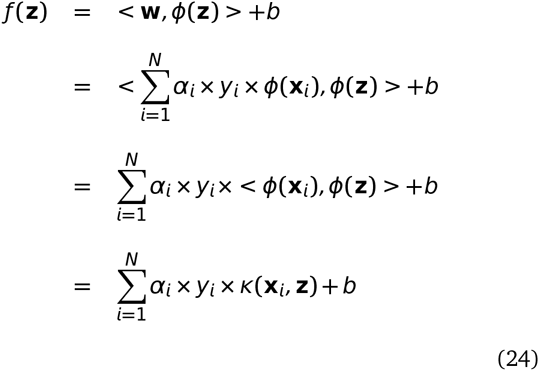
There are two approaches to sensitivity analysis. The first is the local sensitivity analysis in which if there is a required solution, then the sensitivity of a function apropos a set of variables is estimated via a partial derivative for a fixed point in the input space. In global sensitivity, the input solution is not specified. This implies that the model function lies inside a cube and the sensitivity indices are regarded as tools for studying the model instead of the solution. The general form of g-function (as the model or output variable) is used to test the sensitivity of each of the input factor (i.e expression profile of each of the genes). This is mainly due to its non-linearity, non-monotonicity as well as the capacity to produce analytical sensitivity indices. The g-function takes the form [eqn] were, d is the total number of dimensions and ai ≥ 0 are the indicators of importance of the input variable xi. Note that lower values of ai indicate higher importance of xi. In our formulation, we randomly assign values of xi € [0, 1]. For the static (time series) data d = 18(71) (factors affecting the pathway). Thus the expression profiles of the various genetic factors in the pathway are considered as input factors and the global analysis conducted. Note that in the predefined dataset, the working of the signaling pathway is governed by a preselected set of genes that affect the pathway. For comparison purpose, the local sensitivity analysis method is also used to study how the individual factor is behaving with respect to the remaining factors while working of the pathway is observed in terms of expression profiles of the various factors.
Finally, in context of Goentoro and Kirschner64’s work regarding the recent development of observation of Weber’s law working downstream of the pathway, it has been found that the law is governed by the ratio of the deviation in the input and the absolute input value. More importantly, it is these deviations in input that are of significance in studing such a phemomena. The current manuscript explores the sensitivity of deviation in the fold changes between measurements of fold changes at consecutive time points to explore in what duration of time, a particular factor is affecting the pathway in a major way. This has deeper implications in the fact that one is now able to observe when in time an intervention can be made or a gene be perturbed to study the behaviour of the pathway in tumorous cases. Thus sensitivity analysis of deviations in the mathematical formulation of the psychophysical law can lead to insights into the time period based influence of the involved factors in the pathway. Thus, both global and local anaylsis methods are employed to observe the entire behaviour of the pathway as well as the local behaviour of the input factors with respect to the other factors, respectively, via analysis of fold changes and deviations in fold changes, in time.
Given the range of estimators available for testing the sensitivity, it might be useful to list a few which are going to be employed in this research study. Also, a brief introduction into the fundamentals of the derivation of the three main indicies and the choice of sensitivity packages which are already available in literature, has been described in the Appendix.
Description of the dataset & design of experiments
3
Static data - A simple static dataset containing expression values measured for a few genes known to have important role in human colorectal cancer cases has been taken from Jiang et al16. Most of the expression values recorded are for genes that play a role in Wnt signaling pathway at an extracellular level and are known to have inhibitory affect on the Wnt pathway due to epigenetic factors. For each of the 24 normal mucosa and 24 human colorectal tumor cases, gene expression values were recorded for 14 genes belonging to the family of SFRP, DKK, WIF1 and DACT. Also, expression values of established Wnt pathway target genes like LEF1, MYC, CD44 and CCND1 were recorded per sample.
Time series data - Contrary to the static data described above, Gujral and MacBeath17 presents a bigger set of 71 Wnt-related gene expression values for 6 different times points over a range of 24-hour period using qPCR. The changes represent the fold-change in the expression levels of genes in 200 ng/mL WNT3A-stimulated HEK 293 cells in time relative to their levels in unstimulated, serum-starved cells at 0-hour. The data are the means of three biological replicates. Only genes whose mean transcript levels changed by more than two-fold at one or more time points were considered significant. Positive (negative) numbers represent up (down) -regulation.
Note that green (red) represents activation (repression) in the heat maps of data in Jiang et al.16 and Gujral and MacBeath17. Figures 4 and 5 represent the heat maps for the static and time series data respectively.
Heat map for gene expression values for each of the 24 normal mucosa and 24 human colorectal tumor cases from Jiang et al.16
Heat map for gene expression values for 5 time points from Gujral and MacBeath17
general issues - • Here the input factors are the gene expression values for both normal and tumor cases in static data. For the case of time series data, the input factors are the fold change (deviations in fold change) expression values of genes at different time points (periods). Also, for the time series data, in the first experiment the analysis of a pair of the fold changes recorded at to different consecutive time points i.e [eqn] is done. In the second experiment, the analysis of a pair of deviations in fold changes recorded at [eqn] and [eqn]. In this work, in both the static and the time series datasets, the analysis is done to study the entire model/pathway rather than find a particular solution to the model/pathway Thus global sensitivity analysis is employed. But the local sensitivity methods are used to observe and compare the affect of individual factors via 1^st^ order analysis w.r.t total order analysis (i.e global analysis). In such an experiment, the output is the sensitivity indices of the individual factors participating in the model. This is different from the general trend of observing the sensitivity of parameter values that affect the pathway based on differential equations that model a reaction. Thus the model/pathway is studied as a whole by observing the sensitivities of the individual factors.
• Static data - Note that the 24 normal and tumor cases are all different from each other. The 18 genes that are used to study in16 are the input factors and it is unlikely that there will be correlations between different patients. The phenotypic behaviour might be similar at a grander scale. Also, since the sampling number is very small for a network of this scale, large standard deviations can be observed in many results, especially when the Sobol method is used. But this is not the issue with the sampling number. By that analysis, large deviations are not observed in kernel based density methods. The deviations are more because of the fact that the nonlinearities are not captured in an efficient way in the variance based Sobol methods. Due to this, the resulting indi-cies have high variance in numerical value. For the same number of samplings, the kernel based methods don’t show high variance.
• Time series data - All the measurement data at each time point are generated by a normal distribution with fixed standard deviation of 0.005 plus a noise term. One might enquire as to how does this data generation match with the real experimental data? The kernel based density methods requires a distribution of data. The original experimental data of fold change was taken from each of the genes per time point. Gujral and MacBeath17 states that to determine the fold-change in gene expression induced by stimulation with Wnt3a, the normalized expression of each gene in the Wnt3a-stimulated sample was divided by the normalized expression of the same gene in the unstimulated sample. The qPCR data presented are mean of three biological replicates. By using a stringent margin of 0.005 and a noise term, the distribution of the data near the mean value is kept constricted. How much it deviates from the reality beyond the errors of measurement is not known to the author! Finally, 74 gene expression values are taken as input per time point for evaluting the sensitivity of each of the genetic factor that affect the model/pathway Again, one is not looking for a solution to the model in terms of good value for parameters but studying the degree of influence of each of the input factors that constitute the model/pathway
Design of experiments - The reported results will be based on scaled as well as unscaled datasets. For the static data, only the scaled results are reported. This is mainly due to the fact that the measurements vary in a wide range and due to this there is often an error in the computed estimated of these indices. The data for time series does not vary in a wide range and thus the results are reported for both the scaled and the non scaled versions. Total sensitivity indices and 1^st^ order indices will be used for sensitivity analysis. For addressing a biological question with known prior knowledge, the order of indices might be increased. While studying the interaction among the various genetic factors using static data, tumor samples are considered separated from normal samples. Bootstrapping without replicates on a smaller sample number is employed to generate estimates of indices which are then averaged. This takes into account the variance in the data and generates confidence bands for the indices. For the case of time series data, interactions among the contributing factors are studied by comparing (1) pairs of fold-changes at single time points and (2) pairs of deviations in fold changes between pairs of time points. Generation of distribution around measurements at single time points with added noise is done to estimate the indices.
Static data
4
To measure the strength of the contributing factors in the static dataset by Jiang et al.16, 1^st^ order and total sensitivity indices were generated. For each of the expression values of the genes recorded in the normal and tumor cases, the computation of the indices was done using bootstrapped samples in three different experiments each with a sample size of 8, 16 and 24, respectively. With only 24 samples in total, 20 bootstraps were generated for each set and the results were generated. From these replicates, the mean of the indices is reported along with the 95% confidence bands. Figure 6 represents the cartoon of the experimental setup followed to acheive the desired results. Note that plots of sensitivity indices have been relegated to Appendix.
A cartoon of experimental setup. Step - (1) Segregation of data into normal and tumor cases. (2) Further data division per case and bootstrap sampling with no repetitions for different iterations. (3) Assembling bootstrapped data and application of SA methods. (4) Generation of SI’s for normal and tumor case per gene per iteration. (5) Generation of averaged SI and confidence bands per case per gene
Using the sensiFdiv, all indices are computed as positive and those nearing to zero indicate the contribution of a factor as independent from the behaviour under consideration. Here, while comparing the indices of the gene expression values for normal and tumor cases, it was found that most of the involved in-tra/extracellular factors had some degree of contribution in the normal case and almost negligible contribution in the tumor case (see figures 13, 15 and 16). Apart from the negative reading for the KL divergence 14 the interpretations remain the same. This implies that the basic Csiszár et al.59 f-divergence based indices might not capture the intrinsic genotypic effects for the normal and the tumorous cases. From the biological perspective, these graphs do not help in interpreting the strength of the contributions in normal and tumor cases. One might rank the indices for relative contributions, but this might not shed enough light on the how the factors are behaving in normal and tumor cases.
A more powerful way to analyse the contributions is the newly proposed HSIC based measures by Da Veiga56. These distances use the kernel trick which can capture intrinsic properties inherent in the recorded measurements by transforming the data into a higher dimensional space. Using these distances in sensiHSIC, it was found that the contributions of the various factors in the normal and the tumor cases vary drastically. This is shown in figures 17, 18 and 19. The laplace and the rbf kernels give more reliable sensitivity estimates for the involved factors than the linear kernel. Studying the results in figures 6 and 7 of Sinha19 based on prior biological knowledge encoded in the Bayesian network models along with the indices of aforementioned figures, it can be found that indices of the family of DACT – 1/2/3 show higher (lower) sensitivity in the normal (tumor) case where the activation (repression) happens. Again, of the DACT family, DACT – 1 has greater influence than DACT – 3 (than DACT – 2) based on the values of the sensitivity indices. These indices indicate the dependence of a factor on the output of the model characterized by the signaling being active (passive) in the normal (tumor) cases. 0(1) mean no (full) dependence of the output on the input factor. The laplace and the rbf kernels were found to give more consistent results than the linear kernel and the following description discusses the results from these kernels. For the SFRP family SFRP – 1/2/5 show higher (lower) sensitivity in normal (tumor) case where the activation (repression) happens (see figures 18 and 19). For SFRP – 3/4 the influence is higher (lower) in the tumor (normal) case. In all the three types of kernels, WIF1, MYC and CCND1 show stronger (weaker) influence of repression (activation) in the normal (tumor) case (see figures 18 and 19). CD44 showed variable influence while observing the normal and tumor cases. Sinha19 could not derive proper inferences for LEF1 but the sensitivity indices indicate that the influence of LEF1 in tumor samples to be higher than in normal samples. This points to the LEF1’s major role in tumor cases. Finally, for the family of DKK, DKK1 and DKK3 – 2 show similar behaviour of expression (repression) in normal (tumor cases) (see Sinha19). For the former, the prominence of the influence is shown in the higher (lower) sensitivity for tumor (normal) case. For the latter higher (lower) sensitivity was recorded for normal (tumor) case. This implies that the latter has more influential role in normal while the former has more influential role in tumor case. DKK3 – 1 was found to be expressed (repressed) in normal (tumor) and its dominant role is prominent from the higher bar sensitivity bar for normal than the tumor. Similar behavior of DKK2 was inferred by Sinha19 but the sensitivity indices point to varied results and thus a conclusion cannot be drawn. Note that greater the value of the sensitivity index, greater is an input factor’s contribution to the model.
A cartoon of experimental setup. Step - (1) Time recordings of different gene expression values after WNT3A stimulation at different hrs. (2) Generation of normal distribution for every FC & ΔFC for Gx at & between different time snapshots, respectively. mean - original Gx exp value; standard dev - 0.005 + noise from jitter function in R (3) Generation of data set for FC & ΔFC. (4) Generation of samples for SA. (5) Compute SI for FC & ΔFC.
The first order indices generated by sobol functions implemented in sobol2002 (figure 20), sobol2007 (figure 21), sobol-jansen (figure 22), sobolmartinez (figure 23) and sobol (figure 24) do not point to significant dependencies of the input factors. This can be attributed to the fact that there are less number of samples that help in the estimation of the sensitivity indicies. Finally, the total order indices need to be investigated in the context of the first order indices. It can be observed, sobol2002 (figure 25) and sobol2007 (figure 25) give much better estimates than soboljansen (figure 27) and sobolmartinez (figure 28). Most importantly, it is the former two that closely match with the sensitivity indices estimated using the HSIC distance measures. Interpretations from sobol2002 (figure 25) and sobol2007 (figure 26) are the same as those described above using the laplace and the rbf kernels from density based HSIC measure.
In summary, the sensitivity indices confirm the inferred results in Sinha19 but do not help in inferring the causal relations using the static data. In combination with the results obtained from the Bayesian network models in Sinha19 it is possible to study the effect of the input factors for the pathway in both normal and tumor cases. The results of sensitivity indices indicate how much these factors influence the pathway in normal and tumor cases. Again, not all indices reveal important information. So users must be cautious of results and see which measures reveal information that are close to already established or computationally estimated biological facts. Here the density based sensitivity indices captured information more precisely than the variance based indices (except for the total order indices from sobol2002/7 which gave similar results as sensiHSIC). This is attributed to the analytical strength provided by the distance measures using the kernel trick via RKHS that capture nonlinear relations in higher dimensional space, more precisely. Finally, in a recent unpublished work by De Lozzo and Marrel73, it has been validated that the HSIC indices prove to be more sensitive to the global behaviour than the Sobol indices.
Time series data
5
Next, the analysis of the time series data is addressed using the sensitivity indices. There are two experiments that have been performed. First is related to the analysis of a pair of the fold changes recorded at to different consecutive time points i.e [eqn] & [eqn]. The second is related to the analysis of a pair of deviations in fold changes recorded at [eqn] and [eqn]. The former compares the measurements in time while the latter takes into account the deviations that happens in time. For each measurement at a time point a normal distribution was generated with original recorded value as the mean, a standard deviation of 0.005 and an added noise in the form of jitter (see function jitter in R langauge). For the time measurements of each of the genes recorded in Gujral and MacBeath17 an analysis of the sensitivity indices for both the scaled and the non-scaled data was done. Here the analysis for non-scaled data is presented. The reason for not presenting the scaled data is that the sample measurements did not vary drastically as found in the case of static data which caused troubles in the estimation of indices earlier. Another reason for not reporting the results on the scaled data is that the non-scaled ones present raw sensitive information which might be lost in scaling via normalization. Note that the authors use self organizing maps (SOM) to cluster data and use correlational analysis to derive their conclusions. In this work, the idea of clustering is abandoned and sensitivity indices are estimated for recorded factors participating in the pathway. Also the simple correlational analysis is dropped in favour of highly analytical kernel based distance measures. Figure 7 represents the experimental setup in a pictorial format.
Also, in a recent development, Goentoro and Kirschner64 point to two findings namely, • the robust fold changes of β-catenin and • the transcriptional machinery of the Wnt pathway depends on the fold changes in β-catenin instead of absolute levels of the same and some gene transcription networks must respond to fold changes in signals according to the Weber’s law in sensory physiology. The second study also carries a weight in the fact that due to the study of the deviations in the fold changes it is possible to check if the recently observed and reported natural psychophysical laws in the signaling pathway hold true or not. Finally, using the sensitivity indicies an effort is made to confirm the existing biological causal relations.
Analysis of fold changes at different time points
5.1
Lets begin with the gene WNT3A as changes in its concentration lead to recording of the measurements of the different genes by Gujral and MacBeath17. Of the list of genes recorded, the indices of the those which are influenced by the concentration of WNT3A are analysed. Next based on these confirmations and patterns of indices over time, conclusions for other enlisted genes are drawn. For the former list, the following genes FZD1, FZD2, LEF1, TCF7, TCF7L1, LRP6, DVL1, SFRP1, SFRP4, CTBP1, CTBP2, PORCN, GSK3β, MYC, APC and CTNNB1 are considered.
Figures 8 and 9 represent the indices computed over time. Columns represent the different kinds of indices computed while the rows show the respective genes. Each graph contains the sensitivity index computed at a particular time point (represented by a coloured bar). It should be observed from the aforementioned figures that the variants of the Sobol first order (FO) and the total order (TO) indices computed under different formulations were not very informative. This can be seen in graphs were some indices are negative and at some places the behaviour across time and genes remain the same. In contrast to this, the indices generated via the original Sobol function (under the column Sobol-SBL) as well as the sensiHSIC were found to be more reliable. Again, the rbf and laplace kernels under the HSIC formulations showed similar behaviour in comparison to the use of the linear kernel.
Gujral and MacBeath17 simulate the serum starved HEK293 cells with 200 ng/mL of WNT3A at different lengths of time. After the first hour (t1), (under HSIC-rbf/laplace) it was observed that the sensitivity of WNT3A was low (red bar). The maximum contribution of WNT3A can be recoreded after the 12^th^ stimulation. But due to increased stimulation by WNT3A later on, there is an increased sensitivity of FZD-1/2 as well as LRP6. The FZD or the frizzled family of 7-transmember protein (Ueno et al.74) works in tandem with LRP-5/6 as binding parameters for the Wnt ligands to initiate the Wnt signaling. Consistent with the findings of Holcombe et al.75 and Planutis et al.76, FZD1 was found to be expressed. But there is a fair decrease in the contribution of the same in the next two time frames i.e after 3^rd^ and the 6^th^ hour. The maximum contribution of FZD1 is found after the WNT3A simulation at 12^th^ hour. This probably points to repetitive involvement of FZD 1 after a certain period of time to initiate the working of the signaling pathway. FZD2 showed increasing significance in contribution after the first two time frames. The contribution drops significantly after the 3^rd^ simulation and gradually increases in the next two time frames. The repetitive behaviour is similar to FZD1, yet it’s role is not well studied as it appears to bind to both WNT3A which promotes Wnt/beta-catenin signaling and WNT5A which inhibits it as shown by Sato et al.77, respectively.
Column wise - methods to estimate sensitivity indices. Row wise - sensitivity indicies for each gene. For each graph, the bars represent sensitivity indices computed at t1 (red), t2 (blue), t3 (green), t4 (gray) and t5 (yellow). Indices were computed using non scaled time series data. TO - total order; FO - first order; SBL - Sobol
Column wise - methods to estimate sensitivity indices. Row wise - sensitivity indicies for each gene. For each graph, the bars represent sensitivity indices computed at t1 (red), t2 (blue), t3 (green), t4 (gray) and t5 (yellow). Indices were computed using non scaled time series data. TO - total order; FO - first order; SBL - Sobol
Klapholz-Brown et al.78 and Yokoyama et al.79 show that there is increased β-catenin due to WNT3A stimulation which is depicted by the increased sensitivity of CTNNB1 expression in one of the above mentioned figures. MYC (i.e c – MYC) is known to be over expressed in colorectal cancer cases mainly due to the activation of TCF – 4 transcription factor via intra nuclear binding of β-catenin (He et al.80), either by APC mutations (Korinek et al.81) or β-catenin mutations (Morin et al.82). The sensitivity of MYC increased monotonically but after the 6^th^ hour it dropped significantly. Probably MYC does not play important role at later stages. As found in Hino et al.83 and You et al.84, DVL family interacts with the frizzled FDZ members leading to disassembly of the β-catenin destruction complex and subsequent translocation of β-catenin to the nucleus. Development on DVL family have been extensively recorded in González-Sancho et al.85 and86, and significance of DVL1 in Taiwanese colorectal cancer in Huang et al.87. DVL1 shows a marked increase in sensitivity as the concentration of the WNT3A increases in time. This is supported by the fact that ligand binding at the membrane leads to formation of complex including DVL1, FZD and AXIN.
Negative regulators like SFRP4 were found to have lower sensitivity as WNT3A concentration increases, but remained constant for most period. Meanwhile the significance of Wnt antagonist SFRP1 (Galli et al.88, Suzuki et al.89 and Caldwell et al.90) decreases over the period as the concentration of WNT3A increases. Chinnadurai91 reviews the co-repressor ability of the CTBP family, while Hamada and Bienz92 shows CTBP as a binding factor that interacts with APC thus lowering the availability of free nuclear β-catenin. This interaction is further confirmed in the recent research work by Schneikert et al.93. As shown by Yokoyama et al.79 CTBP1 showed increased sensitivity with increased stimulation of WNT3A in the first hour. The latter stages show a decreased contribution of CTBP1 as the concentration of WNT3A was increased. This is in line with what Gujral and MacBeath17 show in their manuscript and indicate the lowering of the co-repressor effect of CTBP at later stages. On the other hand, CTBP2 showed reverse behaviour of sensitivity in comparison to CTBP1 across different time points. Increased significance of CTBP2 was observed in the first two time frames, i.e after 1^st^ and 3^rd^ hour of stimulation, followed by lower contribution to the pathway at the latter stages. In both cases, the diminishing co-repressive nature of CTBP in time is observed. Contrary to these finding, recent results in Patel et al.94 suggest that both CTBP1 and CTBP2 are up-regulated in colon cancer stem cells.
PORCN showed less sensitivity in the initial stages than in final stages indicating its importance in the contribution to Wnt secretion which is necessary for signaling (Willert and Nusse95). The sensitivity of GSK3β and APC decreased in time indicating the lowering of its significance in later stages due to no formation of the degradation complex. Activity of TCF gains greater prominence in the first and the second time frames after the initial WNT3A stimulation. This is in conjugation with the pattern showed by CTBP2. Regarding TCF7L2, the activity is observed to be maximum during the first time frame with decrease in the contribution in the later time frames.
Indicies for remaining 57 genes as well as analysis of the same will be presented in the following B part of this manuscript. Graphs for these 57 genes have been presented in figures 29 and 30 in Appendix.
The logarithmic psychophysical law
5.2
In a recent development, Goentoro and Kirschner64 point to two findings namely, • the robust fold changes of β-catenin and • the transcriptional machinery of the Wnt pathway depends on the fold changes in β-catenin instead of absolute levels of the same and some gene transcription networks must respond to fold changes in signals according to the Weber’s law in sensory physiology. In an unpublished work by Sinha96, preliminary analysis of results in Sinha19 shows that the variation in predictive behaviour of β-catenin based transcription complex conditional on gene evidences follows power and logarithmic psychophysical law crudely, implying deviations in output are proportional to increasing function of deviations in input and showing constancy for higher values of input. This relates to the work of Adler et al.97 on power and logarithmic law albeit at a coarse level. A description of these laws ensues before the analysis of the results.
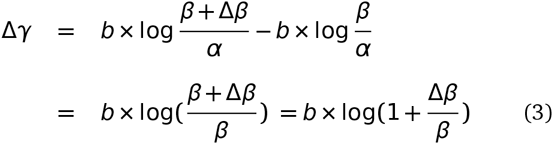
Masin et al.98 states the Weber’s law as follows - Consider a sensation magnitude γ determined by a stimulus magnitude β. Fechner99 (vol 2, p. 9) used the symbol Δγ to denote a just noticeable sensation increment, from γ to γ + Δγ, and the symbol Δβ to denote the corresponding stimulus increment, from β to β + Δβ. Fechner99 (vol 1, p. 65) attributed to the German physiologist Ernst Heinrich Weber the empirical finding Weber100 that Δγ remains constant when the relative stimulus increment [eqn] remains constant, and named this finding Weber’s law. Fechner99 (vol 2, p. 10) underlined that Weber’s law was empirical. ■
It has been found that Bernoulli’s principle (Bernoulli101) is different from Weber’s law (Weber100) in that it refers to Δγ as any possible increment in γ, while the Weber’s law refers only to just noticeable increment in γ. Masin et al.98 shows that Weber’s law is a special case of Bernoulli’s principle and can be derived as follows - Equation 2 depicts the Bernoulli’s principle and increment in sensation represented by Δγ is proportional to change in stimulus represented by Δβ. [eqn] were b is a constant and α is a threshold. To evaluate the increment, the following equation 3 and the ensuing simplification gives -
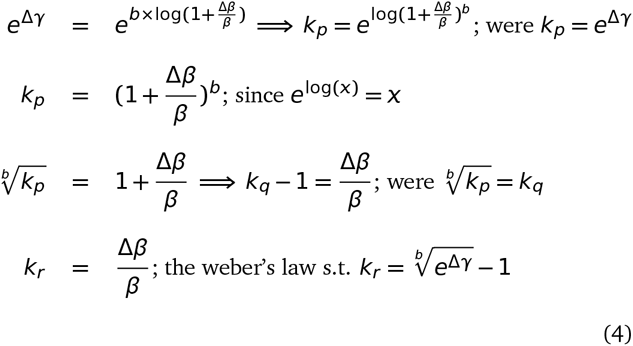
Since b is a constant, equation 3 reduces to [eqn] were o means "is constant when there is constancy of from Masin et al.98. The final reduction is a formulation of Weber’s laws in wordings and thus Bernoulli’s principles imply Weber’s law as a special case. Using Fechner99 derivation, it is possible to show the relation between Bernoulli’s principles and Weber’s law. Starting from the last line of equation 3, the following steps yield the relation -
The reduction [eqn] holds true given the last line of equation 4. By observation, it is important to note that the deviation Δ in the stimulus β plays a crucial role in the above depicted formulations. In the current study, instead of computing the sensitivity of the laws for each involved factor, the sensitivity of the deviations in the fold changes of each factor is taken into account. This is done in order to study the affect of deviations in fold changes in time as concentrations of WNT3A changes at a constant rate. Without loss of generality, it was observed over time that most involved factors had sensitivity indices or strength of contributions, parts or whole of whose graphs follow a convex or a concave curvature. These are usually represented by either an exponentially increasing or decreasing curve or nonlinear curves. This points towards the fact that with increasing changes in stimulated concentration of WNT3A the deviations in fold changes of an involved factor behave either in an increasing or decreasing fashion. Thus deviations in fold changes of various involved factors does affect the working of the signaling pathway over time. Finally, these deviations approximately capture the difference in fold changes recorded between two time frames and are thus a measure of how much the involvement of a factor affects the pathway due to these differences. This measure of involvement is depicted via the estimated sensitivity indices. The study of deviations in fold changes might help in deciding when a therapeutic drug could be administered in time. Details on the contributions of each involved factor are discussed below.
Analysis of deviations in fold changes
5.3
In comparison to the contributions estimated via the sensitivity indices using fold changes at different times separately, this section analyzes the contributions due to deviations in the fold changes recorded between two time points i.e [eqn]. These analysis are also a way to test the efficacy of deviations in fold changes versus the absolute levels that have been stressed upon in Goentoro and Kirschner64. As with the analysis of the fold changes at different time points, the estimates obtained using the rbf, linear and lapla-cian kernels in the HSIC based sensitivity analysis have been used here. Of these, the rbf and laplacian kernels give almost similar results. Plots of the time series expression profiles from Gujral and MacBeath17 have been relegated to the Appendix.
■ wnt3a - Figure 33 shows the profile of mRNA expression levels of WNT3A after external stimulation. There is a series of (+−++) deviations in the fold change recordings at different time points. A repetitive behaviour is observed in the contribution of the deviations in fold changes for WNT3A estimated via the sensitivity indices. For intervals in t1, t3 and t6 there is an increase in the significance of the contribution of WNT3A in figure 10 (see the first two bars for <t1, t3 > & <t3, t6>), even though in the first three time frames levels of WNT3A are shown to be down-regulated (see figure 33). This behaviour is again repeated in figure 10 for intervals t6, t12 and t24 (see the next two bars for <t6,t12> & <t12,t24>). In both cases one finds an increase in the contribution of the deviation in the fold change. Comparing the contribution of levels of fold changes in figure 8 were it was found that there is a dip in contribution of WNT3A after t3 and then a further increase in the contribution at a latter time frame, one finds that the deviations in fold changes involving <t1,t3> & <t3,t6> have higher significance than the deviations in fold changes involving <t6,t12> & <t12,t24>. It can be noted that even in the deregulated state from <t1, t3 and t6> the deviations are minimal and the contributions are significantly high. In case of the regulated states from <t6, t12 and t24> the deviation is extremely high between the first two time frames and low in the next two. This results in greater significant contribution in the latter deviation than the former deviation. Thus when deviations are low and the fold changes over time do not vary much, the contributions of the involved factor to the signaling pathway is expected to be high and vice versa. This points to the fact that low variations in fold changes over time have a stablizing influence of WNT3A rather than abrupt high variations in fold changes that might not have the same influence. Thus measur-ments of deviations in fold changes provide greater support for studying the affect of WNT3A over time.
■ ctnnb1 - Figure 34 shows the profile of mRNA expression levels of CTNNB1 after external stimulation. There is a series of (++−+) deviations in the fold change recordings at different time points. An initial increase in the influence of CTNNB1 is observed from <t1,t3> to <t3,t6> (first two bars in figure 10) followed by a gradual decrease of influence from <t3,t6> to <t6,t12> to <t12,t24> (last three bars in figure 10). This is observed even though there is an up-regulation in levels of CTNNB1 with a slight dip at t12 (see figure 34). In comparison to the contribution of levels of fold changes in figure 8 were it was found that there is a gradual decrease in the influence of CTNNB1 till t6 and then a further increase in the contribution at latter time frames, one finds that the deviations in fold changes involving <t3,t6> have the highest significance with an almost exponential decrease in the deviations in fold changes involving <t6,t12> & <t12,t24>. Even though in a regulated state the influence of deviations in the fold changes indicate a different scenario altogether in comparison to influences of fold changes at distinct time frames. This might point to the fact that the affect of CTNNB1 is maximum during <t3,t6> in comparison to other stages even after constantly increasing external stimulation with WNT3A at different time points. Exponential decrease in the influence in the deviations in latter time frames points to the ineffectiveness of CTNNB1 in the pathway at later stages. Finally, in contrast to the behaviour of influence of WNT3A in the foregoing paragraph, CTNNB1 showed higher (lower) influence for greater (lesser) deviations in fold changes.
■ apc - Figure 35 shows the profile of mRNA expression levels of APC after external stimulation. The profile of the deviations of APC in a deregulated state show the following (−++−) pattern. While the CTNNB1 expression profile shows non-monotonic increase in levels of fold changes in upregulated state, APC expression profile shows a nonlinear behaviour in levels of fold changes in down regulated state. The significance of deviation in fold changes for APC is maximum during <t3,t6> when the down-regulation is weakened. Further weaking of the downregulation during <t6,t12> does not have much significance. This attenuation in significance of deviations in fold change might support the fact that A PC’s weaking in downregulation amplifies shutting down of the Wnt pathway after the intial strong downregulation (where Wnt activity is high). This is corroborated by the finding of Gujral and MacBeath17 which observes the initial (later) positive (negative) feedback that strenghtens (weakens) the Wnt pathway activity. An initial increase in the influence of APC is observed from <t1,t3> to <t3,t6> (first two bars in figure 10) followed by a gradual decrease of influence from <t3,t6> to <t6,t12> to <t12,t24> (last three bars in figure 10). This is observed even though there is an down-regulation in levels of APC with slight weaking at t6, t12 and t24 in comparison to recordings at other time frames (see figure 35). In comparison to the contribution of levels of fold changes in figure 8 where it was found that there is a gradual decrease in the influence of APC till t6 and then a further increase in the contribution at latter time frames, one finds that the deviations in fold changes involving <t3,t6> have the highest significance with an almost exponential decrease in the deviations in fold changes involving < t6,t12 > & <t12,t24>.
Column wise - methods to estimate sensitivity indices. Row wise - sensitivity indicies for each gene on deviations in fold change. For each graph, the bars represent sensitivity indices computed at <t1,t2> (red), <t2,t3> (blue), <t3,t4> (green) and <t4,t5> (gray). Indices were computed using non scaled time series data. TO - total order; FO -first order; SBL - Sobol
Column wise - methods to estimate sensitivity indices. Row wise - sensitivity indicies for each gene on deviations in fold change. For each graph, the bars represent sensitivity indices computed at <t1,t2> (red), <t2,t3> (blue), <t3,t4> (green) and <t4,t5> (gray). Indices were computed using non scaled time series data. TO - total order; FO -first order; SBL-Sobol
■ myc - Figure 36 shows the profile of mRNA expression levels of MYC after external stimulation. The profile of the deviations in fold changes of MYC in an up-regulated state show the following (−+++) pattern. After an initial dip in the up-regulation at t6 there is an exponential increase in the fold changes of MYC as time progresses. While figure 8 shows an increasing sensitivity of MYC for the first three time frames, later up-regulated state of MYC due to increasing WNT3A stimulations do not hold much significance. In contrast, it is not possible to observe a pattern in the sensitivity of deviations in fold changes for MYC except for the fact that the maximum contribution of deviation in fold change is observed for the period of < t6, t12 >. This is a period when MYC’s significance in the pathway is maximum.
■ gsk3b - Figure 37 shows the profile of mRNA expression levels of GSK3β after external stimulation. The profile of the deviations in fold changes of GSK3β in an varied regulated state show the following (−+++) pattern. After an initial up-regulation at t3 there is down regulation at t6 before which up-regulation follows for latter stages. It is widely known that WNT stimulation leads to inhibition of GSK3β. In contrast to this regard GSK3β shows a up-regulated levels at t3, t12 and t24. The author is currently unaware of why this contasting behaviour is exhibited. Later upregulation might point to the fact that the effectiveness of Wnt stimulation has decreased and GSK3β plays the role of stabilizing and controlling the behaviour of the pathway by working against the Wnt stimulation and preventing further degradation. While work by Gujral and MacBeath17 does not shed light on this aspect, contrasting models of inhibitions for GSK3 has been recently proposed in Metcalfe and Bienz102 which might support this behaviour. Figure 8 shows an decreasing sensitivity of GSK3β for the first two time frames, after which there is an increasing sensitivity for the next three time frames. Comparing this with plots in figure 10 it is found that there is greater significance of deviations in fold changes of GSK3β during later stages of <t6,t12> and <t12,t24>.
■ porcn - Figure 38 shows the profile of mRNA expression levels of PORCN after external stimulation. The profile of the deviations in fold changes of PORCN in an up regulated state show the following (+−−−) pattern. After an initial hike in up-regulation at t3 there is continuous decrease in the up regulation. PORCN is known to help in the secretion of the Wnt ligands that later on help in the instigation of the signaling activity. Sustanined stimulation by WNT3A over a period of time might lead to decrease in the up regulation of PORCN which helps in Wnt secretion. Graph for PORCN in figure 8 shows increasing significance of the influence of PORCN as time passes, even though there is lower regulation of the same at later stages (fig 38). The highly significant influence of lower regulation at later stages indicates the lessened effectiveness of PORCN due to sustained WNT3A stimulation that might have suppressed the functionality of secretion carried out via PORCN. Contrary to this, the influences of the deviations in the fold changes over time show the reverse behaviour. The maximum influence is during the first two time frames of <t1,t3> and this influence of deviations decreases at later stages. This points to the fact that the deviations in the fold changes at intial stage has greater significance in the pathway than the deviations at later stages. It follows that in initial stages of Wnt stimulation the expression of PORCN has significant influence.
■ ctbp2 - Figure 39 shows the profile of mRNA expression levels of CTBP2 after external stimulation. The profile of the deviations in fold changes of CTBP2 in an up regulated state show the following (−++−) pattern. It is known that CTBP2 shows co-repressive nature and the pattern of sensitivity indicates this heigthened effect at <t3,t6> and <t12, t24>. In contrast to this in figure 8 one finds that the significance of upregulation at t12 and t24 is minimal and yet the sensitivity for the deviations in fold changes for this period is second to <t3, t6>. The probable explanation for this might be that for higher upregulation (in terms of numeric representations), even small deviations might play a sigificant role while the sensitivity at individual time frames remains low.
■ ctbp1 - Figure 40 shows the profile of mRNA expression levels of CTBP1 after external stimulation. The profile of the deviations in fold changes of CTBP1 in an up regulated state show the following (+++−) pattern. As with the heightened sensitivity at time frame t1 the sensitivity of deviations in the fold changes exhibits heightened effect in the pathway at <t1, t3>. Further analysis might not be possible as one finds lowered sensitivity even at heightened up regulation for individual recordings as well as deviations.
■ sfrp4 - Figure 41 shows the profile of mRNA expression levels of SFRP4 after external stimulation. The profile of the deviations in fold changes of SFRP4 in an down regulated (except in the last time frame) state show the following (−+++) pattern. Known to be a negative regulator of the Wnt pathway, it was found that its sensitivity in extremely high as it is down regulated during the stimulation. This is depicted in the figures plotted in 8. This heightened sensitivity during most of the down regulation points towards the significant role of hypermethylation that leads to silencing of this gene. Contrary to this, there is a monotonically increasing sensitivity for deviations in the fold changes during down regulation from t1 to t12. A dip in the sensitivity of the deviation for the final time frame < t12, t24 > happens when the up regulation is recorded in the last time frame. Based on the maximum sensitivity for deviation in fold change during <t6, t12>, up regulation of SFRP4 in this period is expected to have greatest reverse effect on the activation of the Wnt pathway. It appears that the hypermethylation that causes the silencing of the SFRP4 is maximal during this stage and thus a potential period for the pathway to be inhibited via reversal of silencing (Suzuki et al.89).
■ sfrp1 - Figure 42 shows the profile of mRNA expression levels of SFRP1 after external stimulation. The profile of the deviations in fold changes of SFR P4 in an up regulated (except in during the second time frame) state show the following (−+−−) pattern. It is widely known that SFRP1 is a Wnt antagonist and is known for inactivation in the canconical Wnt pathway due to hypermethylation thus leading to upregulation of the pathway (Caldwell et al.90). Suzuki et al.89 further indicates that SFRP1 is thought to silence ligand-dependent Wnt signaling by binding of the cysteine rich-domain (CRD) to Wnt proteins, thus preventing interaction with FRZ receptors. Recent in silico results by Kim and Kim103 confirm hypermethylation of SFRP1 in colorectal cancers. Given the above profile, it is possible to see that there is a down regulation at t3 but the significance of its influence on the pathway is not much as revealed in figure 9. Figure 9 shows a decreasing significance in the influence of the SFRP1 with the maximum influence in the last stage of the WNT3A stimulation, where there is an up regulation. In similar way, in figure 11 there is significance of the sensitivity in the deviations in fold changes during the up regulation of SFRP1 during the <t6, t12> and <t12,t24>. The activation at later stages show that SFRP1 has a greater antagonistic effect on the Wnt pathway. In comparison to up regulation, one finds the down regulation at t3 does not play a significant role. These are in line with Gujral and MacBeath17’s claim regarding reversal of behaviour at different time stages.
■ dvl1 - Figure 43 shows the profile of mRNA expression levels of DVL1 after external stimulation. The profile of the deviations in fold changes of DVL1 in an up regulated state show the following (−++−) pattern. DVL1 is an adaptor protein that helps in signal transmission that leads to stabilization of cytosolic β-catenln for further processing. Huang et al.87 report high expression of DVL1 in Taiwanese colorectal cancer patients with liver metastasis and it has also been observed as a potential biomarker in CRC (Wu et al.104). In figure 9 the time frame t12 at which DVL1 shows maximum up regulation is the most insignificant one due to the lowest sensitivity while moderate upregulation during t3 and t6 show high sensitivity. The same is true for upregulation at t24. Comparing this with the deviations in the fold changes in 11, one finds that there is maximum sensitivity during the period of <t3, t6> preceeded by a lower sensitivity index for the perioud of < t1, t3 >. At other intervals there was a decreased sensitivity even though the deviations in the fold changes were very high. This indicates that the high deviations might not influence the signaling activity significantly. Also the best period of intervention is at <t3, t6>.
■ lrp6 - Figure 44 shows the profile of mRNA expression levels of Lrp6 after external stimulation. The profile of the deviations in fold changes of Lrp6 in an up regulated state (except at t3) show the following (−++−) pattern. In an extensive work on the molecular differences of LRPs MacDonald et al.105 investigate and show that LRP5/6 along with the frizzled family members form a Wnt inducible co-receptor complex that helps in signal transmission after LRP phosphorylation. Earlier wet lab work by Liu et al.106 and in silico findings by Watanabe et al.107 have shown highly expressed participation of LRP5/6 in Wnt signaling pathway. Latest work by Lemieux et al.108 shows that KRAS signaling promotes canonical Wnt activity via LRP6. In figure 9, LRP6 shows significant influences during the t1, t6 and t12. The only period in which it is down regulated during t3 has little significance in comparison to the significance of the up regulated states. It is not known why LRP6 shows down regulation at this stage. Finally, for unkown reasons, the influence of LRP6 during t12 was found to be the lowest. It was not possible to read into the sensitivity of LRP6 for deviations in fold changes the HSIC based indices. The laplace kernel shows a pattern of increasing sensitivity with the heightest during < t6, t12 >. But this is not so in the other two formulations. Thus wet lab experiments might aid in confirming these results and shedding more light on the duration during which a drug could be administered.
■ tcf7l16 - Figure 45 shows the profile of mRNA expression levels of TCF7L1 (also known as TCF3) after external stimulation. The profile of the deviations in fold changes of TCF7L1 in a down regulated state (except at t3) show the following (+−+−) pattern. It is known that Wnt stimulation promotes the phosphorylation of repressor-acting TCF7L1 by homeodomain-interacting protein kinase (HIPK2), which results in its dissociation from the WRE (Hikasa and Sokol109). Gujral and MacBeath17’s results also indicate the same repression of TCF7L1 during WNT3A simulation as shown in figure 45. But in contradiction to this recent findings of Leushacke et al.110, TCF7L1 is found to be expressed in the colon crypt and in colon cancer. Their results indicate that TCF7L1 may have an as yet unidentified role in transmission of tumor-related β-catenin signals. Evidence of this up regulation is found at t3 time period as shown in figure 45. From figure 9 it can be seen that the sensivi-tiy of TCF7L1 is maximum during the first time period. Later on the sensitivity subsides as time passes untill the sensitivity shots up in the last time frame t24. In comparison to this with respect to the deviations in fold changes over time in figure 11, <t1,t3> showed the maximum period of influence. Later on there is a drop in the sensitivity which is followed by an approximately mono-tonic increase. It is the first transition from down regulation to up regulation <t1, t3> that might be the time for intervention. Also the last stage might be of some value but during down regulation only.
■ tcf7 - Figure 46 shows the profile of mRNA expression levels of TCF7 after external stimulation. The profile of the deviations in fold changes of TCF7 in an up regulated state show the following (−−++) pattern. TCF7 is found to be regulated upon Wnt stimulation as it binds with LEFs to activate the transcription procedure after interacting with β-catenin Cadigan and Waterman111. In figure 9, the sensitivity of the activation of TCF7 decreases monotonically as time progresses. But this behaviour is not the same for deviations in the fold changes. The maximum influence is found for the duration of <t6, t12>. The next best consistent influence is in the duration <t12, t24>. These are the two time periods when the influence of the deviations in the fold changes is maximum and thus susceptible to therapeutic interference.
■ lef1 - Figure 47 shows the profile of mRNA expression levels of LEF1 after external stimulation. The profile of the deviations in fold changes of LEF1 in an up regulated state (except at t31 show the following (−−++) pattern. Generally, LEF1 is found to be up regulated upon Wnt stimulation when it works in tandem with TCF7 Cadigan and Waterman111. Yet, in figure 9, the sensitivity of the activation of LEF1 is not similar to that of TCF7. In contradiction to what is observed, one finds a down regulation during the time period t3. More importantly this is the period in which the most significant influence of down regulated LEF1 is observed. The Initial down regulation at this subinterval indicates that LEF1 is not facilitating the Wnt pathway positiviely Conclusive results cannot be stated regarding the deviations in fold changes from figure 11.
■ fzd2 - Figure 48 shows the profile of mRNA expression levels of FZD2 after external stimulation. The profile of the deviations in fold changes of FZD2 in an up regulated state (except at t3 and t6) show the following (−−++) pattern. The FZD or the frizzled family of 7-transmember protein (Ueno et al.74) works in tandem with LRP-5/6 as binding parameters for the Wnt ligands to initiate the Wnt signaling. In comparison to the repetitive behavior shown in figure 9 it is not possible to draw conclusions on the deviations in fold changes.
■ fzd1 - Figure 49 shows the profile of mRNA expression levels of FZD1 after external stimulation. The profile of the deviations in fold changes of FZD1 in an down regulated state (except at t3) show the following (+−−+) pattern. Consistent with the findings of Holcombe et al.75 and Planutis et al.76, FZD1 was found to be expressed at t3. In the rest of the time periods, it was down regulated. But the significance of the influence shows a different pattern in figure 9 with the down regulation at t12 being the most influencial. In contrast to this, while observing the deviations in the fold changes, it was found that the first two durations <t1,t3> and <t3, t6> showed consistent decreasing behaviour in terms of influence. It is during the first period that the deviations in fold changes are significant and thus it is possible to intervene therapeutically during the activation stage.
Indicies for remaining 57 genes as well as analysis of the same will be presented in the following B part of this manuscript. Graphs for these 57 genes have been presented in figures 31 and 32 in the Appendix.
Conclusion
6
COMPUTATIONAL SIGNIFICANCE
Local and global sensitivity analysis on static and time series measurements in Wnt signaling pathway for colorectal cancer is done. Density based Hilbert-Schmidt Information Criterion indices outperformed the variance based Sobol indices. This is attributed to the employment of distance measures & the kernel trick via Reproducing kernel Hilbert space (RKHS) that captures nonlinear relations among various intra/extracellular factors of the pathway in a higher dimensional space. The gained advantage is confirmed on the inferred results obtained via a Bayesian network model based on prior biological knowledge and static gene expression data. In time series data, using these indices it is now possible to observe when and in which period of time and to what degree a factor gets influenced & contributes to the pathway, as changes in concentration of the another factor is made. This facilitates in time based administration of target therapeutic drugs & reveal hidden biological information within colorectal cancer samples.
DEVIATIONS IN FORMULATION OF PSYCHOPHYSICAL LAW
In context of Goentoro and Kirschner64’s work regarding the recent development of observation of Weber’s law working downstream of the pathway, it has been found that the law is governed by the ratio of the deviation in the input and the absolute input value. More importantly, it is these deviations in input that are of significance in studing any phemomena. The current manuscript explores the sensitivity of deviation in the fold changes between measurements of fold changes at consecutive time points to explore in what duration of time i.e < ti, ti__+1 >, a particular factor is affecting the pathway in a major way. This has deeper implications in the fact that one is now able to observe when in time an intervention can be made or a gene be perturbed to study the behaviour of the pathway in tumorous cases. Thus sensitivity analysis of deviations in mathematical formulations of the psychophysical law can lead to insights into the time period based influence of the involved factors in the pathway. This will also shed light on the duration in which the psychophysical laws might be most prevalent.
SPECIFIC EXAMPLES OF BIOLOGICAL INTERPRETATIONS
gsk3β - It is widely known that WNT stimulation leads to inhibition of GSK3β. In contrast to this regard GSK3β shows a up-regulated levels at t3, t12 and t24. The author is currently unaware of why this contasting behaviour is exhibited. Later up-regulation might point to the fact that the effectiveness of Wnt stimulation has decreased and GSK3β plays the role of stabilizing and controlling the behaviour of the pathway by working against the Wnt stimulation and preventing further degradation. While work by Gujral and MacBeath17 does not shed light on this aspect, contrasting models of inhibitions for GSK3 has been recently proposed in Metcalfe and Bienz102 which might support this behaviour. Considering analysis of fold changes at different time points, decreasing sensitivity of GSK3β was observed for the first two time frames, after which there is an increasing sensitivity for the next three time frames. Comparing this with plots of analysis of deviations in fold changes, it is observed that there is greater significance of deviations in fold changes of GSK3β during later stages of < t6, t12 > and < t12, t24 >. It is in these periods that one might be able to pertube and study significant affects on the pathway.
porcn - PORCN is known to help in the secretion of the Wnt ligands that later on help in the instigation of the signaling activity. Sustanined stimulation by WNT3A over a period of time might lead to decrease in the up regulation of PORCN which helps in Wnt secretion. Graph for PORCN in analysis of fold changes shows increasing significance of the influence of PORCN as time passes, even though there is lower regulation of the same at later stages. The highly significant influence of lower regulation at later stages indicates the lessened effectiveness of PORCN due to sustained WNT3A stimulation that might have suppressed the functionality of secretion carried out via PORCN. Contrary to this, the influences of the deviations in the fold changes over time show the reverse behaviour. The maximum influence is during the first two time frames of < t1,t3 > and this influence of deviations decreases at later stages. This points to the fact that the deviations in the fold changes at intial stage has greater significance in the pathway than the deviations at later stages. It follows that in initial stages of Wnt stimulation the expression of PORCN has significant influence.
The reference list from the paper itself. Each links out to its DOI / PubMed record.
- 1R. Sharma, Drosophila information service, 1973, 50, 134–134.
- 2L. Thorstensen, G. E. Lind, T. Løvig, C. B. Diep, G. I. Meling, T. O. Rognum and R. A. Lothe, Neoplasia, 2005, 7, 99–108.
- 3R. Baron and M. Kneissel, Nature medicine, 2013, 19, 179–192.
- 4H. Clevers, Cell, 2006, 127, 469–480.
- 5S. Sokol, Wnt Signaling in Embryonic Development, Elsevier, 2011, vol. 17.
- 6D. Pinto, A. Gregorieff, H. Begthel and H. Clevers, Genes & development, 2003, 17, 1709–1713.
- 7Z. Zhong, N. J. Ethen and B. O. Williams, Wiley Interdisciplinary Reviews: Developmental Biology, 2014, 3, 489–500.
- 8N. Pećina-Šlaus, Cancer Cell International, 2010, 10, 1–5.