The Great Migration and African-American genomic diversity
Soheil Baharian, Maxime Barakatt, Christopher R. Gignoux, Suyash Shringarpure, Jacob Errington, William J. Blot, Carlos D. Bustamante, Eimear E. Kenny, Scott M. Williams, Melinda C. Aldrich, Simon Gravel

TL;DR
This study explores how historical migration patterns, like the Great Migration, shaped the genomic diversity of African-Americans across the United States.
Contribution
The study provides a comprehensive assessment of African-American genomic diversity using nationally representative genotype data.
Findings
African ancestry is higher in the southern U.S. compared to the North and West.
Relatedness patterns align with migration routes during the Great Migration.
Ancestry-biased migration explains regional differences in genomic diversity.
Abstract
Genetic studies of African-Americans identify functional variants, elucidate historical and genealogical mysteries, and reveal basic biology. However, African-Americans have been under-represented in genetic studies, and little is known about nation-wide patterns of genomic diversity in the population. Here, we present a comprehensive assessment of African-American genomic diversity using genotype data from nationally and regionally representative cohorts. We find higher African ancestry in southern United States compared to the North and West. We show that relatedness patterns track north- and west-bound routes followed during the Great Migration, suggesting that admixture occurred predominantly in the South prior to the Civil War and that ancestry-biased migration is responsible for regional differences in ancestry. Rare genetic traits among African-Americans can therefore be shared…
Click any figure to enlarge with its caption.
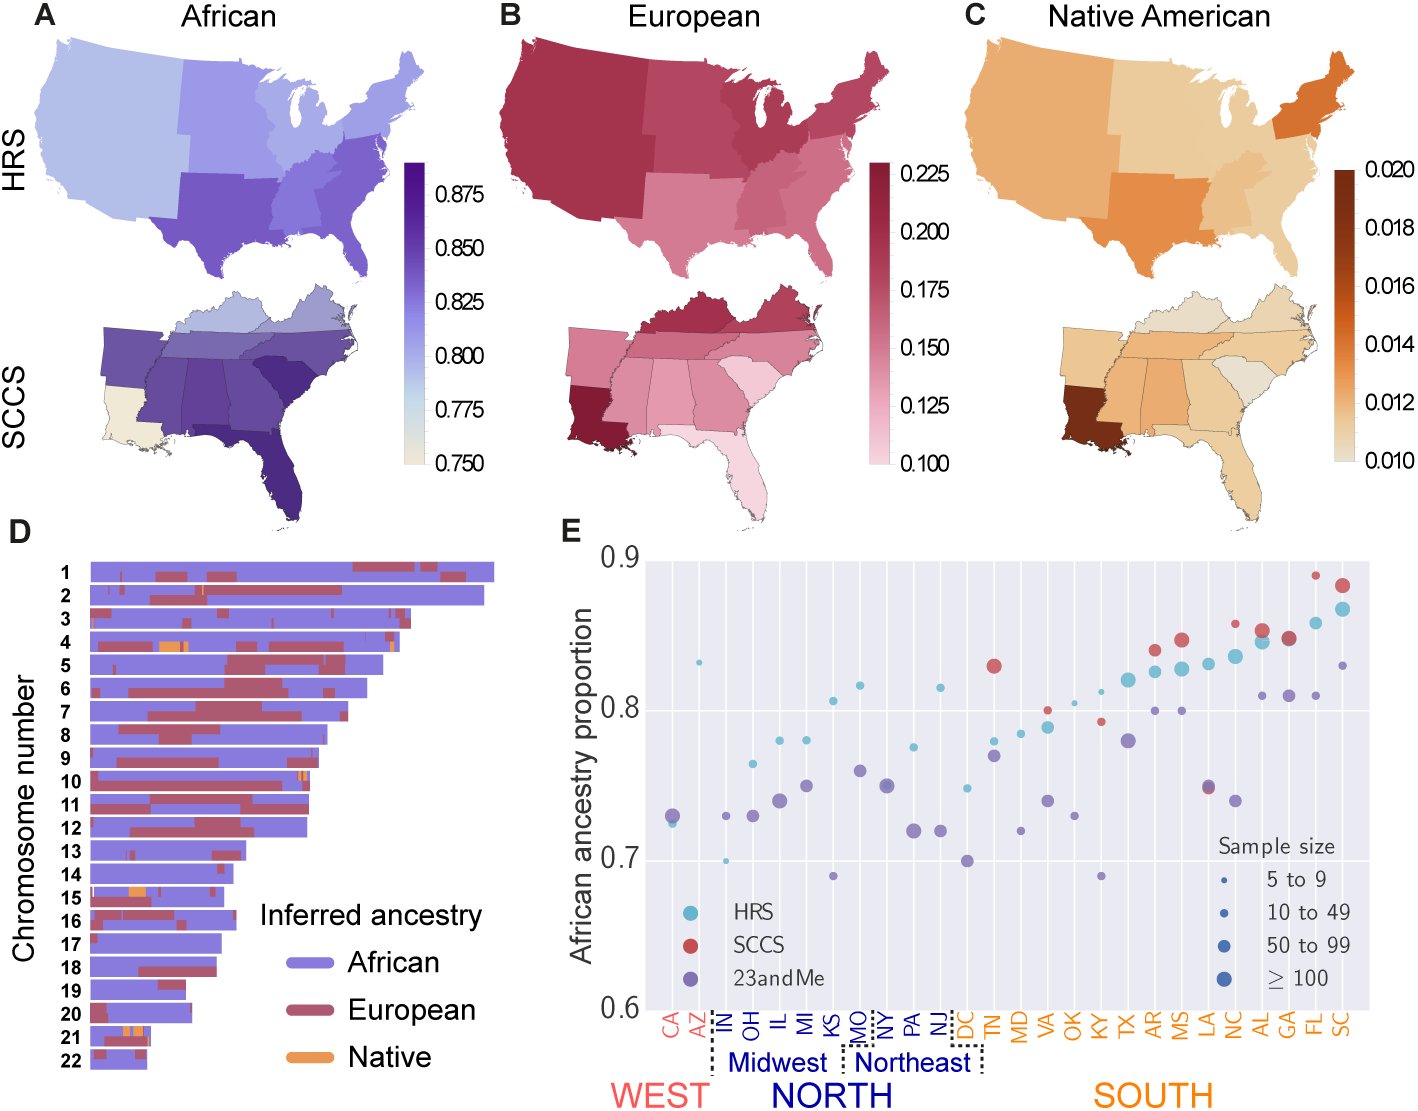 Figure 1
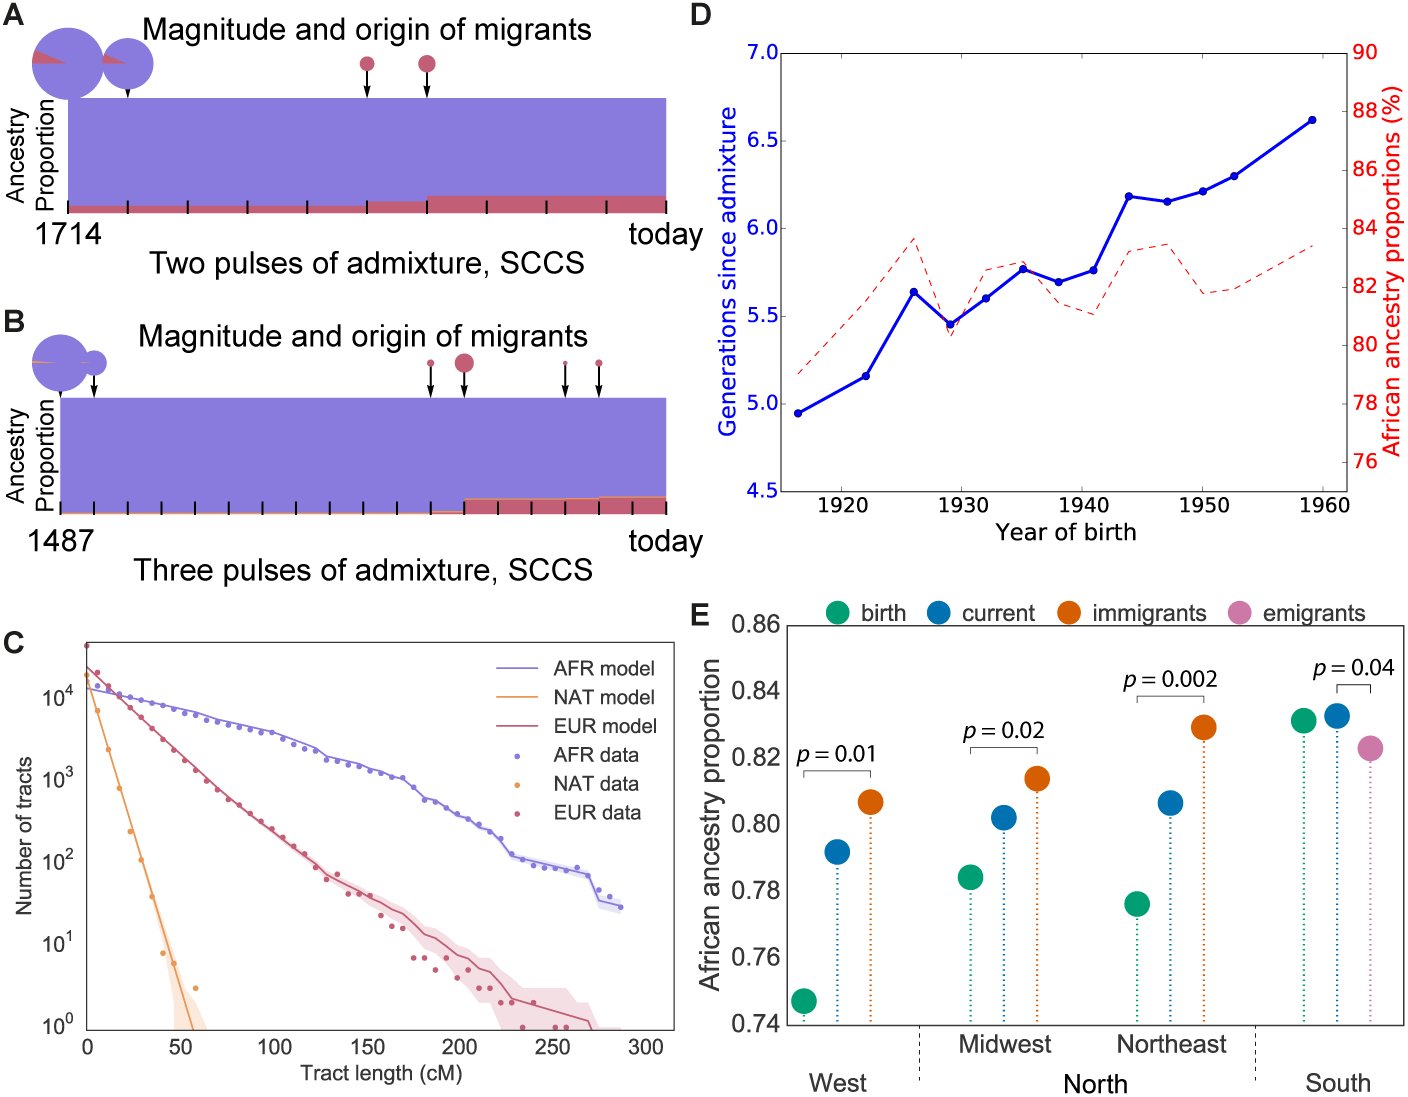 Figure 2
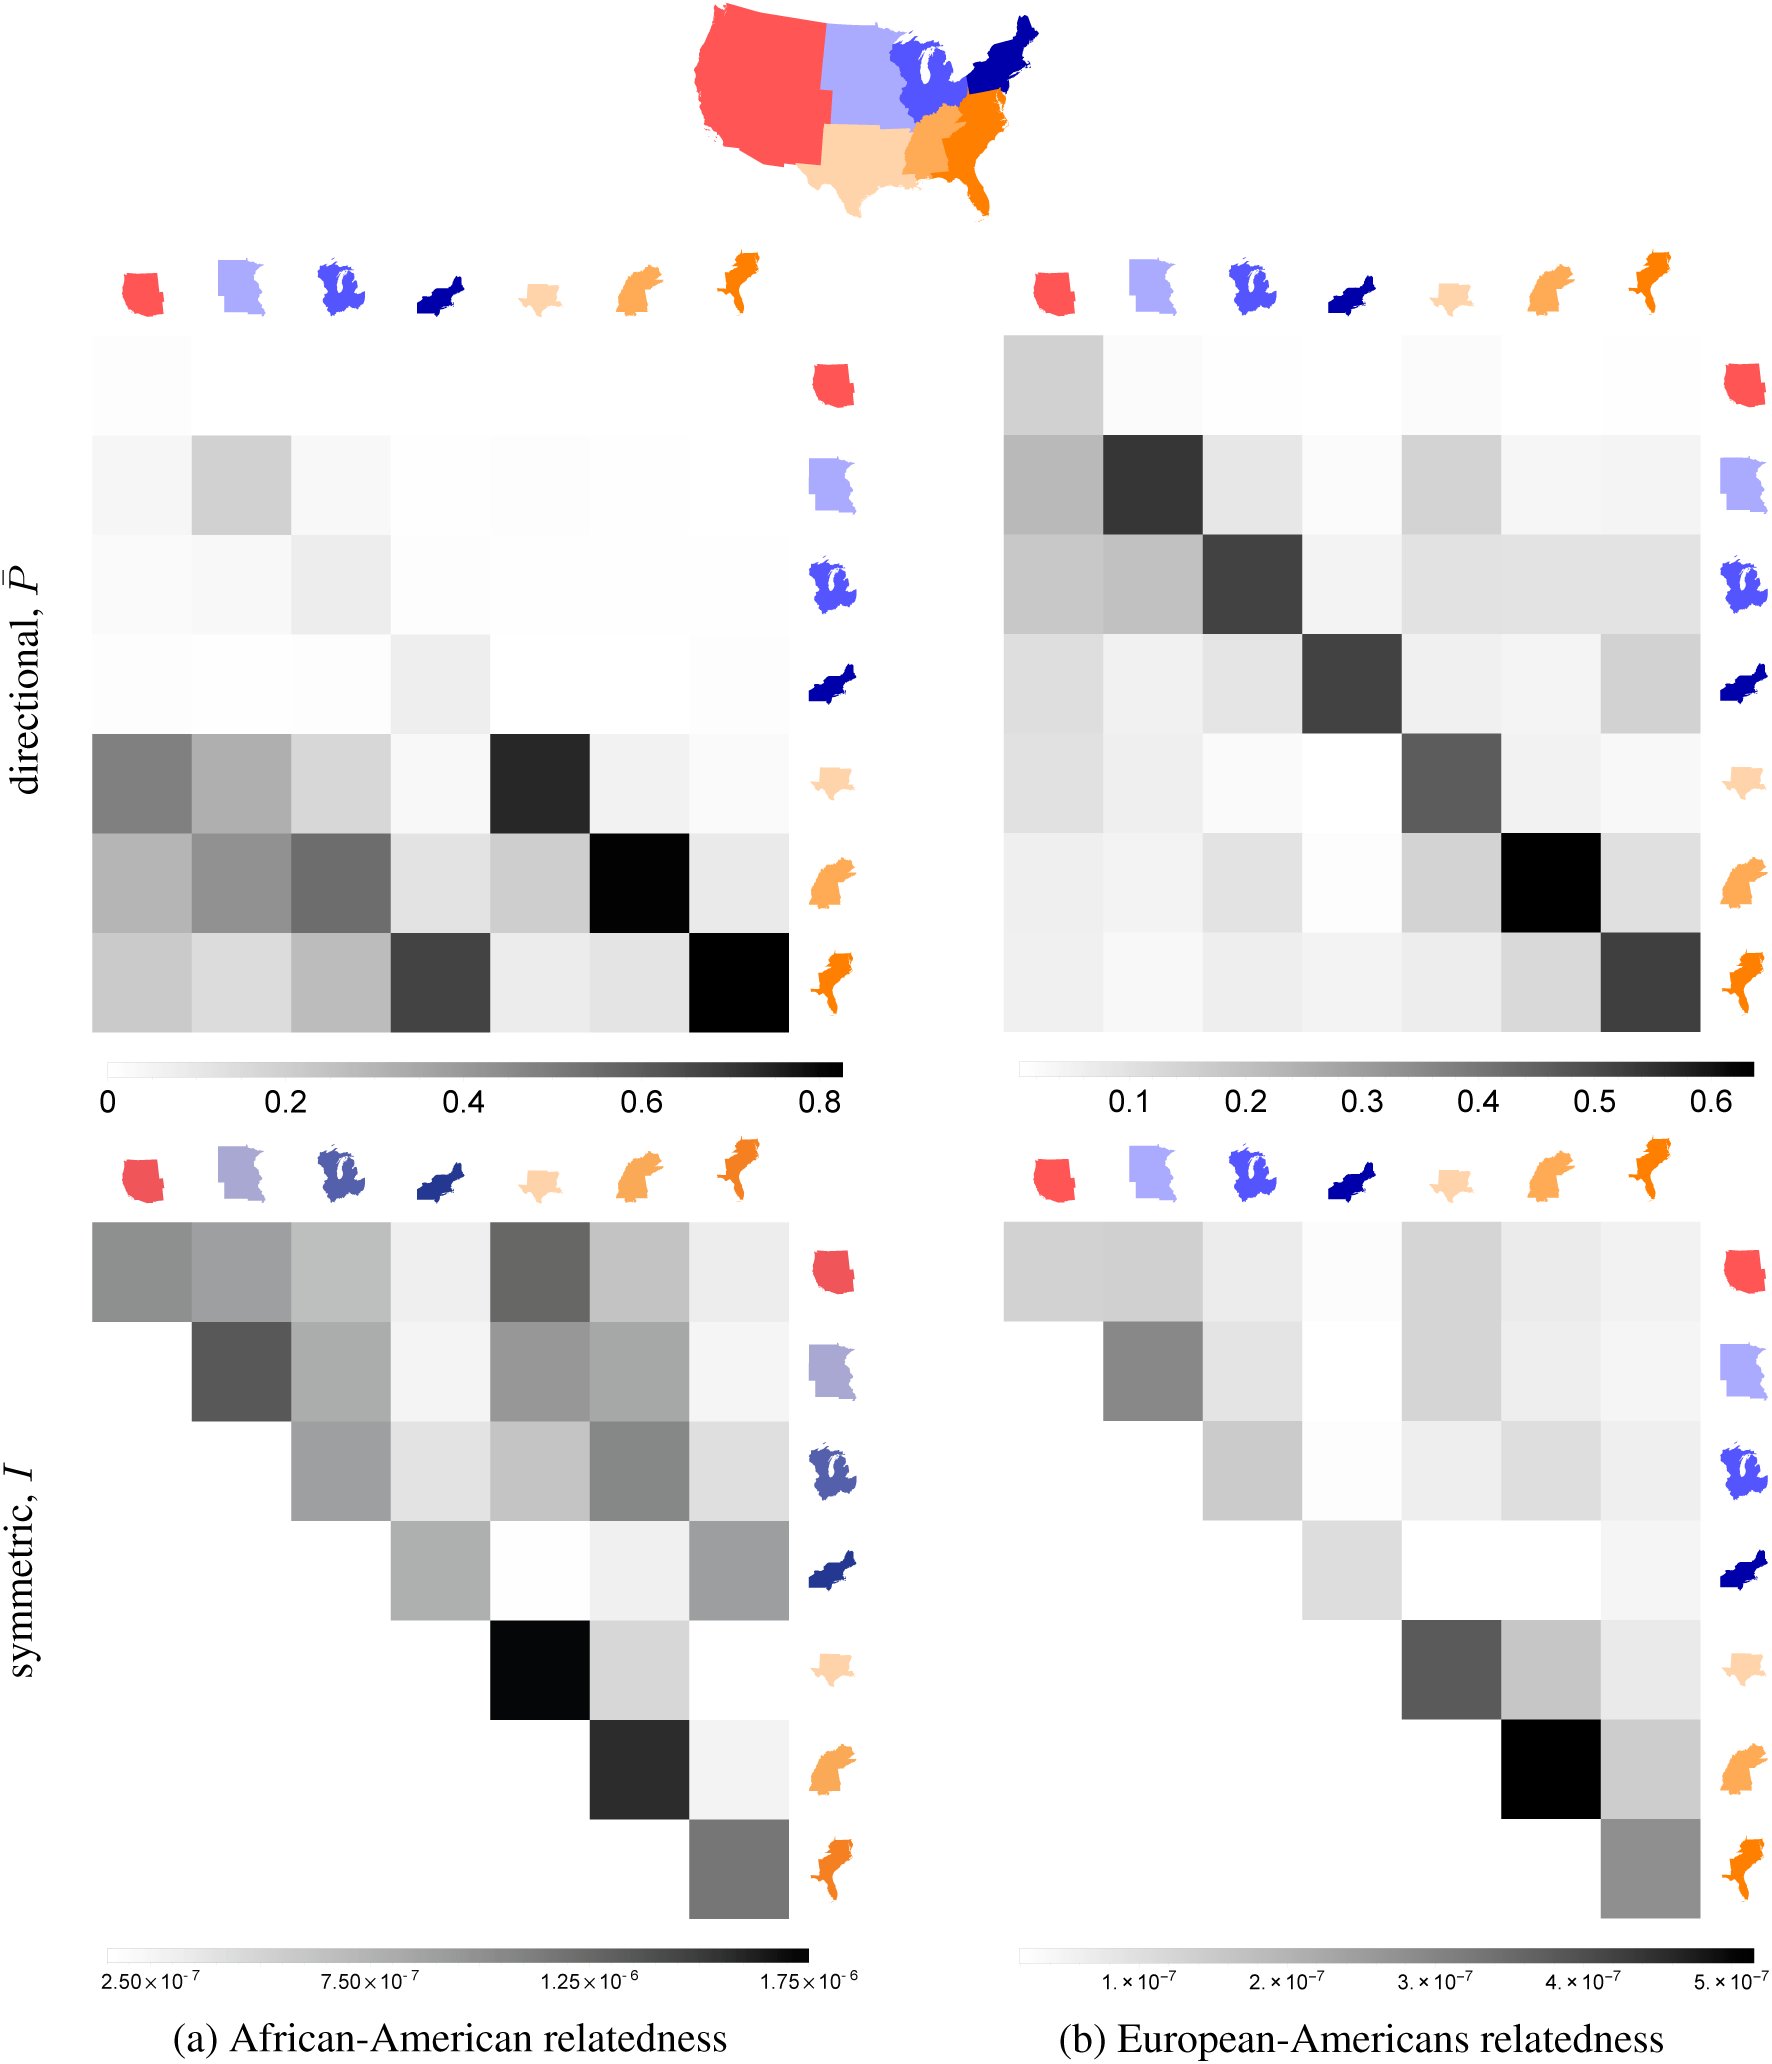 Figure 3




















Peer Reviews
No public reviews on file for this paper yet. If you reviewed it on a platform where reviews are public (OpenReview, ICLR, NeurIPS, ICML), you can paste yours below so the community can read it here.
Videos
No videos yet. Explain this paper in a talk, walkthrough, or lecture? Add one.
Taxonomy
TopicsGenetic Associations and Epidemiology · Genetic and phenotypic traits in livestock · Genetic Mapping and Diversity in Plants and Animals
Introduction
The history of African-American populations is marked by dramatic migrations within Africa, through the transatlantic slave trade, and within the United States (US). By 1808, when the transatlantic slave trade was made illegal in the US, approximately 360,000 Africans had been brought forcibly into the US in documented voyages (1). International and domestic slave trade continued to impose long-distance migration on enslaved African-Americans until the end of the Civil War, in 1865. By 1870, the US census reported 4.88 million “colored” individuals of which 90% lived in the South (2).
Despite the ban on slavery, economic and social perspectives for most African-Americans remained bleak. Better opportunities in the North (Northeast and Midwest) and West led millions of African-Americans to leave the South between 1910 and 1970 (3). This demographic event known as the Great Migration profoundly reshaped African-American communities across the US (4). Today, 45 million Americans identify as Black or African-American.
A history of slavery and of systemic discrimination led to increased social, economic, and health burdens in many African-American communities. Health disparities continue to be compounded by poverty, unequal access to care, and unequal representation in medical research. To reduce health disparity in research, many cohorts are currently being assembled to encompass more of the diversity within the US (5, 6). These cohorts create opportunities in both medical and population genetics; they also require an understanding of genetic diversity within diverse cohorts. However, the large-scale migrations and incomplete genealogical records for African-Americans present a challenge for such an understanding. Previous studies have described the proportions of African, European, and Native American ancestries across individuals (7-13), the amount of diversity in sequence data (9, 14, 15) and inferred admixture models (12, 16, 17). However, the genetic population structure among African-Americans is not well understood.
Here, we use cohorts including 3,726 African-Americans and a total of 13,199 individuals geographically distributed across the contiguous US to investigate nation-wide population structure among African-Americans. We first confirm and refine previous estimates of admixture proportions and timing in the population, and find significant differences in ancestry proportions between US regions. We then investigate relatedness among African-Americans and European-Americans through identity-by-descent analysis, and identify long- and short-range patterns of isolation-by-distance. We introduce quantitative models, incorporating both census data and fine-scale migration, to describe these isolation-by-distance patterns and infer migratory patterns in the population. Integrating quantitative models for admixture, relatedness information, and historical data, we identify ancestry-biased migrations during the Great Migration as a driving force for ancestry and relatedness variation among African-Americans. The analysis of geographically distributed cohorts through detailed mathematical modeling there-fore helps us understand the distribution of genetic diversity in large cohorts and provides new insights into recent human demography.
Cohorts
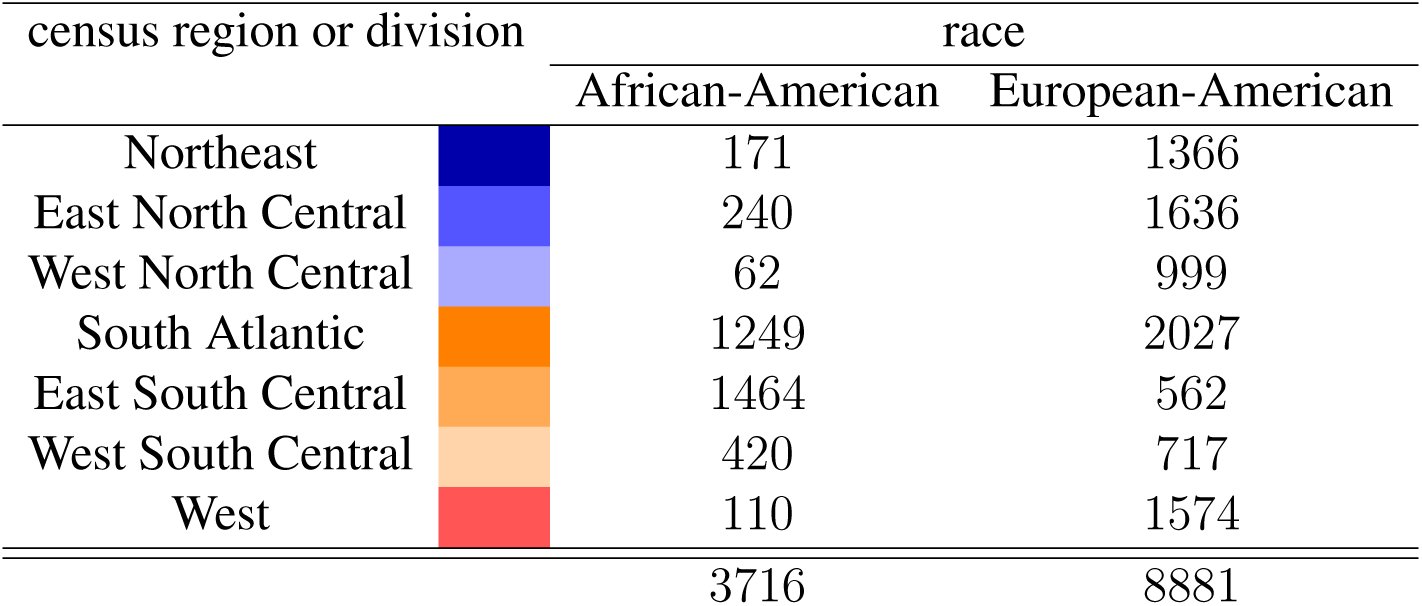
We analyzed data from three cohorts: (a) Health and Retirement Study (HRS), with 1,501 African-Americans and 9,308 European-Americans sampled representatively across all US states, and including urban and rural regions; (b) Southern Community Cohort Study (SCCS), including 2,128 African-Americans sampled within the southern US in rural locations; (c) 1000 Genomes Project cohort of 97 individuals of African ancestry from the southwest USA (ASW). (For detailed information, see Methods and Tables S4 and S5.)
Admixture patterns
Individual genomes carry genetic material from multiple ancestral lineages, and each diploid locus derives ancestry from two distinct lineages. We used RFMix (11) together with 1000 Genomes panels from Africa, Europe, and Asia to identify the most likely continental location of the pre-1492 ancestors that contributed genetic material at each locus for individuals in the cohorts (Fig. 1D, Fig. S14, and Methods). The overall proportion of African ancestry (Table 1) is substantially higher in the SCCS and HRS than in the ASW and the recently published 23andMe cohort (12).
Table 1:: Inferred proportions of African, European, and Native American/Asian Ancestry in three African-American cohorts.
Inferred regional ancestry proportions for the HRS and SCCS cohorts: (A) African, (B) European, and (C) Native American ancestries. (D) Local ancestry assignment along the autosomes for an African-American individual from HRS. (E) Comparison of the African ancestry proportions in the HRS, SCCS, and 23andMe stratified by state. 23andMe proportions are from Ref. (12) and are reported for ease of comparison.
The HRS cohort can be thought of as representative of the entire African-American population, while the SCCS focuses primarily on individuals attending community health centers in rural, underserved locations in the South. The sampling for the ASW and 23andMe did not aim for specific representativeness (see Methods). In the HRS, average African ancestry proportion is 83% in the South and lower in the North (80%, bootstrap p = 6 × 10^−6^) and West (79%, p = 10^−4^) (Fig. 1). Within the SCCS, African ancestry proportion is highest in Florida (89%) and South Carolina (88%) and lowest in Louisiana (75%) with all three significantly different from the mean (Florida p = 0.006, South Carolina p = 4 × 10^−4^, and Louisiana p < 10^−5^; bootstrap). The elevated African ancestry proportion in Florida and South Carolina is also observed in the HRS and in the 23andMe study (12), but Louisiana is more variable across cohorts (Fig. 1E). As expected, European ancestry proportions largely complement those of African ancestry across the US.
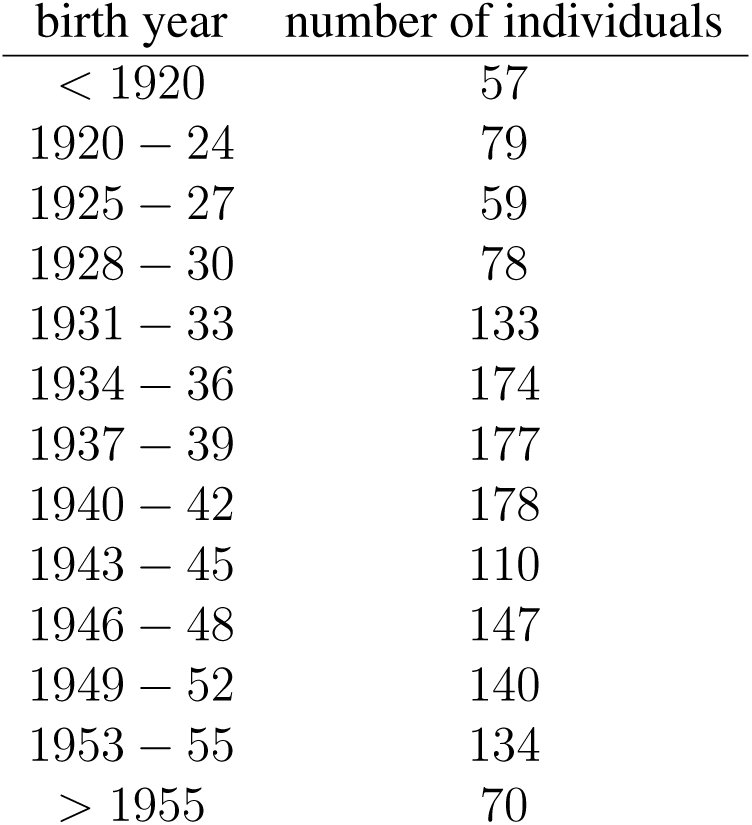
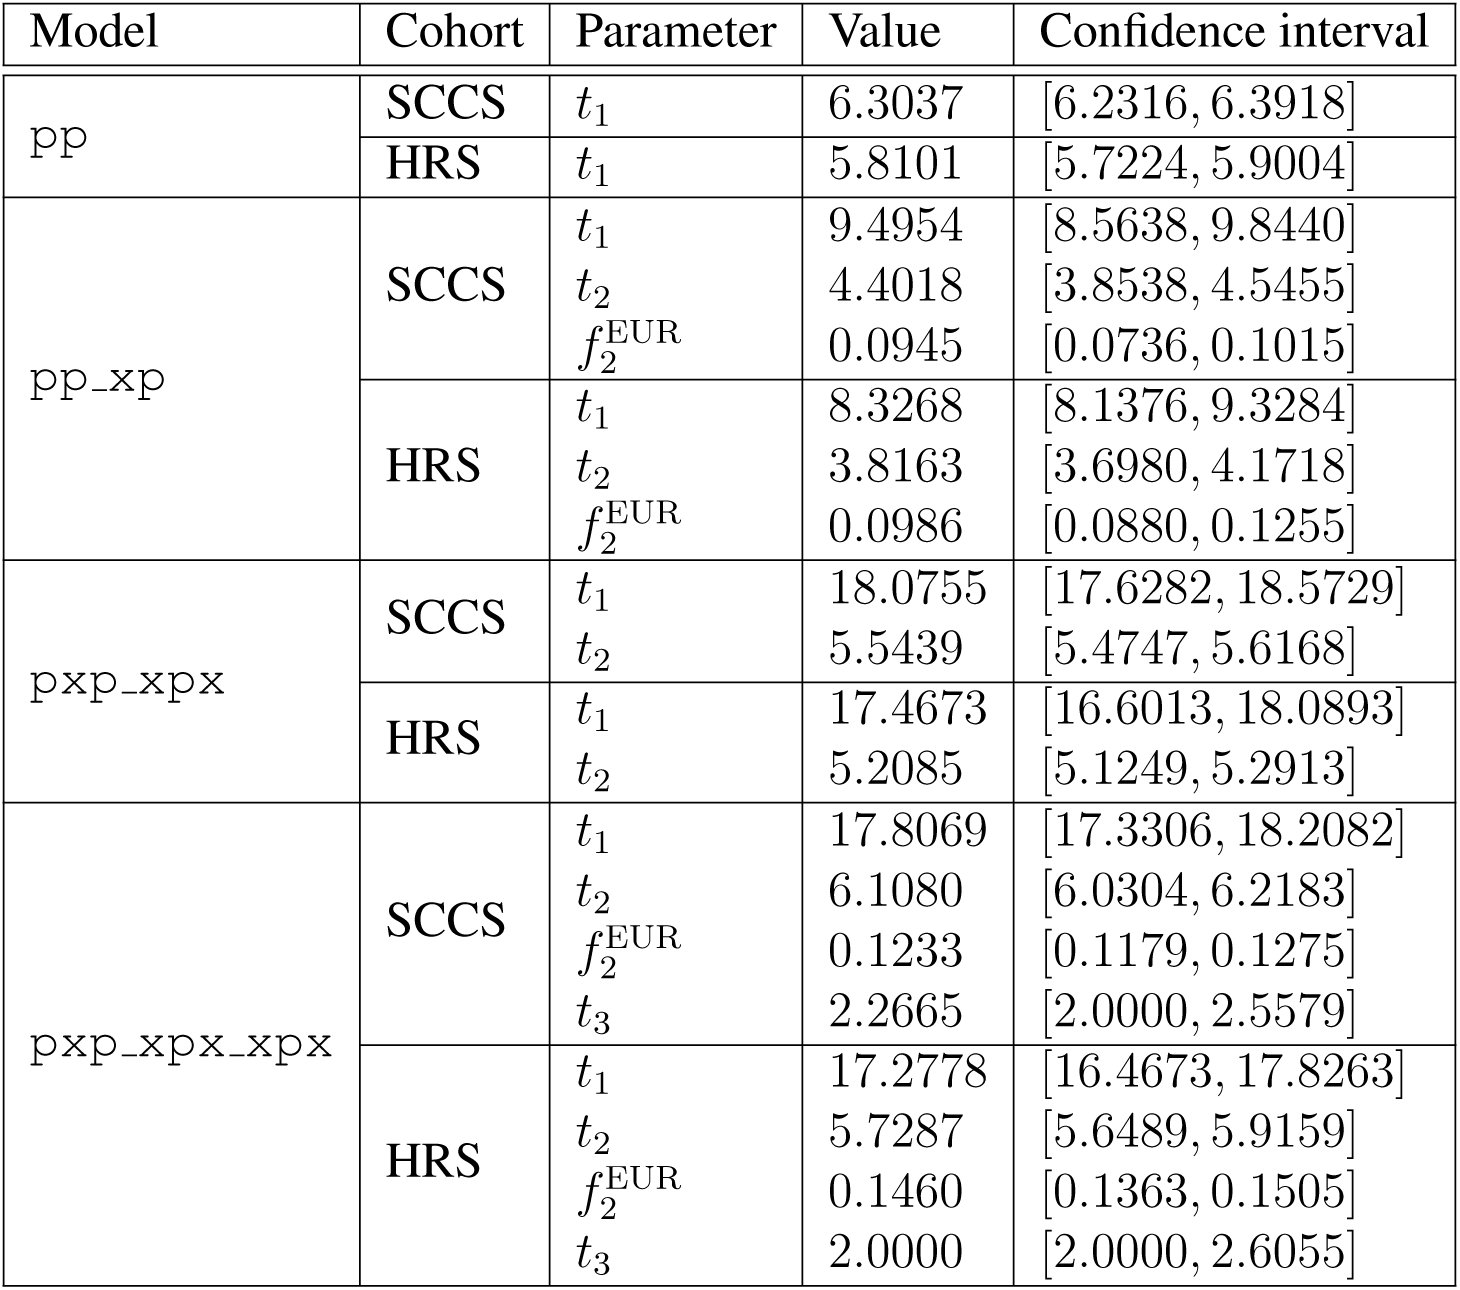
Recombination breaks down ancestral haplotypes over time (Fig. 1D). We inferred the timing of admixture based on the length of continuous ancestry segments along individual genomes using Tracts (16). Since there are few real Native American segments, even a small number of spurious Native American segments can bias the inference. Thus, we first considered a model with two source populations: African and non-African. Assuming a single admixture event, we estimated the time of admixture onset g, where g = 1 means that the parents of the individual are the founders of the admixed population and that the current individual represents the first admixed generation. For HRS, we inferred a timing of g = 5.8 generations ago (Fig. S9; confidence interval (CI) in Table S3). The estimated year of birth of the first admixed children is T = T_s_ − (g − 1)τ, where T_s_ = 1939.8 is the average year of birth of HRS individuals and τ is the generation time. Individuals born τ years earlier should be 1 generation closer to the onset of admixture. Correlating birth year and inferred admixture time within our cohort (Fig. 2D), we inferred τ = 27.4 (r^2^ = 0.88, p = 10^−7^), which leads to an admixture year of 1808.
A model allowing for two phases of European admixture outperforms the single-pulse model for HRS and SCCS (see Methods). In HRS, it suggests a first admixture event in 1740 (8.3 generations ago) and a second pulse, of approximately equal size, in 1863 (3.8 generations ago) (Fig. S9 and Methods). Mean birth year in SCCS is T_s_ = 1946.9, supporting a single admixture event in 1802 (6.3 generations ago), or two events in 1714 and 1854 (9.5 and 4.4 generations ago) (Fig. 2A, Fig. S9, and Methods). The two-pulse model is a coarse simplification of the historical admixture process, but the data strongly supports ongoing admixture, predominantly before or around the end of the Civil War. The limited role of early 20th century admixture is further supported by the similarity in the inferred single-pulse time to admixture in all HRS census regions (between 5.4 and 6.2 generations ago, Fig. S18) and all cohorts, which is easily explained if most admixture occurred in the South prior to the Great Migration. The similar levels of African ancestry for all age cohorts also supports limited European admixture between 1930 and 1960 (Fig. 2D). Importantly, more recent admixture is not represented in the SCCS and HRS cohorts; only two participants were born after 1970.
Admixture times and proportions of ancestral populations for SCCS in (A) the model with two pulses of admixture and (B) the model with three pulses of admixture. (C) Distribution of continuous ancestry tract lengths (dots) compared with predictions from the best-fit model (lines) Points in the shaded area are within one standard deviation of the predicted result. (D) Inferred time to admixture and African ancestry proportions as functions of birth year in HRS African-Americans. (E) Proportions of African ancestry in African-Americans within the North, South, and West using region of birth, region of residence, and migration status; bootstrap p-values are calculated between disjoint sets of individuals.
Time estimates point to admixture occurring when most ancestors to present-day African-Americans lived in the South. Regional differences in ancestry are therefore unlikely to be caused by differences in recent admixture rates, and the large influx of migrants from the South would have strongly attenuated any earlier differences. An alternate explanation for regional differences in ancestry proportions is ancestry-biased migrations, if individuals with higher European ancestry were more likely to migrate to the North and West during the Great Migration. To validate the ancestry-biased migration model, we compared ancestry proportions of HRS individuals according to their region of birth, residence, and migration status.
European ancestry proportions in African-americans who left the South (16.5%) is elevated compared to individuals who remained in the South (15. 3%, bootstrap p = 0.04), confirming that ancestry-biased migrations continued at least to the mid-20th century. These migrants had substantially less European ancestry than people already established in the North (20.9%) and West (25.0%) (Fig. 2E). Since the latter two groups received large contributions from the first generation of migrants, the excess European ancestry suggests a stronger ancestry bias in the first wave of migration. This change over time in ancestry-biased migration is consistent with historical accounts that southern African-American migrants to northern cities during the later stages of the Great Migration had darker complexion than North-born African-Americans (see (18), p. 179). The change could be explained by better social opportunities available to individuals with higher levels of European ancestry: Individuals with wealth and education were much more likely to migrate in the first wave of the migration (see (18), p. 167). Despite the ongoing ancestry bias, the migrations of HRS participants led to more uniform ancestry proportions across regions. Interestingly, the proportion of African ancestry among African-Americans increased in all four US regions; the ancestry bias caused migrants to have levels of admixture between those of the South-born and North-born individuals. Their departures and arrivals both increased the regional African ancestry proportions.
Out of 1,491 non-Hispanic African-Americans in HRS, 11 individuals have more than 5% Native American ancestry. Within SCCS, this proportion is only 8 out of 2,128 individuals. The ASW cohort, with 8 out of 97 individuals above this threshold, is a clear outlier; however, the other 89 individuals have similar amounts of Native American ancestry to the other studies: If we filter out individuals contributing more than 5% Native American ancestry from each cohort, the proportion of Native American ancestry in the remaining individuals is close to 1.1% in the SCCS, in all HRS census regions, and in the ASW. The filtered SCCS Louisianans have significantly more Native American ancestry (1.6%, bootstrap p = 2 × 10^−5^), and South Carolinians have less (0.09%, p = 2 × 10^−5^). We did not find a global correlation between European and Native American ancestry, except within Louisiana (Fig. S7).
A three-population admixture model accounting for Native American admixture confirmed the continuous, relatively early European admixture, and suggested that Native American admixture occurred earlier, consistent with previous findings of (12). Inferred dates of admixture are 1487 for the SCCS (Figs. 2B and 2C) and 1496 for the HRS (Figs. S10 and S11), as described in Methods. We suspect presence of a small amount of spurious, short segments of inferred Native American ancestry could bias the inference toward these unrealistically early dates. The lack of longer Native American segments nevertheless suggests that most Native American ancestry in African-Americans results from contact in the early days of slavery (see, e.g., (19)).
Along the X chromosome in the HRS, we estimate 84.82% African ancestry, 12.89% European ancestry, and 2.29% Native American ancestry (bootstrap 95% CI [2.14%, 2.45%]). The higher proportion of African ancestry along the X compared to autosomes is consistent with previous studies and the historical records of admixture occurring predominantly through European-American males admixing with African-American females (17). A model with a single pulse of admixture (as considered in (12)) applied to the present data suggests 28.6% Europeans among male contributors, but only 5.2% among female contributors. By contrast, it suggests almost no contribution from Native American males, and 3% from Native American females.
The US Census includes a separate category for Hispanic/non-Hispanic ethnicity. In HRS, 32 African-Americans have self-identified as Hispanics (of which only 10 are within the contiguous US). Genetic ancestry within this group is distinct from the bulk of the non-Hispanic African-American population in at least two ways: elevated Native American ancestry and a higher genetic similarity to southern European populations (Figs. S16 and S17). The correlation between southern European and Native American ancestries also holds in individuals who do not self-identify as Hispanic, particularly in Louisiana (see Methods). Individuals with elevated Native American and southern European ancestry would not be identified by self-reported ethnicity or by genetic estimates of African/non-African ancestry, yet they may have distinct response patterns to medical tests (20, 21).
Identity by descent
The classical isolation-by-distance model predicts that genetic relatedness between individuals decreases as their geographic distance increases (22). However, large-scale migrations can dramatically alter this picture (23). To investigate the effect of recent migrations on patterns of genetic relatedness within African-Americans, we consider genetic segments that are identical-by-descent (IBD) between pairs of individuals. Long IBD segments (l ≥ 18 cM) correspond to an expected common ancestor living within the last 8 generations and are informative of very recent demography (see Methods).
Figures 3A-B and S20-S23 show the mean pairwise relatedness among seven geographic regions in the US for African-Americans and European-Americans. Here, the relatedness of two individuals is defined as the proportion of their genomes shared through long IBD segments. These recent relatedness patterns differ markedly between African- and European-Americans: African-Americans show a distinct enrichment in South-to-North relatedness along the main historical migration routes.
Pairwise genetic relatedness across US census regions among (A) African-Americans, (B) European-Americans, and (C) African-Americans and European-Americans. (D) Census-based prediction for African-Americans (see Methods). On each map, the thickness and opacity of a line connecting any two geographic regions show the relative strength of relatedness between those regions. Relatedness between regions with fewer than 10,000 possible pairs of individuals is not shown (see Methods for details). All numbers are in units of cM. (E) Decay of average IBD (shown in logarithmic scale) as a function of distance using IBD segments of length 18 cM or larger from HRS (dots), compared to the analytical model (lines).
To compare these relatedness patterns with recent migration data, we used the 20th century US census data and a simple coalescent model to estimate the expected relatedness between geographic regions (see Methods). Census-based predictions (Fig. 3D) are correlated with IBD-based observations (Fig. 3A) if we consider non-identical pairs of regions (Mantel test p = 0.019). Limiting the comparison to the South-to-North and South-to-West relatedness, to capture migration routes specific to the Great Migration, yields p = 0.063 (using the 2010 region of residence) and p = 0.015 (using place of birth) (see Methods).
Figures 3C and S24 show the relatedness between African-Americans and European-Americans. African-Americans across the US are more related to European-Americans from the South than to those from the North or West. In addition, European-Americans from the South tend to be more related to African-Americans in the North than to those in the South. This increased relatedness with increased distance is unusual in population genetics, but is easily explained: The ancestry-biased migration is also a relatedness-biased migration. The reduced relatedness between northern European-Americans and African-Americans may also be reinforced by recent European migration, because the new migrants were more likely to settle in the North but were less likely to be related to African-Americans.
Fine-scale isolation by distance
Despite the unusual long-range relatedness patterns, identity-by-descent decays with distance within African-American communities in the South, reflecting isolation-by-distance (Fig. S5). To understand how migrations affect isolation-by-distance and identity-by-descent, we introduce a novel, simple model taking into account a diploid population density n and spatial diffusion constant D. In short, the displacement between parental birthplace and offspring birthplace of individuals is modeled as an isotropic random walk; the distribution of the times t to the most recent common ancestor of two individuals separated by distance R is calculated under a coalescent model; and the amount of genetic material shared IBD given a common ancestor at time t is computed as in (24). In this model, the expected fraction of genome shared IBD, through segments of length in ℓ = [lmin, lmax] (in Morgans), between two randomly chosen individuals separated by R has the simple form [eqn] where [eqn], and K_α_(x) is the modified Bessel function of the second kind (see Methods).
Using IBD segments longer than 18 cM, we estimate population density nAFR =1.9 km^−2^ and diffusion constant DAFR = 63.5 km^2^/generation for African-Americans across the US, and nEUR = 7.6 km^−2^ and DEUR = 59.6 km^2^/generation for European-Americans (Fig. 3E). The ratio of European- to African-American population density is therefore 3.9. According to the 2010 US Census, 13% of the total population have self-identified as “Black or African American alone” and 72% self-identified as “White alone”. The ratio of European- to African-American population size from census is 5.5, in good agreement to our estimate above. Interestingly, the root mean squared displacement per generation, [eqn], shows comparable local migration rates in European-Americans and African-Americans despite the different histories and population densities.
Conclusion
The history of African-American populations combines strong ties to place with large-scale migrations (4). This comprehensive study shows the combined effects of fine-scale population structure, large-scale migrations, and admixture among African-Americans, giving us a better understanding of how the dramatic history of African-Americans shaped genomic diversity and, in particular, the sharing of haplotypes that can harbor rare, recent variation. From a medical genetics perspective, the sharing of recent haplotypes is a good proxy for the sharing of large-effect deleterious alleles (25). Rare genetic traits are therefore much more likely to be shared over long distances among African-Americans than among European-Americans, particularly along the routes of the Great Migration, but their spatial distributions over short ranges remain far from uniform. In addition, the ancestry-biased migration indicates a strong correlation between genetic and environmental population structure. Detailed demographic modeling should therefore inform the sampling and analysis of large genetic cohorts that include African-Americans.
The reference list from the paper itself. Each links out to its DOI / PubMed record.
- 1Voyages Database. Voyages: The Trans-Atlantic slave trade database (2009). URL http://www.slavevoyages.org.
- 2Ruggles, S. et al. Integrated Public Use Microdata Series: Version 5.0 [machine-readable database]. Tech. Rep., University of Minnesota, Minneapolis (2010).
- 3Wilkerson, I. The warmth of other suns: The epic story of America’s great migration (Vintage, 2010).
- 4Lemann, N. The Promised Land: The Great Black Migration and How It Changed America (Vintage, 1992).
- 5Bustamante, C. D., De La Vega, F. M. & Burchard, E. G. Genomics for the world. Nature 475, 163–165 (2011).
- 6Burchard, E. G. Missing patients. Nature 513, 301–302 (2014).
- 7Tishkoff, S. A. et al. The genetic structure and history of Africans and African Americans. Science 324, 1035–1044 (2009).
- 8Parra, E. J. et al. Estimating African American admixture proportions by use of population-specific alleles. The American Journal of Human Genetics 63, 1839–1851 (1998).