Spatial model predicts dispersal and cell turnover cause reduced intra-tumor heterogeneity
Bartlomiej Waclaw, Ivana Bozic, Meredith E. Pittman, Ralph H. Hruban, Bert Vogelstein, Martin A. Nowak

TL;DR
This paper explains how cancer tumors remain genetically similar despite their size by showing how cell movement and turnover lead to rapid mixing and dominance of certain clones.
Contribution
The paper introduces a spatial model showing how short-range migration and cell turnover explain tumor homogeneity and rapid resistance development.
Findings
Short-range migration and cell turnover enable rapid mixing of tumor cells.
A small selective advantage allows a single cell's descendants to dominate a large tumor quickly.
The model explains how resistance to chemotherapy can emerge rapidly.
Abstract
Most cancers in humans are large, measuring centimeters in diameter, composed of many billions of cells. An equivalent mass of normal cells would be highly heterogeneous as a result of the mutations that occur during each cell division. What is remarkable about cancers is their homogeneity - virtually every neoplastic cell within a large cancer contains the same core set of genetic alterations, with heterogeneity confined to mutations that have emerged after the last clonal expansions. How such clones expand within the spatially-constrained three dimensional architecture of a tumor, and come to dominate a large, pre-existing lesion, has never been explained. We here describe a model for tumor evolution that shows how short-range migration and cell turnover can account for rapid cell mixing inside the tumor. With it, we show that even a small selective advantage of a single cell within a…
Genes, proteins, chemicals, diseases, species, mutations and cell lines named across the full text — each resolved to its canonical identifier and authoritative record.
Click any figure to enlarge with its caption.
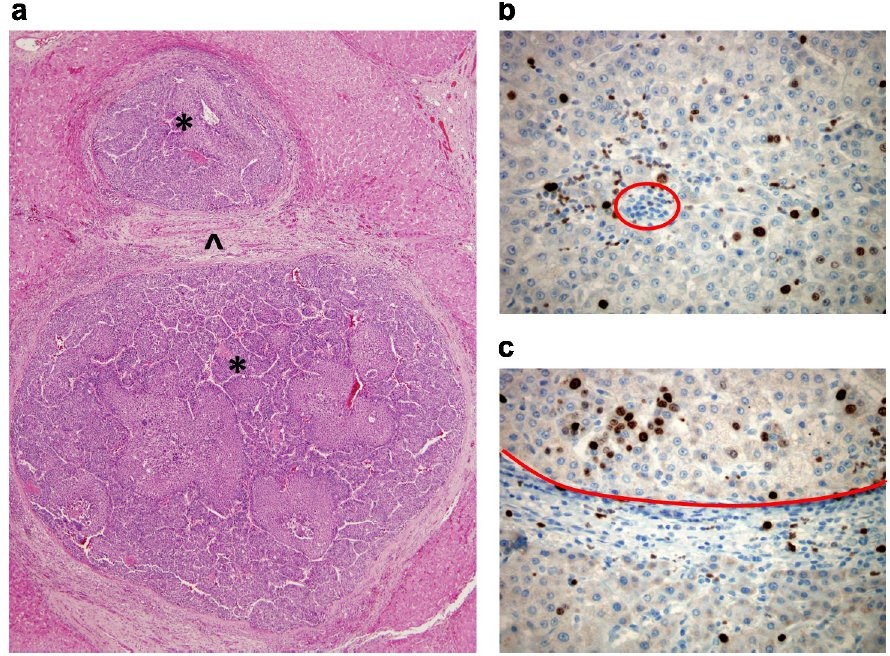 Fig. 1
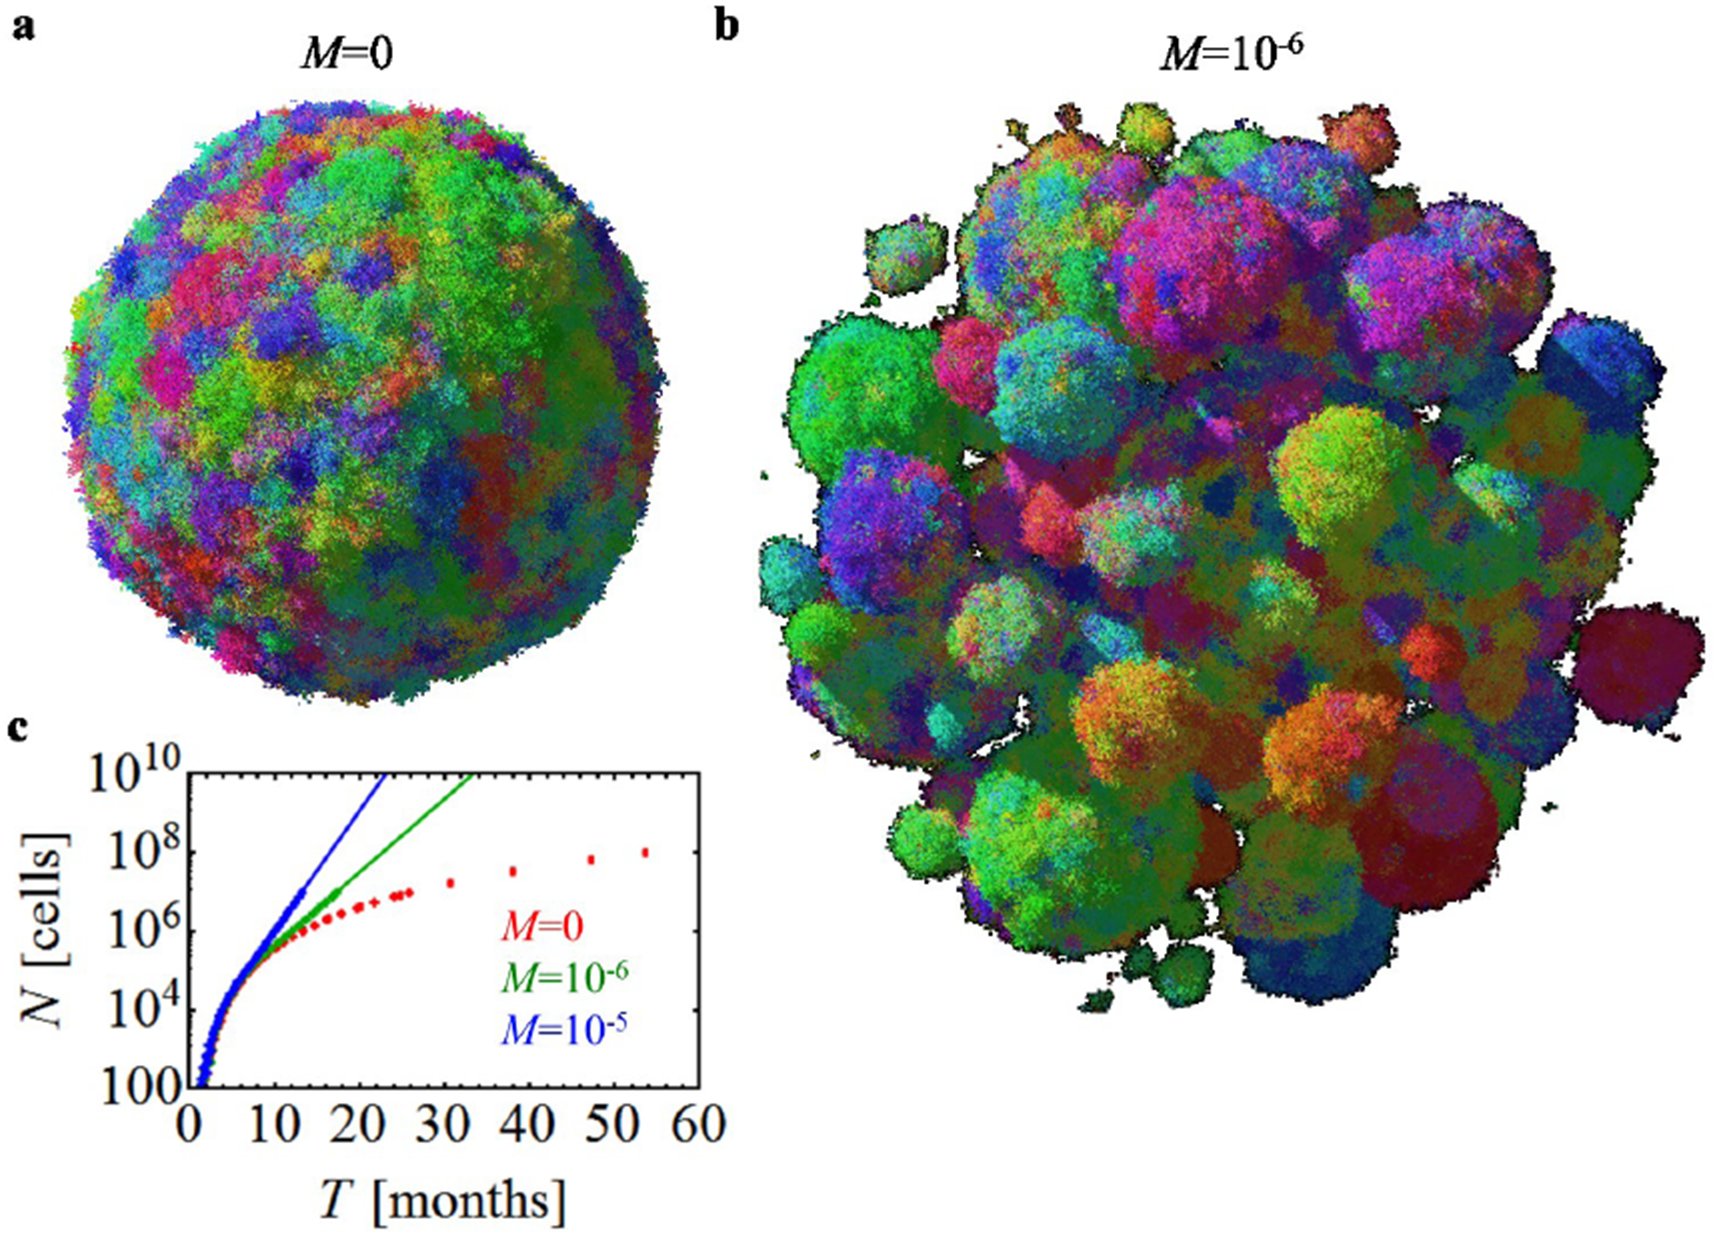 Fig. 2
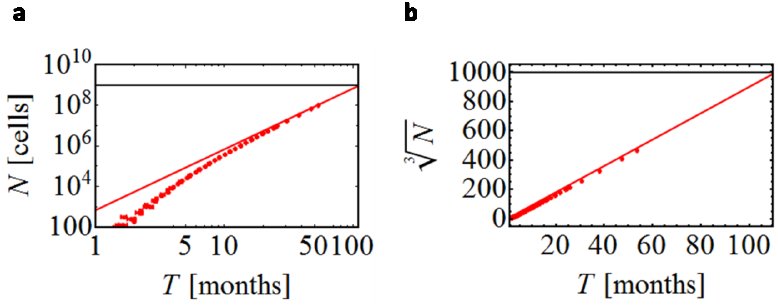 Fig. 7
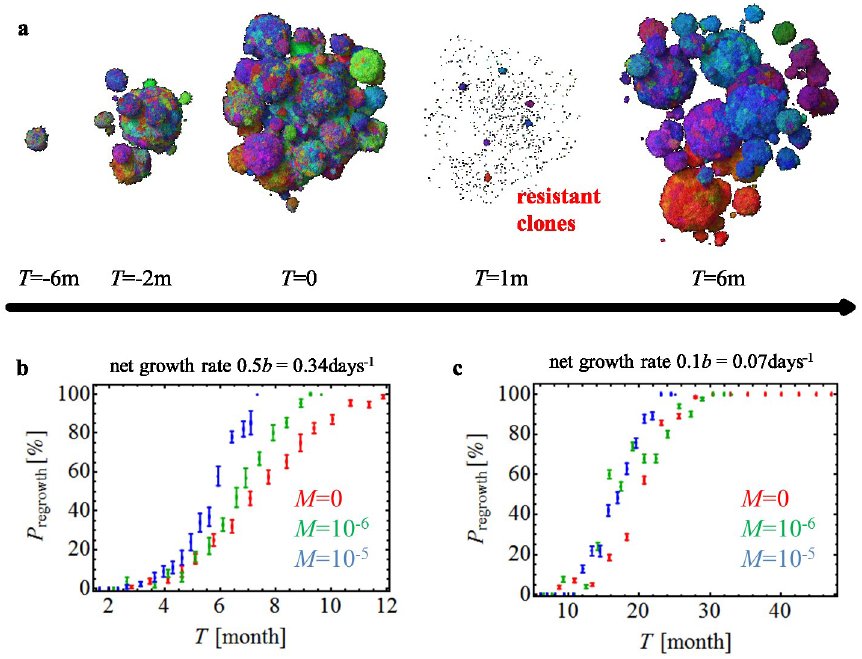 Fig. 3
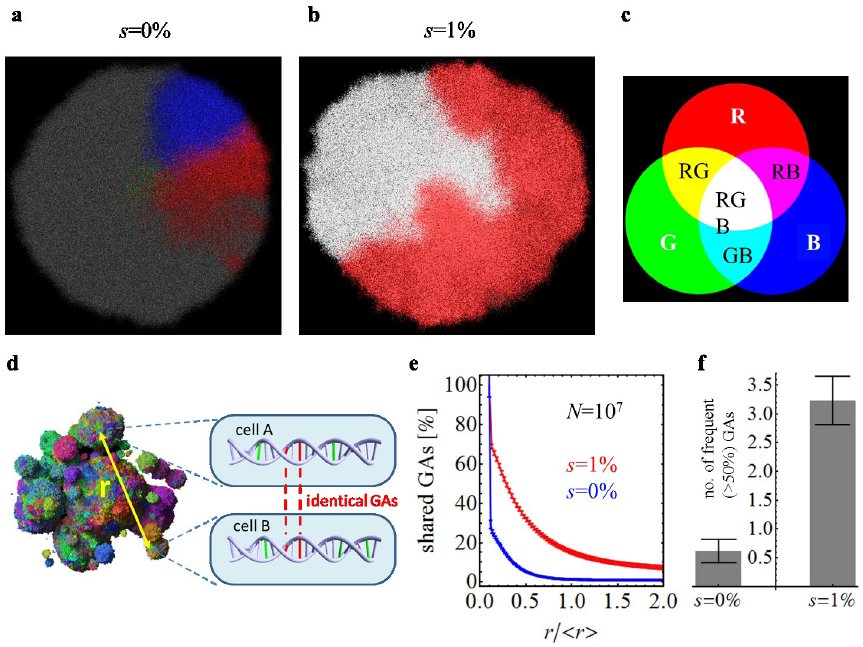 Fig. 4

Peer Reviews
No public reviews on file for this paper yet. If you reviewed it on a platform where reviews are public (OpenReview, ICLR, NeurIPS, ICML), you can paste yours below so the community can read it here.
Videos
No videos yet. Explain this paper in a talk, walkthrough, or lecture? Add one.
Taxonomy
TopicsMathematical Biology Tumor Growth · Cancer Genomics and Diagnostics · Microtubule and mitosis dynamics
Introduction
Tumor growth is initiated when a single cell acquires genetic or epigenetic alterations that change the cell’s net growth rate (birth minus death) and enable its progeny to outgrow surrounding cells. As these small lesions grow, the cells acquire additional alterations that cause them to multiply even faster and to change their metabolism to better survive the harsh conditions and nutrient deprivation. This progression eventually leads to a malignant tumor that can invade surrounding tissues and spread to other organs. Typical solid tumors contain about 30-70 clonal amino-acid-changing mutations that have accumulated during this multi-stage progression [1]. Despite the fact that a majority of these mutations are believed to be passengers that do not affect growth, and only ∼5% to 10% are drivers that provide cells with a small selective growth advantage, a major fraction of the mutations, particularly the drivers, are present in 30%-80% of cells in the primary tumor as well as in metastatic lesions derived from it [2,3,4,5].
Most attempts at explaining the genetic make-up of tumors assume well-mixed populations of cells and do not incorporate spatial constraints [6,7,8,9,10,11]. Several models of the genetic evolution of expanding tumors have been developed in the past [12,13,14,15,16,17,18], but they either assume very few mutations [12,13,14,15,16] or one- or two-dimensional growth [15,16,17,18]. On the other hand, models that incorporate spatial limitations have been developed to help understand processes such as tumor metabolism [19,20], angiogenesis [21,22,23], and cell migration [24], but these models ignore genetics. Here, we formulate a model that combines spatial growth and genetic evolution and use the model to describe the growth of primary tumors and metastases, as well as the development of resistance to therapeutic agents.
Metastasis
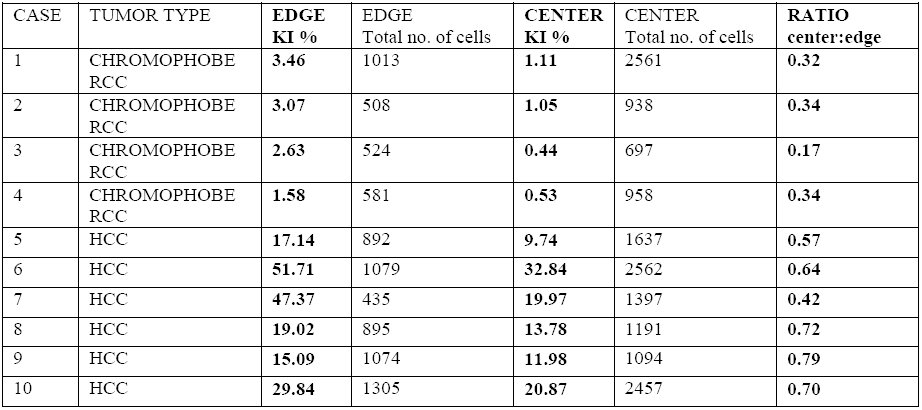
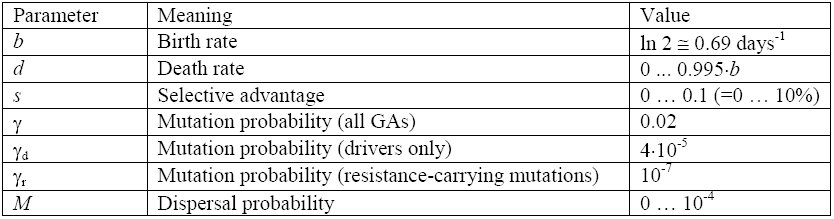
We first model the expansion of a metastatic lesion derived from a cancer cell that has escaped its primary site (e.g., breast or colorectal epithelium) and travelled through the circulation until it lodged at a distant site (e.g., lung or liver). The cell initiating the metastatic lesion is assumed to have all the driver gene mutations needed to expand. Motivated by histopathological images (Fig. 1a) we model the lesion as a conglomerate of “balls” of cells. Cells occupy sites in a regular three-dimensional lattice (Fig. 6a-b). Cells replicate stochastically with rates proportional to the number of surrounding empty sites (non-neoplastic cells or extracellular matrix), hence replication is faster at the edge of the tumor. This is supported by experimental data (Fig. 1b,c and Table 1). A cell with no cancer cell neighbors replicates at the maximal rate of b=ln(2)=0.69 days^-1^, equivalent to 24h cell doubling time, and a cell that is completely surrounded by other cancer cells does not replicate. Cells can also mutate, but we assume all mutations are passengers (they do not confer fitness advantages). Upon replication, a cell moves with a small probability M to a nearby place close to the surface of the lesion and creates a new lesion. This “sprouting” of initial lesions can be due to short-range migration following an epithelial-to-mesenchymal transition^25^ and consecutive reversion to the non-motile phenotype. Alternatively, it could be the result of another process such as angiogenesis (Sec. 6.1.2) through which the tumor gains better access to nutrients. The same model governs the evolution of larger metastatic lesions that have already developed extensive vasculature. Cells die with rate d independent of the number of neighbors, and are replaced by empty sites (non-neoplastic cells within the local tumor environment).
Structure of solid tumors. (a) Hematoxylin and eosin stained section of hepatocellular carcinoma. The neoplasm is composed of two distinct balls of cells () separated by non-tumor tissue (^). Note the smaller nests (balls) of neoplastic cells within the lower lesion. (b-c) Hepatocellular carcinoma immunolabeled with the proliferation marker Ki67. The middle of the tumor (b) shows decreased proliferation as compared to the leading edge of the tumor (top of c), see Table 1. The red circle in (b) demonstrates an example of cells (inflammatory cells) that would not have been included in the total cell count. The areas below the red line in (c) are non-tumor stroma and non-tumor liver tissue.*
Table 1.: Experimental results for the percentage of proliferating cells in the center versus at the edge of solid tumors. A representative section of each tumor was labeled for the proliferation marker Ki67 (KI), and images of the tumor at the leading edge and the center were acquired as described (Sec. 6.1.2). Proliferation is markedly increased at the leading edge. The average ratio of the number of proliferating cells in the center/at the edge is 0.50 (range 0.17-0.79).
If there is little dispersal (M ≈ 0), the shape of the tumor becomes roughly spherical as it grows to large size (Fig. 2a, Fig. 6c and Supp. Video 2). However, even a very small amount of dispersal strikingly affects the predicted shape. For M>0, the tumor forms a conglomerate of “balls” (Fig. 2b, Fig. 6c, and Supp. Video 3), much like those observed in actual metastatic lesions, with the balls separated by islands of non-neoplastic stromal cells mixed with extracellular matrix. In addition to this remarkable change in topology, dispersal strongly impacts the tumor’s growth rate and doubling time. Although the size N of the tumor increases with time T from initiation as ∼T^3^ without dispersal (Fig. 7), it grows exponentially for M>0. This also remains true for long-range dispersal where M plays the role of the reseeding probability of new lesions through circulation from the primary tumor. Using plausible estimates for the rates of cell birth, death, and dispersal probability, we calculate that it takes 8 years for a lesion to grow from one cell to a billion cells in the absence of dispersal (M=0), but less than 2 years with dispersal (Fig. 2c). The latter estimate is consistent with experimentally determined rates of metastasis growth as well as clinical experience, while the conventional model (without dispersal) is not. In sum, even when individual cancer cells divide and die at identical rates, short-range cell dispersal has a pronounced effect on the size and shape of the resulting tumor.
Short-range migration affects size, shape, and growth rate of tumors. (a) A spherical lesion in the absence of migration (M=0) and (b) a conglomerate of lesions, each initiated by a cell that has migrated from a prior lesion, for low but non-zero migration (M=10-6). Colors reflect the degree of genetic similarity; cells with similar colors have similar genetic alterations (GAs). The death rate is d=0.8b which corresponds to a net growth rate of 0.2b=0.14days-1, and N=107 cells. (c) The number of cancer cells N increases in time much faster for M>0 than in the absence of migration.
Tumor size as a function of time. (a) Growth of a tumor without dispersal (M=0), for d=0.8b. For large times (T), the number of cells grows approximately as const×T 3. The tumor reaches size N=109 cells (horizontal line) after about 100 months (8 years) of growth. (b) The same data is plotted in the linear scale, with N replaced by “linear extension” N1/3.
Treatment and the evolution of resistance
Non-spatial models point to the size of a tumor as a critical determinant of chemotherapeutic drug resistance [26,27,28,29,30]. To determine whether a spatial model would similarly predict this dependency in a clinically relevant time frame, we calculated tumor regrowth probabilities following targeted therapies. We assume that the cell that initiates the lesion is susceptible to treatment, other-wise the treatment would have no effect on the mass, and that the probability of a resistant mutation is 10^-7^ (Sec. 6.1.1); only one such mutation, among all the cells of the metastatic tumor, is needed for a regrowth.
Figure 3a shows snapshots from a simulation (Supp. Video 1) performed before and after the administration of a typical targeted therapy. In this simulation, the metastatic lesion grows from its initiating cell to form a small lesion (∼3 mm) when therapy is administered at time T=0. The size of the lesion then rapidly decreases, but one month later resistant clones begin to proliferate and form tumors of microscopic size. Such resistant subclones are predicted to be nearly always present in lesions of sizes that can be visualized by clinical imaging techniques [29,30,31]. By six months after treatment, the lesions have regrown to their original size. The evolution of resistance is a stochastic process - some lesions shrink to zero and some regrow (Fig. 8). Figure 3b,c shows the probability of regrowth versus the time from the lesion’s initiation to the onset of treatment upon varying net growth rates b-d and dispersal probabilities. Regardless of growth rate, the capacity to migrate makes it somewhat more likely that regrowth will occur at shorter periods (compare green and blue curves with red curves in Fig. 3b), particularly for more aggressive cancers, i.e., those which have higher net growth rates (compare Figs. 3b and 3c). This is in line with recent theoretical work on evolving populations of migrating cells [32,33]. If resistant mutations additionally increase the dispersal probability before or during treatment, regrowth is faster (Fig. 8b,c). Note that our model assumes the drug is uniformly distributed in the tumor [34]; it is known that drug gradients can speed up the onset of resistance [35].
Treatment success rates depend on the net growth rate of tumors. (a) Time snapshots prior to and during therapy (“m” = months). Treatment increases the death rate and decreases the growth rate of susceptible cells throughout the tumor. Resistant subpopulations that cause the tumor to regrow after treatment can be seen at T=1m. Parameters: d=0.5b in the absence of treatment, M=10-6; treatment begins when the tumor has N=107 cells. (b-c) Probability of tumor regrowth (Pregrowth) as a function of time after treatment initiation, for different migration probabilities (M) and net growth rates of the resistant cells. A higher growth rate (b) (either because of a lower death rate d or equivalently a higher birth rate b) leads to a high regrowth probability, so that 50% of tumors regrow six months after treatment is initiated when M=10-5. (c) Tumors with lower net growth rates (i.e., higher death rates) require >20 months to achieve the same probability of regrowth. In both (b) and (c) we assume that the growth rate of resistant cells after therapy is identical to that of the sensitive cells prior to treatment. The death rate of sensitive cells during treatment is greater than the birth rate, or the tumors would not be sensitive to the drug.
Primary tumors
Having shown that the spatial model’s predictions are consistent with metastatic lesion growth and regrowth times, we turn to primary tumors. Here the situation is considerably more complex because the tumor cells are continually acquiring new driver gene mutations that can endow them with fitness advantages over adjacent cells within the same tumor. In contrast, in metastatic lesions we assumed all cells had the same fitness in the absence of targeted therapy. Our model of a primary tumor assumes that it is initiated via a single driver gene mutation that provides a selective growth advantage over normal neighboring cells. Each subsequent driver gene mutation reduces the death rate as d=b(1-s)^k^, where k is the number of driver mutations in the cell (k≥1), and s is the average fitness advantage per driver. Identical results are obtained if driver gene mutations increase cell birth rather than decrease cell death, or affect both cell birth and cell death (Figs. 9, 11); the only important parameter is the fitness gain, s, conferred by each driver mutation.
Figure 4a shows that, in the absence of any new driver mutations (as for a perfectly normal cell growing in utero), clonal subpopulations would be distributed in a conical fashion. Each of these cones has at least one new genetic alteration, but none of them confers a fitness advantage (they are “passengers”). In an early tumor, in which the center cell harbors the initiating driver gene mutation, the same conical structure would be observed - as long as no new driver gene mutations have yet appeared. The occurrence of a new driver gene mutation, however, dramatically alters the spatial distribution of cells. In particular, the heterogeneity observed in normal cells (Fig. 4a) is substantially reduced (Fig. 4b and Supp. Video 5). The degree of heterogeneity can be quantified by calculating the fraction of genetic alterations (GAs, passengers plus drivers) shared between two cells separated by various distances (Fig. 4d-f). The homogeneity is markedly increased (compare blue vs. red curves in Fig. 4e), even with relatively small fitness advantages (s=1%). This also has implications for the number of GAs that will be present in a macroscopic fraction (e.g., >50%) of all cells. Figure 4f shows that this number is many times larger for s=1% than s=0%. Furthermore, our model predicts that virtually all cells within a large tumor will share at least one new driver gene mutation after 5 years of growth (Fig. 11). The faster the clonal expansion occurs (the larger s is), the smaller the number of passenger GAs (Fig. 11d). Our results are also robust to changes to the model (Sec. 6.4 and Figs. 11, 12). We stress that an important prerequisite for homogeneity is cell turnover in the tumor, because in the spatial setting cells with driver mutations can “percolate” through the tumor only if they replace other cells. In the absence of cell turnover, tumors are much more heterogeneous (Fig. 12d).
Genetic diversity is strongly reduced by the emergence of driver mutations. Genetic diversity within a single lesion (M=0) with initial death rate d=0.99b (net growth rate = 0.007days-1). The three most abundant genetic alterations (GAs) have been color-coded using red, green, and blue (see panel c). Combinations of the three basic colors correspond to cells having 2 or 3 of these GAs. (a) No drivers – separated, conical sectors emerge in different part of the lesion, each corresponding to a different clone. (b) Drivers with fitness advantage s=1% lead to clonal expansions and many cells have all 3 GAs (white area). (d) Drawing shows how genetic diversity can be determined quantitatively: genotypes of two randomly chosen cells, separated by distance r, are compared and the number of shared GAs is determined. (e) The number of shared GAs versus the normalized distance r/<r> decreases much slower for the case with (red) than without driver mutations (blue). (f) The total number of GAs present in at least 50% of all cells is much larger for s=1% than for s=0%.
Conclusion
Our model for the spatial evolution of cancers accounts for many facts observed clinically and experimentally. Our results are robust and many assumptions (replication rate proportional to the number of surrounding normal cells, drivers lowering the death rate, constant dispersal rate) can be relaxed without qualitatively affecting the outcome (Sec. 6.4 and SI). Though tumor cell migration has historically been viewed as a feature of cancer associated with late events in tumorigenesis, such as invasion through basement membranes or vascular walls, this classical view of migration pertains to the ability of cancer cells to migrate over large distances [36]. Instead, we focus on small amounts of cellular movement and show that they are able to dramatically reshape a tumor. Moreover, we predict that the rate of tumor growth can be substantially altered by a change in dispersal rate of the cancer cells, even in the absence of any changes in doubling times or net growth rates of the cells within the tumor. Some of our predictions could be experimentally tested using new cell labelling techniques [37,38]. Virtually all previous explanations for the effects of driver gene mutations have assumed that the difference between cell birth and cell death are the major, if not sole, determinants, of cancer growth. Our results suggest that small differences in cell migration can have equally powerful effects on cancer growth not on individual cells, but on masses of cells in the three-dimensional patterns that actually occur in vivo. This idea could greatly inform the interpretation of mutations in genes whose main functions seem to be related to the cytoskeleton or to cell adhesion rather than to cell birth, death, or differentiation [39,40,41]. For example, cells that have lost the expression of e-cadherin (a cell adhesion protein) are more migratory than normal cells with intact ecadherin expression [42], and loss of e-cadherin in pancreatic cancer has been associated with poorer prognosis [43], in line with our predictions.
The reference list from the paper itself. Each links out to its DOI / PubMed record.
- 1Vogelstein, B. et al. Cancer Genome Landscapes. Science 339 (6127), 1546–1558 (2013).
- 2Yachida, S. et al. Distant metastasis occurs late during the genetic evolution of pancreatic cancer. Nature 467, 1114–1117 (2010).
- 3Sottoriva, A. et al. Intratumor Heterogeneity in Human Glioblastoma Reflects Cancer Evolutionary Dynamics. Proc. Natl. Acad. Sci. USA 110, 4009–4014 (2013).
- 4Navin, N. et al. Tumour evolution inferred by single-cell sequencing. Nature 472, 90–94 (2011).
- 5Gerlinger, M. et al. Intratumor Heterogeneity and Branched Evolution Revealed by Multiregion Sequencing. N. Engl. J. Med. 366, 883–892 (2012).
- 6Gatenby, R.A. & Vincent, T.L. An Evolutionary Model of Carcinogenesis. Cancer Res. 63 (19), 6212–6220 (2003).
- 7Johnston, M.D., Edwards, C.M., Bodmer, W.F., Maini, P.K. & Chapman, S.J. Mathematical Modeling of Cell Population Dynamics in the Colonic Crypt and in Colorectal Cancer. Proc. Natl. Acad. Sci. USA 104(10): 4008–4013 (2007).
- 8Bozic, I. et al. Accumulation of driver and passenger mutations during tumor progression. Proc. Natl Acad. Sci. USA 107(43), 18545–18550 (2010).