Genetic dissection of MAPK-mediated complex traits across S. cerevisiae
Sebastian Treusch, Frank W. Albert, Joshua S. Bloom, Iulia E. Kotenko, Leonid Kruglyak

TL;DR
This study explores how genetic differences in yeast affect signaling pathways and resulting traits, using a QTL mapping approach.
Contribution
The study introduces a QTL mapping method to dissect genetic variation's impact on MAPK signaling in S. cerevisiae.
Findings
Genetic variants influencing MAPK signaling were identified across diverse S. cerevisiae isolates.
Variants were found within MAPK pathways and interconnected signaling networks.
Results show how genetic diversity shapes phenotypic outcomes of conserved signaling cascades.
Abstract
Signaling pathways enable cells to sense and respond to their environment. Many cellular signaling strategies are conserved from fungi to humans, yet their activity and phenotypic consequences can vary extensively among individuals within a species. A systematic assessment of the impact of naturally occurring genetic variation on signaling pathways remains to be conducted. In S. cerevisiae, both response and resistance to stressors that activate signaling pathways differ between diverse isolates. Here, we present a quantitative trait locus (QTL) mapping approach that enables us to identify genetic variants underlying such phenotypic differences across the genetic and phenotypic diversity of S. cerevisiae. Using a Round-robin cross between twelve diverse strains, we determined the genetic architectures of phenotypes critically dependent on MAPK signaling cascades. Genetic variants…
Click any figure to enlarge with its caption.
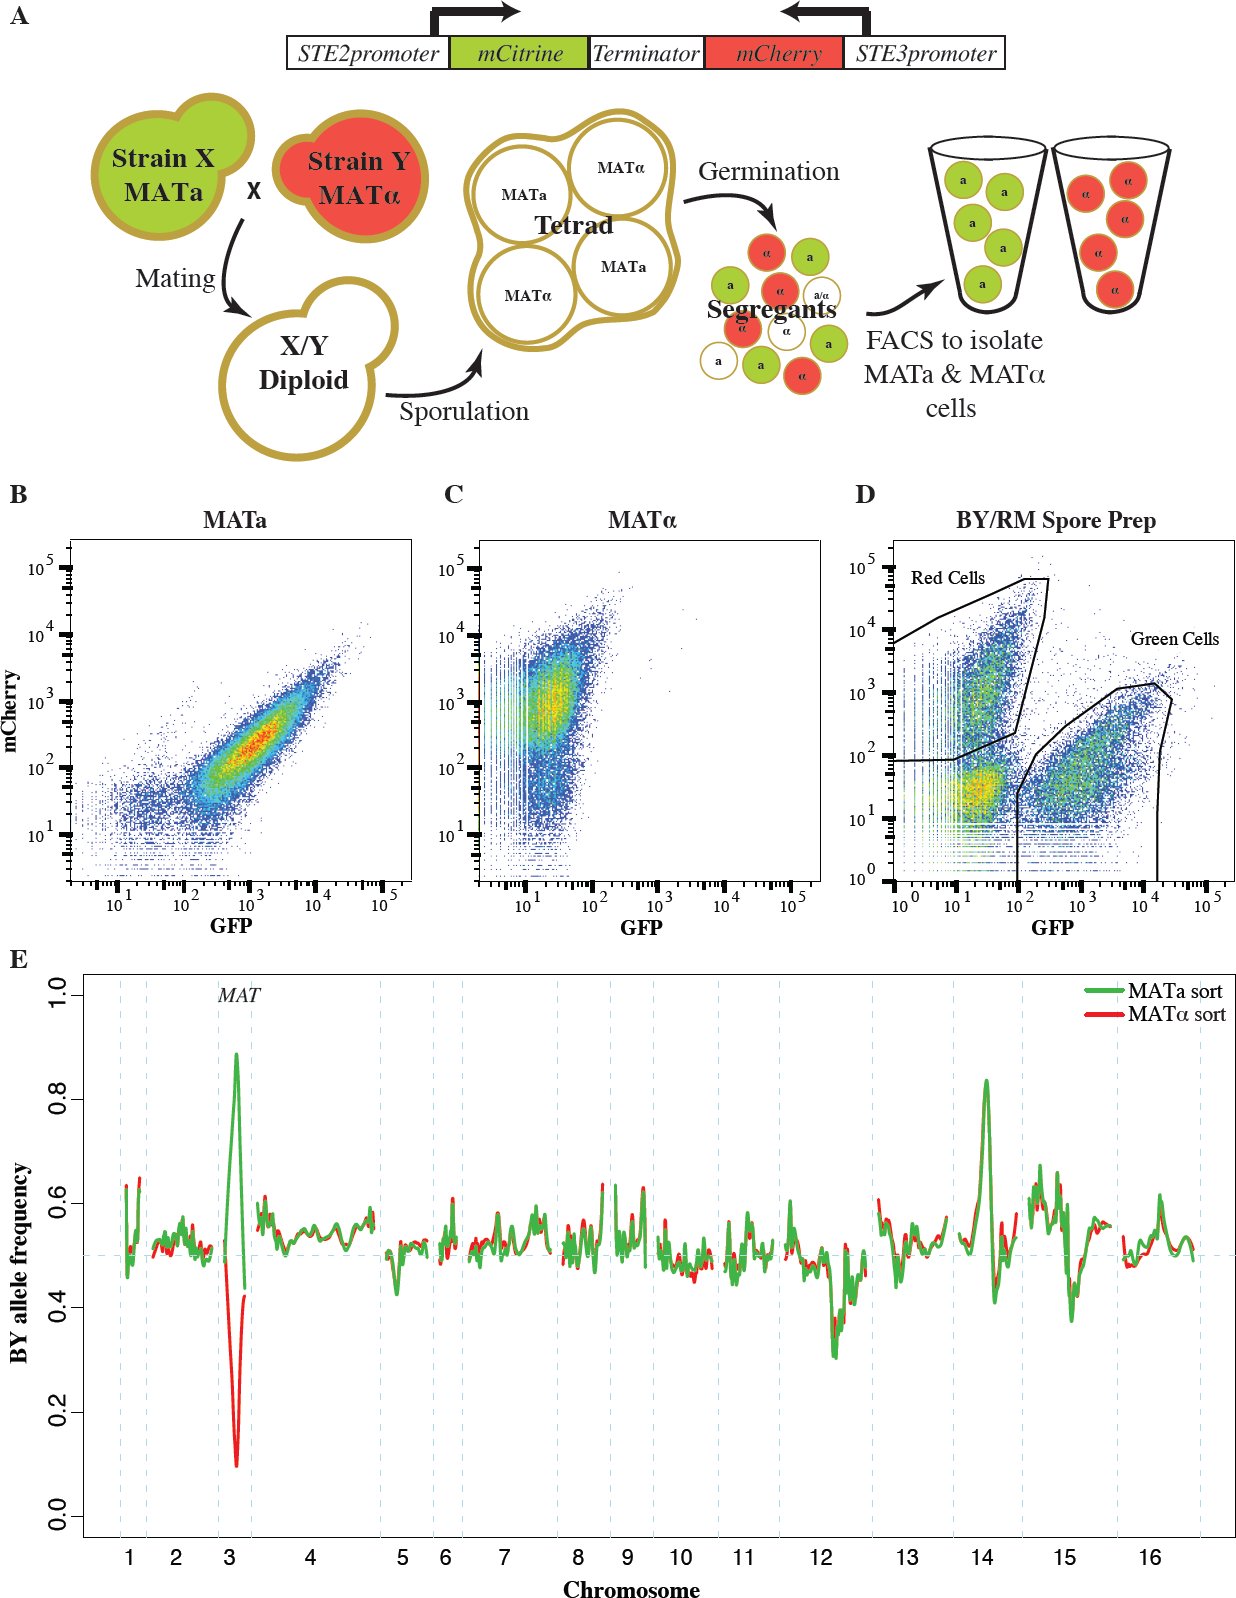 Figure 1
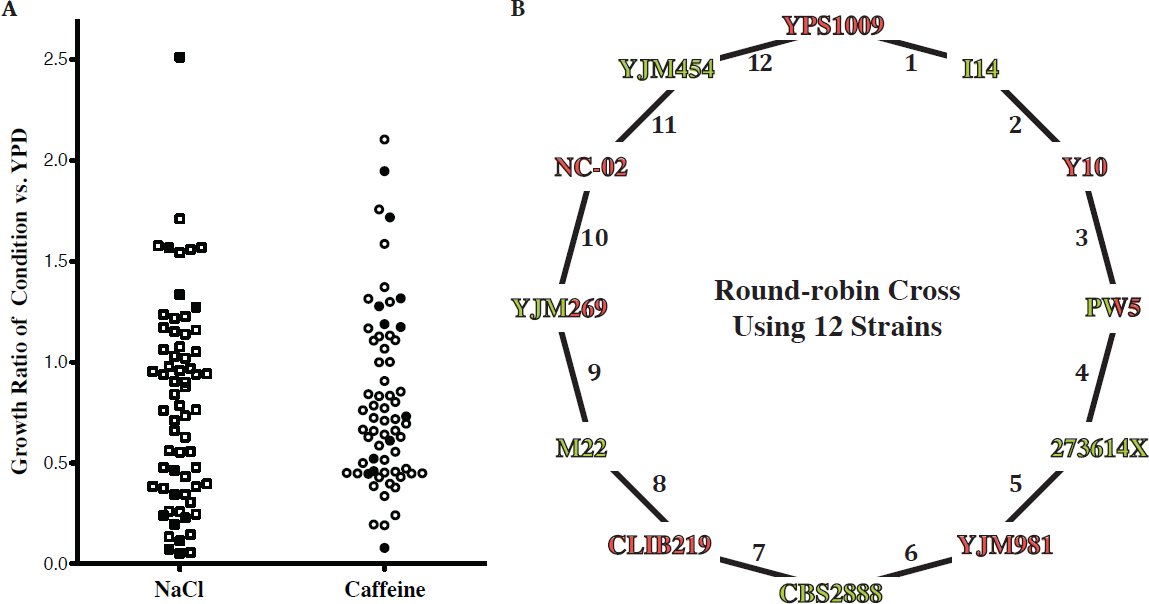 Figure 2
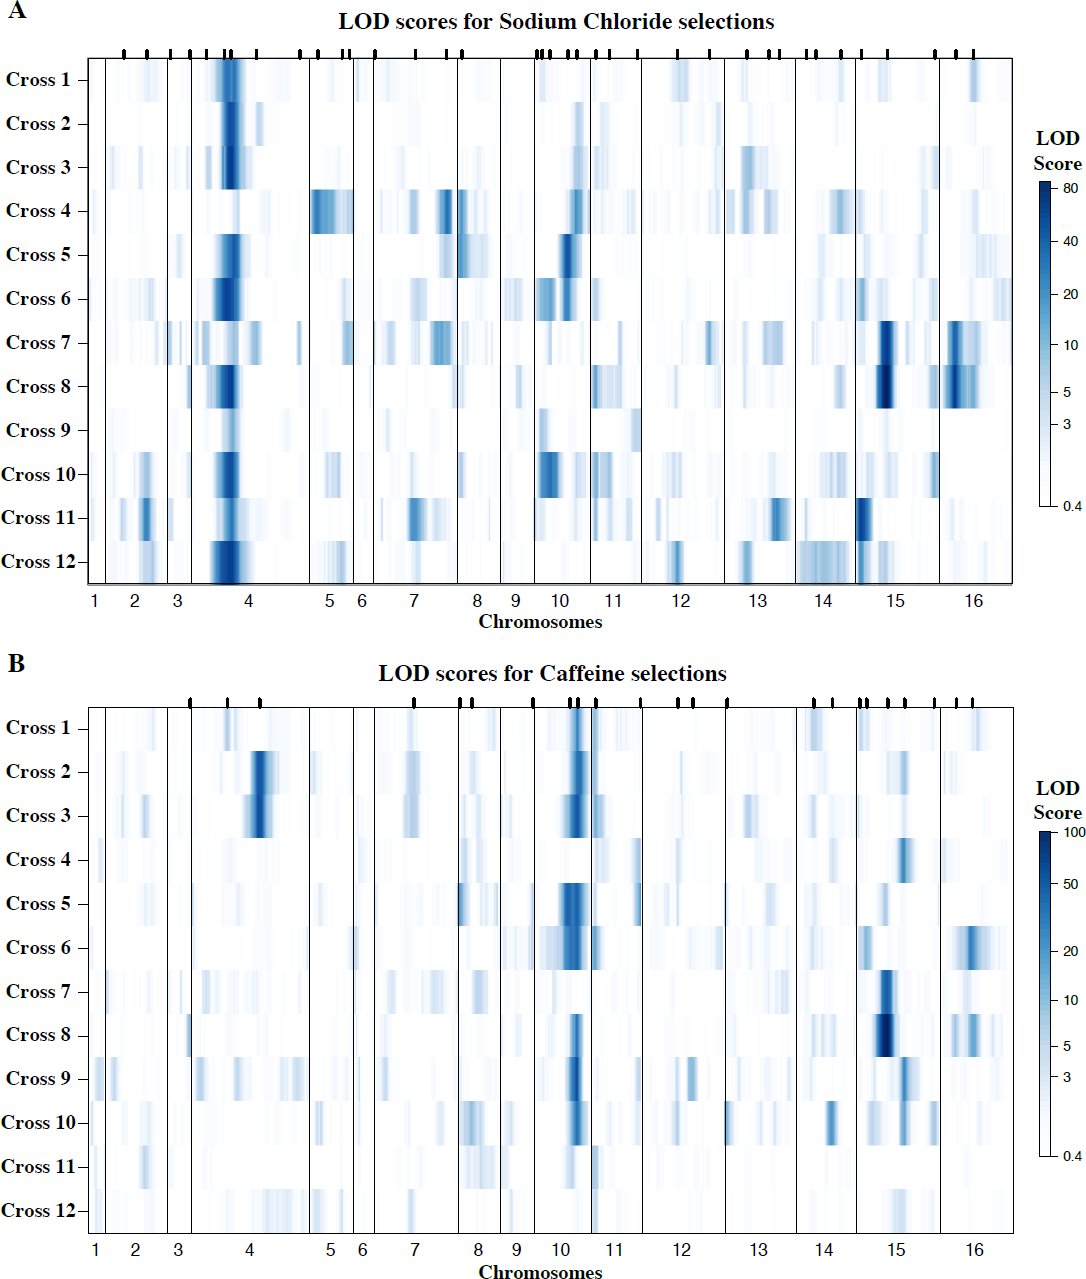 Figure 3
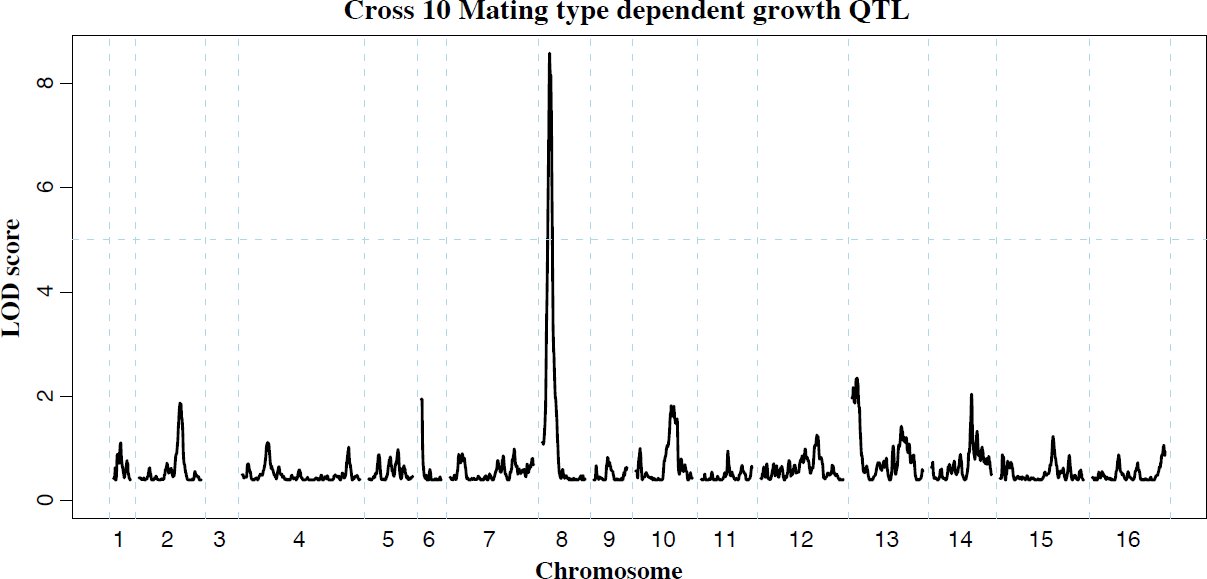 Figure 4
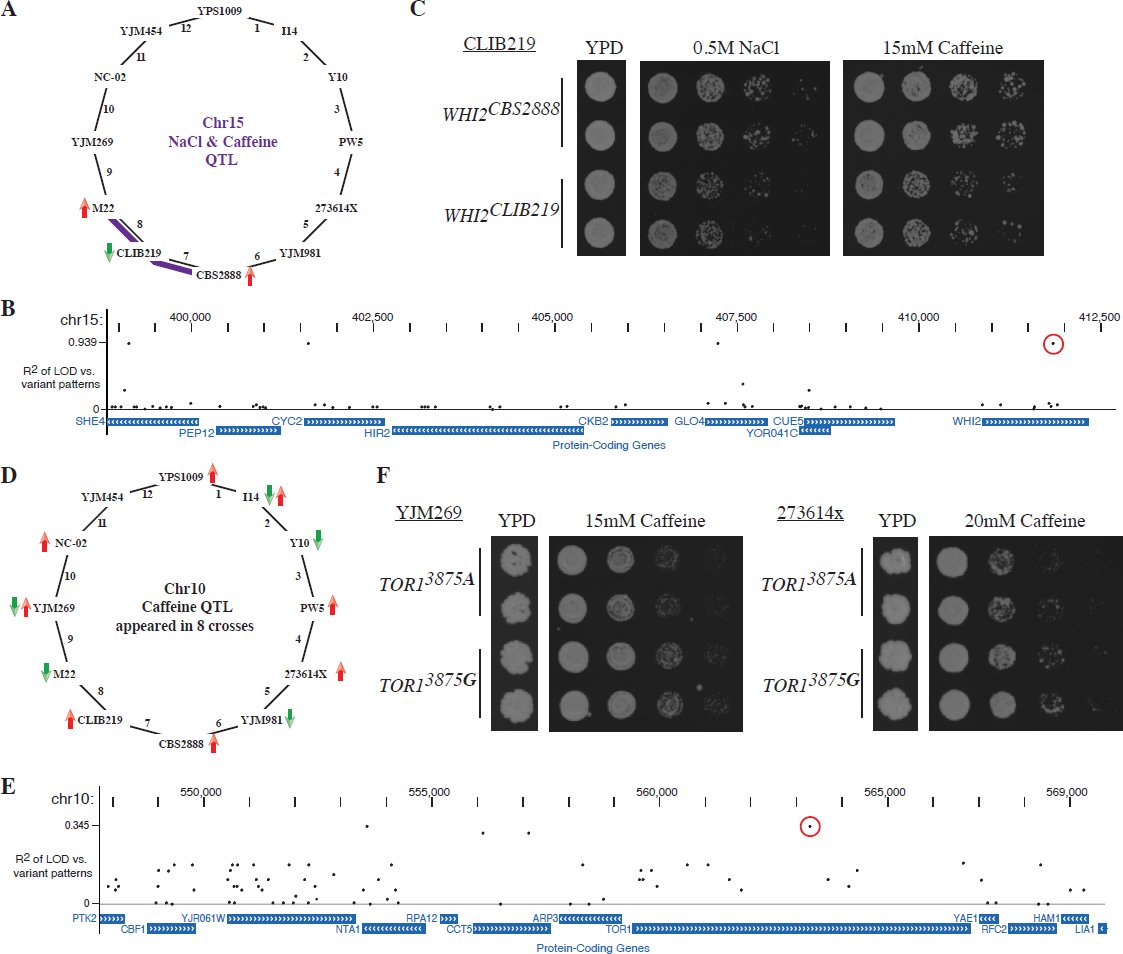 Figure 5
Peer Reviews
No public reviews on file for this paper yet. If you reviewed it on a platform where reviews are public (OpenReview, ICLR, NeurIPS, ICML), you can paste yours below so the community can read it here.
Videos
No videos yet. Explain this paper in a talk, walkthrough, or lecture? Add one.
Taxonomy
TopicsFungal and yeast genetics research · Fungal Biology and Applications · Bioinformatics and Genomic Networks
Highlights
Quantitative trait mapping using large mapping populations from natural isolates QTL mapping for MAPK-mediated traits Identification of genetic variants that influence cellular signaling pathways
Introduction
Cellular survival is dependent on the ability to sense and respond to changing environmental conditions. Mitogen-activated protein kinase (MAPK) signaling cascades are ubiquitous in eukaryotic organisms and enable them to react to extracellular stimuli [1]. MAPK cascades are composed of three sequentially acting kinases [2], which upon sensing an extracellular stimulus trigger a cellular response by activating transcription factors and other regulatory proteins [2,3]. The yeast Saccharomyces cerevisiae has long been used as a eukaryotic model system to elucidate the principles of these signaling pathways, as many of the core signaling proteins are conserved from yeast to human [3].
In yeast, MAPK pathways facilitate response to environmental cues such as the presence of mating pheromones and stresses such as cell wall damage and high osmolarity [4]. Adaptation to high osmolarity is conducted by the HOG (high osmolarity glycerol) MAPK pathway. The human homolog of the MAPK Hog1, p38α, not only mediates the response to hyperosmolarity as well [4], but also plays key roles in inflammation and cancer [5,6]. Insults to the cell wall are sensed by the cell-wall integrity (CWI) pathway, which is anchored by the MAPK Slt2, homolog of the mammalian MAPK7 [7]. Response and resistance to MAPK-activating stress conditions are highly variable among different yeast isolates [8,9,10]. While genes of the core MAPK cascades are highly conserved across species, upstream regulatory components, such as stress sensors, and downstream targets, such as transcription factors, exhibit high levels of divergence [11,12]. Yet, it is unknown how genetic differences in such elements of the MAPK pathways contribute to the phenotypic differences between isolates of the same species. Hence, it remains poorly understood how sequence variation among yeast isolates results in quantitative differences in MAPK-dependent phenotypes.
Yeast is an ideal model system for the study of quantitative traits. Quantitative trait locus (QTL) mapping studies in S. cerevisiae have characterized the genetic architecture of complex traits, including global gene expression and resistance to small molecules [13,14,15,16], as well as shed light on the sources of “missing heritability” [17]. We have previously developed a bulk-segregant-analysis approach (BSA), named X-QTL, which utilizes extremely large mapping populations for increased mapping power [18]. Such mapping populations are subjected to selection to enrich for alleles that contribute to a trait of interest. We have recently used this method to determine the genetic underpinnings of protein abundance variation [19]. The majority of mapping studies to date have interrogated a pair of strains at a time, with only some recent studies expanding to crosses among four parent strains [20,21]. Isolation of individual recombinant haploids, as used in linkage mapping studies, is very labor intensive, and current X-QTL protocols require extensive strain engineering. Consequently, mapping studies have queried a fraction of the S. cerevisiae species-wide genetic and phenotypic variation and have left much of the genetic architecture of quantitative traits across the species unexplored.
Here, we report an approach that enables implementation of X-QTL in crosses among diverse yeast isolates without extensive genetic modifications. This method takes advantage of plasmid-borne fluorescent markers to leverage the precision and high throughput of fluorescence-activated cell sorting (FACS) to rapidly generate large mapping populations of recombinant haploids. We dissected the genetic architectures of salt (sodium chloride) and caffeine tolerance in a set of strains capturing much of the species-wide genetic diversity. Salt tolerance is mediated by the HOG MAPK pathway, while exposure of yeast to caffeine results in the activation of the CWI MAPK pathway [7]. In addition to these two pathways, we examined the effect of the MAPK mating pathway on growth by comparing mapping populations of opposite mating type. We identified QTL that contain genes with various roles in MAPK signaling. Our results how genetic variation shapes MAPK-dependent traits. Finally, we illustrate how a round-robin cross design can be leveraged to identify causal genetic variants.
Results
Fluorescence-based isolation of mapping populations
Our original X-QTL approach relied on the expression of the auxotrophic marker HIS3 under the control of the MATa-specific STE2 promoter for the isolation of MATa recombinant haploids [22]. However, most isolates of S. cerevisiae are generally prototrophs, lacking the auxotrophic mutations required for the original X-QTL approach. In addition, auxotrophic mutations can have large phenotypic effects [14]. Furthermore, the use of the STE2 promoter restricted X-QTL mapping populations to segregants of the MATa mating type. Here, we designed a novel approach that relies on mating-type specific expression of plasmid-borne fluorescent reporters, enabling the isolation of haploids of either mating type without the need to integrate the reporters into the genome (Figure 1A). We placed the fluorescent markers mCitrine and mCherry under the control of the STE2 promoter and its MATα-specific equivalent, the STE3 promoter, respectively [22]. We combined these two fluorescent markers in a single construct and created a set of plasmids with drug resistances that permit facile introduction into any strain background (see Methods for details).
Fluorescent markers for the isolation of recombinant haploids (A) Utilizing fluorescent mating type markers to generate large mapping populations. The fluorophores mCitrine and mCherry were placed under the control of the MATa-specific STE2 and the MATα-specific STE3 promoters, respectively, and combined into a single construct. Introduction of this construct into MATa cells results in green fluorescence, while MATα cells exhibit red fluorescence. Neither of the two reporters is active in diploid or tetrad cells, but after germination the markers are expressed and enable the isolation of MATa and MATα populations of recombinant haploids. (B-E) Validation of the fluoresent markers. Flow cytometry of (B) MATa cells and (C) MATα cells that carried a plasmid with the combined fluorescent mating type markers. MATa cells were green fluorescent, while MATα cells presented with red fluorescence. (D) A culture of BY/RM recombinant haploids with the mating type marker plasmid as assessed during FACS. Green MATa and red MATα cells were isolated based on their fluorescence. Gates shown represent approximate gates used during cell sorting. (E) The allele frequency spectrum across the genome within the isolated MATa and MATα cell populations was determined by sequencing. On chromosome three MATa populations were highly enriched for the MATa allele, while MATα populations were highly enriched for the MATα allele. Other large allele frequency skews correspond to previously identified BY/RM growth QTL.
As expected, the presence of this construct resulted in green fluorescence in MATa strains and red fluorescence in MATα strains (Figure 1B & C). Diploids carrying the marker construct were non-fluorescent, as neither promoter is active in diploid cells [22,23]. After sporulation and germination, haploid progeny express the fluorescent marker corresponding to their mating type. We tested this aspect of the reporter construct by introducing it into the diploid hybrid between the well-characterized BY and RM strains and generating a pool of BY/RM recombinant haploids (see Methods for details). Flow cytometry revealed that this pool encompassed three cell populations: non-fluorescent cells and, in roughly equal proportions, green and red cells (Figure 1D). We used fluorescence-activated cell sorting to isolate populations of green and red cells and then sequenced them in bulk to determine the BY and RM allele frequencies in each population. The BY parent strain contributes the MATa allele of the MAT locus, located on chromosome 3, while the MATα allele originates from the RM parent. As expected, the MATa allele was highly enriched in the green fluorescent recombinant haploids, while the MATα allele was enriched in the red population (Figure 1E). This result demonstrates that the fluorescent markers can be used to isolate populations of MATa, as well as MATα, haploids.
In addition to the expected large allele frequency differences at the MAT locus, we identified several allele frequency skews that were highly concordant between the two populations (Figure 1E). These skews correspond to previously identified growth QTL [17,18]. For example, the skew on chromosome 12 is located at the gene HAP1; the BY allele of this gene results in partial loss of function and poorer growth compared to the RM allele, leading to the observed reduction in frequency of the BY allele. The agreement between the allele frequency distributions in the two mating type pools indicates that the isolated cell populations can be used to map QTL with excellent reproducibility in both mating types.
Phenotyping of wild strains and design of the round-robin cross
We set out to use our approach to dissect phenotypes mediated by different MAPK pathways. We used two stress conditions to query two different MAPK-signaling networks: high salt concentrations and caffeine. High salt conditions lead to activation of the HOG signaling cascade, while caffeine triggers the cell-wall integrity pathway.
We determined sodium chloride and caffeine tolerances for a collection of 65 S. cerevisiae isolates [24] and selected twelve diverse strains that spanned a range of resistances for our mapping studies (Figure 2A, Supplemental Table S1). These twelve strains vary at approximately 80% of the common SNPs (allele frequency ≥ 0.05) segregating within the larger strain collection. We designed a round-robin crossing scheme in which each of the twelve strains was crossed to two other strains, for a total of twelve crosses (Figure 2B). The round-robin crossing scheme is the most efficient way to intercross a set of strains while maintaining equal contributions of each strain [25]. Most mapping studies are based on crosses between resistant and sensitive strains, which implicitly assumes that resistance alleles are shared between resistant strains. By contrast, we randomly assigned the order of strains within the round-robin design without regard to strain phenotypes. As such, the crossing scheme included crosses between parent strains with different, as well as with similar, resistance phenotypes.
Design of round-robin cross to map salt and caffeine resistance (A) Phenotyping of 65 diverse strains. Growth under the indicated condition (YPD plus 1M sodium chloride (NaCl) or 15 mM caffeine) was adjusted for growth under the permissive YPD condition (also see Supplemental Table S1). We picked strains (filled symbols) that are representative of the genetic and phenotypic diversity and crossed them according to a round-robin design (B). Strains were crossed independent of phenotype and genetic relationship. Strain name colors indicate mating type (Green = MATa, Red = MATα)(also see Supplemental Figure S1).
To assess the genetic complexity of salt and caffeine resistance, we isolated up to twenty individual segregants from each cross. We measured growth of these segregants and the parent strains under high salt and caffeine stress conditions (Supplemental Figure S1). Three of the 24 phenotype distributions of the cross progeny were approximately bimodal, suggesting one large-effect determinant of resistance in these crosses. Other crosses exhibited phenotype distributions consistent with directional genetics and transgressive segregation [26]. In two crosses, the mean progeny phenotype was significantly lower than the midparent phenotype (Supplemental Table S2), indicative of interactions between the underlying causal loci [26,27]. These findings illustrate the genetic complexity of the resistance phenotypes among wild isolates.
Mapping MAPK-dependent traits within the round-robin crosses
Next, we established a pipeline to map QTL between any pair of strains. Sequences of parent strains were used to generate lists of SNPs that segregated within a cross and could serve as genetic markers for QTL mapping. Mapping populations of both mating types were isolated and grown under permissive as well as selective conditions (YPD, YPD containing 0.5M sodium chloride, 1M sodium chloride, 15 mM caffeine or 20 mM caffeine). The resulting populations were bulk-sequenced to assess allele frequencies at SNP sites segregating in a particular cross. We used the MULTIPOOL software to calculate LOD scores testing whether allele frequencies at a given position in the genome in each selected population differed from those in the corresponding control population (Supplemental Figure S2)[19,28].
We used replicate BY/RM mapping experiments to determine the robustness and reproducibility of our mapping approach (see Methods for details). Allele frequency distributions of replicate experiments were extremely similar: comparisons between replicates did not exceed a LOD of 2.62 (Supplemental Figure S3 A & B). At a LOD score threshold of five, QTL detection was highly reproducible, with 90.1% of QTL reproducibly detected in replicate experiments (Supplemental Figure S3 C & D, Supplemental Table S3). Reproducibility was also high between selections based on mapping populations of opposite mating types (88.3%).
We applied our mapping strategy to identify QTL that influence MAPK-dependent resistance traits in the twelve Round-robin crosses. We used the MATa and MATα selections for each cross as replicate mapping experiments (see Supplemental Figure S4 for combined LOD plots for each cross). We used a stringent criterion that a QTL must exceed a LOD threshold of five in both selections, and identified 155 QTL across the twelve crosses and the different conditions. Of QTL identified in only one of the two matched experiments, the majority had LOD scores close to the LOD threshold (median LOD 6.7 for unreplicated QTL vs. 12.3 for replicated QTL, Supplemental Figure S5A). Indeed, for 93.5% of unreplicated QTL the direction of the underlying allele frequency skews was the same in the matched MATa and MATα experiments (permutation based p <0.001). This suggests that many of these QTL stem from small effect variants that narrowly escaped detection in one of the two experiments.
Next, we asked how QTL are distributed and shared among the Round-robin crosses (Figure 4 A & B, Supplemental Table S4). The salt QTL fell into 37 unique genomic regions, while the caffeine QTL comprised 23. There were 13 QTL regions that recurred between the conditions. We found an average of 6.2 salt resistance QTL (range 1 to 13) and 3.7 caffeine resistance QTL (range 0 to 7) per cross. Interestingly, the number of QTL detected per cross was independent of the genetic distance of the parent strains involved (divergence & salt QTL: Pearson correlation 0.154, divergence & caffeine QTL: 0.087). However, when the QTL of the two conditions were considered together per cross, this resulted in a weak correlation with the extent of parental divergence (0.257). We tested if the number of QTL per cross was a function of the phenotypic difference of the parent strains, since a previous study found that a higher number of QTL could be identified between yeast strains of similar phenotypes [29]. We found that this was the case for the salt resistance QTL (phenotypic difference & salt QTL: Pearson correlation −0.517), but not for caffeine resistance QTL (phenotypic difference & caffeine QTL: 0.395). While increasing the phenotypic similarity of yeast parent strains through the experimental fixation of large effect QTL can permit the identification of additional small effect QTL [30,31], this trend is condition-dependent for crosses between different wild isolates.
Because each genetic variant is introduced into the Round-robin scheme at least twice, each QTL is expected to be identified at least twice assuming 100% power and no genetic interactions. Contrary to this expectation, previous studies involving sets of interconnected crosses have found that the majority of QTL are ‘context-dependent’, that is their identification was dependent on a specific cross and not just on the parent strains involved [21,29,32]. Indeed, 33 of the 60 QTL regions we identified across the two conditions were found in only one cross (Supplemental Figure S5B). The overall lower LOD scores of these ‘context dependent’ QTL as a class only partially explained their lack of detection in additional crosses (Supplemental Figure S5C; Pearson correlation 0.417, p = 2.6 × 10^−6^). As such, the context dependency of these QTL is likely to be in part a result of interactions between the QTL and the genetic background [32].
Functional connections of QTL to signaling
We asked if the QTL mapping had resulted in any functional enrichment in the underlying genes. While genes within caffeine resistance QTL were only marginally enriched for the GO-term ‘Response to Stimulus’ (p = 0.077), genes found under salt resistance QTL were significantly enriched for ‘Cellular Response to Stimulus’ (p = 0.006) and ‘Kinase Activity’ (p = 0.002) (Supplemental Table S5). This suggests that our mapping experiments point towards genetic variants that impact cellular signaling pathways.
Several of the identified QTL tower among the genetic architectures of the two resistance traits (Figure 3 A & B, Supplemental Table S4). Tolerance of high salt concentrations is dominated by variation at the ENA locus on chromosome 4, which we detected in eleven out of twelve crosses. The ENA genes encode sodium efflux pumps that, in the presence of high salt, are transcriptionally activated by the HOG pathway [33]. European S. cerevisiae isolates carry an ENA variant that resulted from an introgression from the yeast species S. paradoxus and exists in varying copy numbers, referred to as ENA1 through ENA5. In contrast, non-European strains carry a single copy of the ancestral ENA6 gene [34]. Both the introgressed variant and its copy number are associated with high salt tolerance [10]. We determined the copy numbers of the two ENA variants within our parent strains and found that strains with high salt resistance indeed carried multiple copies of the introgressed ENA gene (Supplemental Table S6). Interestingly, the identified ENA QTL reflected differences beyond the two divergent ENA variants and copy number. We identified ENA QTL in crosses between parents with equal copy numbers of the introgressed variant (Cross 9), as well as between non-European isolates carrying alleles of the ENA6 gene that differed from each other by three missense mutations (Cross 12). Our findings corroborate the importance of the ENA locus in shaping the genetic architecture of salt resistance [10] and further illustrate the multi-allelic nature of this locus.
Genetic architectures of resistance identified in the round-robin crossesGenome-wide LOD scores for (A) sodium chloride and (B) caffeine experiments are plotted jointly for the 12 Round Robin crosses to illustrate the how QTL are shared among the different crosses (see Supplemental Figure S4 for individual plots). The large effects of the multi allelic ENA locus on salt and TOR1 on caffeine resistance are readily apparent. At each position the minimum of replicate selections is plotted for each cross. Tick marks on the upper axis indicate peak positions of QTL identified (QTL are listed in Supplemental Table S4).
The hallmarks of S. cerevisiae caffeine resistance architecture are the QTL containing TOR1 and TOR2 on chromosomes 10 and 11, respectively (Figure 3B). In contrast to other eukaryotes, yeast carries two copies of TOR. As in higher organisms, TORC complexes respond to nutrient signals to regulate a plethora of cellular processes through two functionally distinct complexes. In yeast, Tor1p is specific to TORC1 complexes, while Tor2p is able to participate in both TORC1 and TORC2 complexes [35]. Caffeine inhibits Tor1p function [36], leading to the activation of the CWI pathway [37]. We identified a TOR1 QTL in eight of the twelve crosses, illustrating the large impact of TOR1 on the genetic architecture of caffeine resistance. TOR2 QTL were found in five crosses, and their identification likely speaks to Tor2p’s ability to functionally compensate for Tor1p in TORC1 complexes.
However, the QTL we detected as encompassing TOR genes were not mutually exclusive. In the four cases where we found both TOR1 and TOR2 QTL within the same cross, resistance alleles originated from the same or different parent strains an equal number of times. Furthermore, TOR negatively regulates transcription factors that are activated by the HOG pathway in response to stress (reviewed in [11]). Indeed, we uncovered salt resistance QTL containing TOR2 in three crosses (Supplemental Table S4).
In addition to these QTL shared among many of the Round-robin crosses, several other QTL had large effects in a smaller number of crosses and contain genes with well-established roles in cellular signaling. A caffeine resistance QTL shared between crosses 2 and 3 encompasses MSS4, which encodes the essential Phosphatidylinositol-4-phosphate 5-kinase required for activation of the CWI MAPK pathway [38]. Two additional large effect QTL highlight the interconnectivity of the cellular signaling network. These QTL on chromosomes 10 and 15 strongly influenced growth in the presence of both high salt and caffeine. The QTL on chromosome 10 contains CYR1, the adenylate cyclase essential for cAMP production and as such cAMP-PKA signaling [39]. Similar to TOR, the cAMP-PKA pathway responds to nutrient signals to modulate a myriad of cellular processes, including the negative regulation of stress response transcription factors (reviewed in [11]). The QTL on chromosome 15, on the other hand, includes a gene that represents a functional counterpart to this aspect of cAMP-PKA signaling: WHI2 encodes a phosphatase required for activation of the general stress response [40].
Impact of strain history and source on QTL identified
While trait variation among S. cerevisiae isolates is great in comparison to related fungal species [10], the evidence for adaptive alleles is scant [9,41]. Rather than being strongly shaped by their source environment, yeast phenotypes have been proposed to be a result of population history [10]. The ENA locus illustrates this pattern. The introgression of the S. paradoxus ENA variant is widespread in European isolates regardless of their source environment. Our parent strains included European clinical and vineyard isolates, yet these ecological niches had no bearing on the ENA QTL we identified in crosses involving these strains. We wondered if alleles, denoted by the strain they derived from, tracked with source environment for any of the other QTL. We examined QTL detected in non-overlapping crosses (Supplemental Table S7), which excludes QTL likely due to single instances of loss- or gain-of-function mutations, and found two QTL where the grouping of alleles was unlikely to be a result of shared population history. Caffeine resistance alleles that gave rise to TOR2 QTL belonged to wine and clinical strains from a diverse range of geographic sources, while the corresponding sensitive alleles stemmed from natural isolates, such as oak strains. A salt resistance QTL on chromosome 15, containing YGK3, which encodes a stress response controlling kinase, exhibited a similar pattern: a European and an American clinical strain contributed resistance alleles, while diverse natural isolates supplied sensitivity alleles. Further studies are needed to clarify whether these two cases are coincidental or whether they represent cases of environmental adaptation.
Identification of MAT-dependent growth QTL
Yeast mating, akin to the stress responses examined above, is regulated by a MAPK signaling pathway. In addition to providing us with independent selection experiments, our ability to isolate mapping populations of either mating type allowed us to search for variants that influence growth through a genetic interaction with the mating type locus. Fitness differences between the two mating types have been reported [42,43], and we have shown that the MAT locus influences the differential expression of numerous genes [13]. In order to detect MAT-dependent growth QTL, we directly compared the allele frequencies resulting from corresponding MATa and MATα selection experiments.
For the round-robin crosses, we first compared the permissive YPD selections for each mating type. Among the twelve crosses, we identified six significant QTL (Supplemental Table S8). One of these QTL appeared in two non-neighboring crosses and encompassed the mating pathway regulator GPA1 located on chromosome 8. Polymorphisms within Gpa1, which negatively regulates the mating pathway, can impair its function and hence result in costly activation of the pathway in the absence of mating pheromone [44]. Importantly, the GPA1 allele selected for in one of our QTL experiments (Figure 4) contains a known fitness-associated variant [44,45]. We previously uncovered a genetic interaction between the MAT locus and GPA1 that affects the expression of other mating pathway genes [13]. While this interaction did not result in a growth QTL in the BY/RM cross, our identification of MAT-dependent GPA1 QTL suggests that this interaction can have an effect on growth in other genetic backgrounds. In addition to the GPA1 QTL, we identified a QTL containing SST2, which encodes the GTPase-activating protein for Gpa1 [46].
Mating type dependent QTLComparison of allele frequencies within MATa and MATα populations revealed loci that affect growth in a mating type dependent manner. The QTL on chromosome 8 encompasses GPA1, a negative regulator of the mating pathway that affects fitness in different strain backgrounds [1]. Chromosome 3 was omitted as it contains the mating type locus itself (see Supplemental Table S8 for all mating type dependent QTL identified).
Next, we asked if mating type had any influence on the allele frequency distributions arising under the two MAPK-inducing stress conditions. We found 19 instances of MAT-dependent stress resistance QTL (Supplemental Table S8). While it is difficult to determine whether these QTL represent an instance of MAT-dependence or failure to replicate a weak QTL, 14 of these QTL were identified in independent experiments using different dosages of the same stress condition or in both stress conditions. Among the latter group, we found that the GPA1 and SST2 mating type dependent QTL persisted in the presence of either stress condition. The mating and HOG MAPK pathways share the MAPKKK Ste11, and several studies have investigated how signaling specificity is achieved despite this shared signaling component [47,48]. In particular, faithful signaling along either pathway could be maintained by either mutual inhibition [47] or pathway insulation [48]. Our results suggest that the baseline fitness cost of the mating pathway [44] remains unaltered in the face of stressors that activate other MAPK cascades, which is consistent with the insulation of the mating MAPK from other MAPK signaling cascades [48].
Utilizing the Round-robin design to identify causative variants
The Round-robin design enables a strategy to identify candidate causative variants that is not available using pairwise crosses. Specifically, the segregation of individual variants in relation to the presence or absence of QTL in multiparental crosses can be leveraged to reduce the search space of candidate causative variants [49,50].
Many sequence variants occur in several of the Round-robin crosses and, assuming additive effects independent of genetic background, should have similar consequences in these different crosses. We generated de novo assemblies of the parent strain genomes [51] and cataloged the non-synonymous coding variants in each QTL. We determined whether a given variant segregated within each cross by examining if the respective parent strains carried different alleles of the variant. For each QTL, we then assessed to what extent the segregation of a particular variant in each cross was associated with the detection of the QTL in the crosses (Supplemental Table S4). We used the maximum LOD scores within a particular QTL interval for each cross as a quantitative measure of QTL detection. This association analysis resulted in a 17-fold reduction in the number of variants to be considered as potentially causative for each QTL. We confirmed causality of individual sequence variants in two QTL to illustrate how this approach can aid in the identification of causal variants.
We first focused on the QTL on chromosome 15 that contained the stress response regulator WHI2 [40] and strongly influenced the resistance to both salt and caffeine in crosses 7 and 8 (Figure 5A). Both crosses shared CLIB219 as a parent strain, and in both sets of experiments, the CLIB219 allele was strongly selected against, indicating that it leads to stress sensitivity. As this QTL did not appear in this form in other crosses besides the two involving CLIB219, the causative variant likely was private to CLIB219. Four variants out of 64 variants in the region were private to CLIB219 (Figure 5B). One of the variants was a frame-shift mutation in WHI2. Allele replacements of the CLIB219 allele of WHI2 resulted in reduced growth in the presence of high salt and caffeine and thus confirmed that it was indeed the causal variant (Figure 5C).
Leveraging the Round Robin design to identify causative variants (A) A QTL on chromsome 15 affects salt and caffeine resistance in crosses 7 and 8 (with smaller effects in other crosses). The CLIB219 is shared between the two crosses and in both cases it contributes the allele is selected against, suggesting that the causative variant is private to CLIB219. (B) We determined the association of coding variants within this QTL interval with the observed pattern of LOD scores. The highest association scores were exhibited by four variants private to CLIB219; one a frame-shift mutation in WHI2. (C) Allele replacements of WHI2 in the CLIB219 strain background. The CLIB219-specific frame shift mutation resulted in decreased growth in the presence of both high salt and caffeine. (D) Identification of a quantitative trait nucleotide (QTN) within the caffeine resistance QTL on chromosome 10. The QTL was identified in eight crosses and is multi-allelic as specific alleles were beneficial or deleterious depending on a particular cross. (E) Measuring the association of variants and LOD scores confirmed that no single variant could explain the observed pattern of QTL and indicated a TOR1 SNP (3875 G −> A) as a QTN (red circle). (F) Introduction of the TOR13875A variant into two strain backgrounds, YJM269 and 273614x, reduced resistance to caffeine. For each allele replacements two independent transformants are shown.
Next, we turned to a QTL with a substantially more complex allelic pattern. The TOR1-containing caffeine resistance QTL on chromosome 8 was identified in eight crosses. Specific alleles were selected for or against depending on the particular cross, which was a clear indication that multiple alleles were present at this QTL (Figure 5D). While no single variant perfectly recapitulated the pattern of LOD scores (Figure 5E), two SNPs in TOR1 and NTA1 scored the highest. Closer examination of the segregation pattern of these SNPs revealed that they were common to two caffeine sensitive strains, M22 and YJM981. Allele replacements of the TOR1^3875A^ variant in two strain backgrounds confirmed that it contributes to caffeine sensitivity (Figure 5F). These results demonstrate how the Round-robin crossing scheme can be leveraged to focus the list of candidate causative variants.
Discussion
Here, we have demonstrated the ability of a novel QTL mapping approach to query a large proportion of S. cerevisiae genetic diversity. We employed this approach to characterize the genetic architectures of three MAPK-dependent traits: resistance to high salt or caffeine and growth differences due to mating type. The relationship of the identified genetic variants to MAPK signaling pathways ranged from upstream modulators to core regulators and downstream targets.
Our modified X-QTL approach makes it possible to rapidly generate large mapping populations without extensive strain engineering. Quantitative trait mapping studies in yeast have uncovered the genetic architectures of traits central to biology, such as gene expression and protein-level variation [14,19,52], as well as traits of medical and industrial importance [15,53]. Yet, these studies have only scratched the surface of the phenotypic variation of S. cerevisiae strains [10,20], a space that is sure to expand with the continued discovery of additional yeast isolates [54,55]. Our method promises to be of great utility in future yeast QTL mapping studies. Here, we have chiefly used our approach to isolate large pools of segregants for BSA-based QTL mapping, but we also illustrate its utility in isolating individual segregants that can be used in traditional linkage-based QTL mapping studies. In contrast to previous methods [18,56], our method can be employed in nearly any strain background with minimal strain engineering and enables positive selection for haploids of either mating type. Furthermore, the fluorescent mating type markers are amenable to combination with fluorescent readouts of cell physiology or gene expression [18,19]. Such reporter combinations will make it feasible to isolate mapping populations and select for phenotypes of interest simultaneously.
We have genetically dissected stress resistances mediated by two MAPK pathways, as well as interrogated the genetic contribution to the baseline cost of the mating pathway. We studied twelve diverse yeast strains that represent a large proportion of the genetic and phenotypic diversity of S. cerevisiae. Thus the QTL identified capture much of the species-wide genetic variation that influences the phenotypic consequences of these MAPK pathways. We identified QTL that encompass genes connected to MAPK signaling at multiple levels (Supplemental Table S4). Several QTL contained genes whose protein products are responsible for the first step of the MAPK signaling cascades: osmosensors (MSB2 & SHO1) and CWI sensors (WSC3 & MTL1) responsible for detecting the respective perturbations. Moving along the signaling cascades, we found several key regulators such as MSS4 and GPA1. Furthermore, one of the caffeine tolerance QTL contained SLT2, which encodes the MAPK at the center of the CWI response. Arriving at the output of the signaling pathways, we identified several genes transcriptionally activated in response to stress. In addition to the ENA genes, we found GPG1, which is activated by the HOG pathway to increase glycerol synthesis to counteract changes in osmolarity [57]. Finally, although the resistance phenotypes of the parent strains were not correlated, thirteen QTL occurred under both conditions. The overlap between QTL is consistent with crosstalk between the two stress responsive pathways [58,59].
In addition to genes directly associated with MAPK pathways, we found genes that highlight the interconnectivity of the cellular signaling network. Variants in CYR1 and TOR2, core members of the cAMP-PKA and TOR pathways respectively, were tied to both stress responses. These pathways sense the internal availability of nutrients and repress the general stress response [11]. The TOR pathway in particular regulates a myriad of functions that mediate cell growth [60]. In contrast to higher eukaryotes, yeast carries two copies of the TOR gene. Our study links numerous alleles of TOR1 and TOR2 to differential growth under stress conditions.
The two Tor proteins are redundant in regards to their participation in TORC1 complexes, but only Tor2p can partake in TORC2 complexes [35]. Despite this difference, the two TOR genes are diverging at the same rate as the majority of duplicated gene pairs [61]. However, these studies were based on individual strains. Our QTL results point towards functional variation in both Tor isoforms and raise questions about how they jointly regulate cell growth in different yeast isolates. Are the roles of the two proteins in TORC1 complexes truly equivalent, or are the TOR alleles indicative of functional tradeoffs? Similarly, it bears determination whether stress sensitive alleles of the TOR2 QTL, which were found in natural rather than ‘domesticated’ isolates, are beneficial under conditions approximating their source environment.
The identification of WHI2 further echoes the interplay between internal nutrient and external stress sensing pathways. While WHI2 is required for the activation of stress response pathways [40], its loss leads to prolonged growth under nutrient limited conditions [62]. Interestingly, WHI2 loss-of-function alleles were found to be driver mutations in experimental evolution experiments [63,64]. Variants that abrogate Whi2 function were also discovered as recurrent secondary site mutations in yeast strains with specific gene deletions [65]. As such, whi2 mutants not only illustrate how laboratory evolution experiments can recapitulate the biology of wild isolates, but also suggest that the concomitant loss of stress responsiveness is adaptive under permissive growth conditions [63,64]. Indeed, the WHI2 allele responsible for stress sensitivity was advantageous for growth under the permissive YPD condition.
The QTL results provide insights into the types of genes that carry variants shaping MAPK-associated phenotypes of different yeast isolates. The core elements of the HOG and CWI signaling cascades (HOG: SSK1, SSK2, STE11, PBS2, and HOG1; CWI: RHO1, PKC1, BCK1, MKK1, MKK2, and SLT2) are highly conserved across species. Analysis of the strain sequences revealed that despite their species-level conservation, all of these core proteins, with the exception of Rho1p, contain instances of non-synonymous coding variants. Yet, we only identified QTL at SLT2, indicating that the coding variants in the other core genes may be of little functional consequence.
In contrast to the central cascade, proteins responsible for sensing perturbations in osmolarity or cell wall integrity diverge rapidly between yeast and related fungal species [12,66]. Divergent sensor proteins in other species are thought to enable the response to different habitats. For instance, other fungi use the HOG pathway to respond to a broader range of stresses than S. cerevisiae (reviewed in [11]). Consequently, we wondered if variation in sensor genes underlies the observed stress resistance variation among different S. cerevisiae isolates. We found stress sensors at two QTL for both salt and caffeine resistance, but these QTL had low LOD scores indicative of small effect variants. This is likely explained by the large degree of redundancy among the sensor proteins [67,68]. Osmosensors are encoded by a set of five genes, and CWI sensors are encoded by six genes. While sensor redundancy allows for species-level fine-tuning of the stress responses, any single change is unlikely to have large phenotypic consequences. The same holds true for the large number of transcriptional targets of the MAPK pathways, with the exception of special effectors such as the introgressed ENA variants and GPG1 [69]. In contrast, many genes associated with large effects, such as CYR1, GPA1, MSS4 and TOR1/2, have functions essential to the MAPK and other signaling pathways. Together, these findings illustrate how genetic variants shape the phenotypic space of MAPK stress resistance traits within S. cerevisiae. The global picture that emerges from our results is that genes thought to underlie phenotypic differences between fungal species due to their high levels of divergence contribute little to trait variation among S. cerevisiae isolates.
The QTL we identified fall into several different classes in regards to their appearance among the twelve round-robin crosses. 33 of the 60 grouped QTL were ‘context dependent’, meaning they were detected in a single cross. The preponderance of ‘context dependent’ QTL was also notable in studies involving smaller panels of pairwise crosses [21,29]. Context-dependency has been attributed to interactions between QTL and the genetic background. In particular, large effect variants can mask the presence of small effect variants [30,31]. For salt resistance, the negative correlation between parent strain phenotype differences and the number of QTL identified was largely driven by the large effect of the ENA locus. For example, Cross 7 between two sensitive parent strains lacking the ENA introgression permitted the detection of a large number of small effect QTL. Of the twelve QTL detected in exactly two crosses, seven appeared in crosses involving the same parent strain, and as such can be classified as ‘strain dependent’ [29]. This set of QTL likely results from single alleles private to the shared parent strain [21]. Beyond this simple case, deducing the number of underlying alleles and their frequency becomes difficult. For instance, of the eleven QTL appearing in three crosses, nine were found in a pair of neighboring crosses plus one additional cross. Several models could explain this pattern, and we attempted to use the segregation pattern of the sequence variants within each QTL to determine which alleles best explained the observed QTL pattern. While this approach resulted in a significant reduction in the number of variants to consider, more than twelve crosses will be necessary to distinguish between the possible allele patterns with certainty. Going forward, our fluorescent markers allow facile creation of segregant pools from many additional crosses, as well as large mapping panels of individual segregants [17]. In conjunction with new genome engineering technologies, these approaches will enable even more complete genetic dissection of MAPK signaling and other complex traits.
The reference list from the paper itself. Each links out to its DOI / PubMed record.
- 1Seger R, Krebs EG (1995) The MAPK signaling cascade. FASEB J 9: 726–735.
- 2O’Rourke SM, Herskowitz I, O’Shea EK (2002) Yeast go the whole HOG for the hyperosmotic response. Trends in Genetics 18: 405–412.
- 3Chen RE, Thorner J (2007) Function and regulation in MAPK signaling pathways: lessons learned from the yeast Saccharomyces cerevisiae. Biochim Biophys Acta 1773: 1311–1340.
- 4Waltermann C, Klipp E (2010) Signal integration in budding yeast. Biochemical Society transactions 38: 1257–1264.
- 5Wagner EF, Nebreda AR (2009) Signal integration by JNK and p 38 MAPK pathways in cancer development. Nat Rev Cancer 9: 537–549.
- 6Saklatvala J (2004) The p 38 MAP kinase pathway as a therapeutic target in inflammatory disease. Current Opinion Pharmacology 4: 372–377.
- 7Levin DE (2005) Cell wall integrity signaling in Saccharomyces cerevisiae. Microbiol Mol Biol Rev 69: 262–291.
- 8Kvitek DJ, Will JL, Gasch AP (2008) Variations in stress sensitivity and genomic expression in diverse S. cerevisiae isolates. P Lo S Genetics 4: e 1000223.