9C continued: a radio-source survey at 15 GHz
E. M. Waldram, G. G. Pooley, M. L. Davies, K. J. B. Grainge, P. F., Scott

TL;DR
This paper presents deeper 15 GHz radio-source surveys, analyzes source counts and spectral indices, and discusses the implications for understanding radio source populations at different flux densities.
Contribution
It provides new deeper survey data at 15 GHz, compares spectral properties across flux ranges, and highlights the importance of blind high-frequency surveys over low-frequency catalogues.
Findings
No change in source count below 25 mJy.
Higher flux sources have more flat and rising spectra.
Detected sources without NVSS counterparts at 1.4 GHz.
Abstract
In our first paper we described three regions of the 9C survey of radio sources with the Ryle telescope at 15.2 GHz, constituting a total area of 520 deg^2 to a completeness limit of approximately 25 mJy. Here we report on a series of deeper regions, amounting to an area of 115 deg^2 complete to approximately 10 mJy and of 29 deg^2 complete to approximately 5.5 mJy. We have investigated the source counts and the distributions of the 1.4 to 15.2 GHz spectral index (alpha) for these deeper samples. The whole catalogue of 643 sources is available online. Down to our lower limit of 5.5 mJy we detect no evidence for any change in the differential source count from the earlier fitted count above 25 mJy. We have matched both our new and earlier catalogues with the NRAO VLA Sky Survey (NVSS) catalogue at 1.4 GHz. For samples of sources selected at 15.2 GHz, in three flux density ranges, we…
Click any figure to enlarge with its caption.
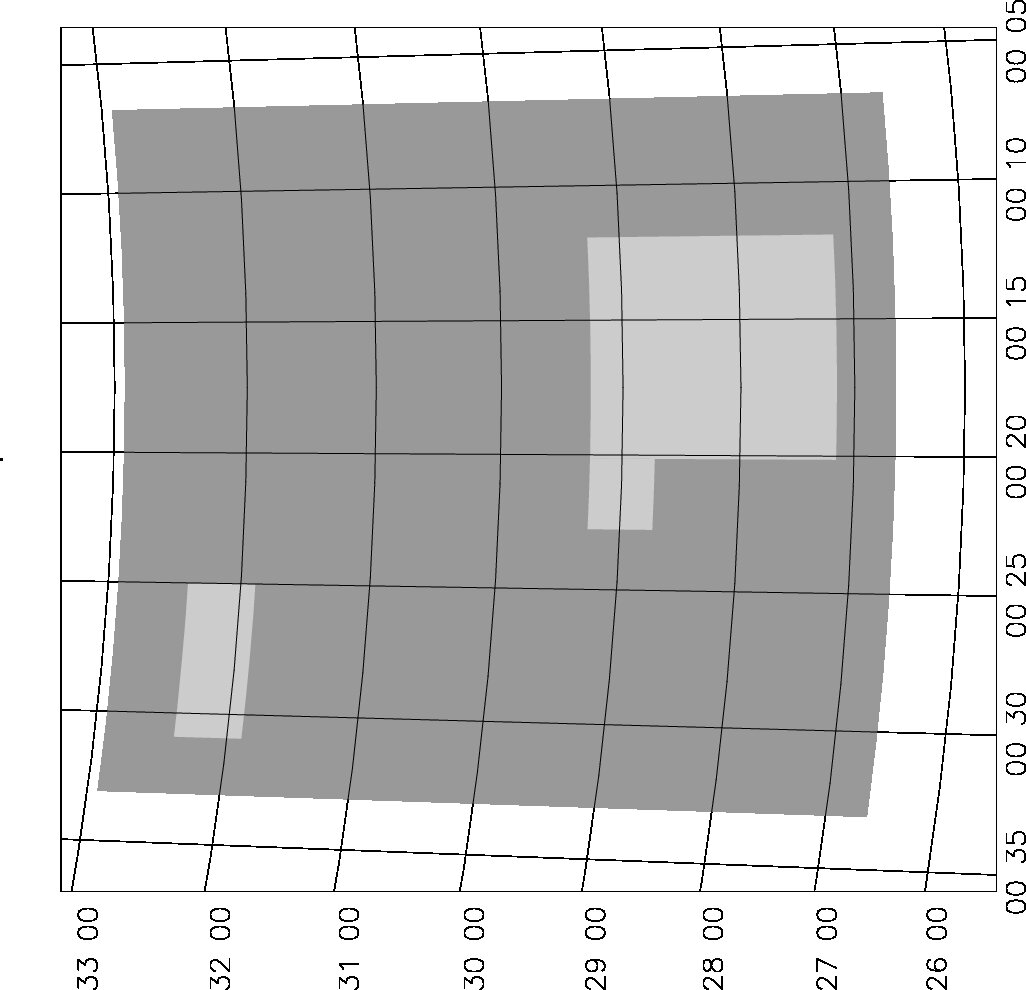 Figure 1
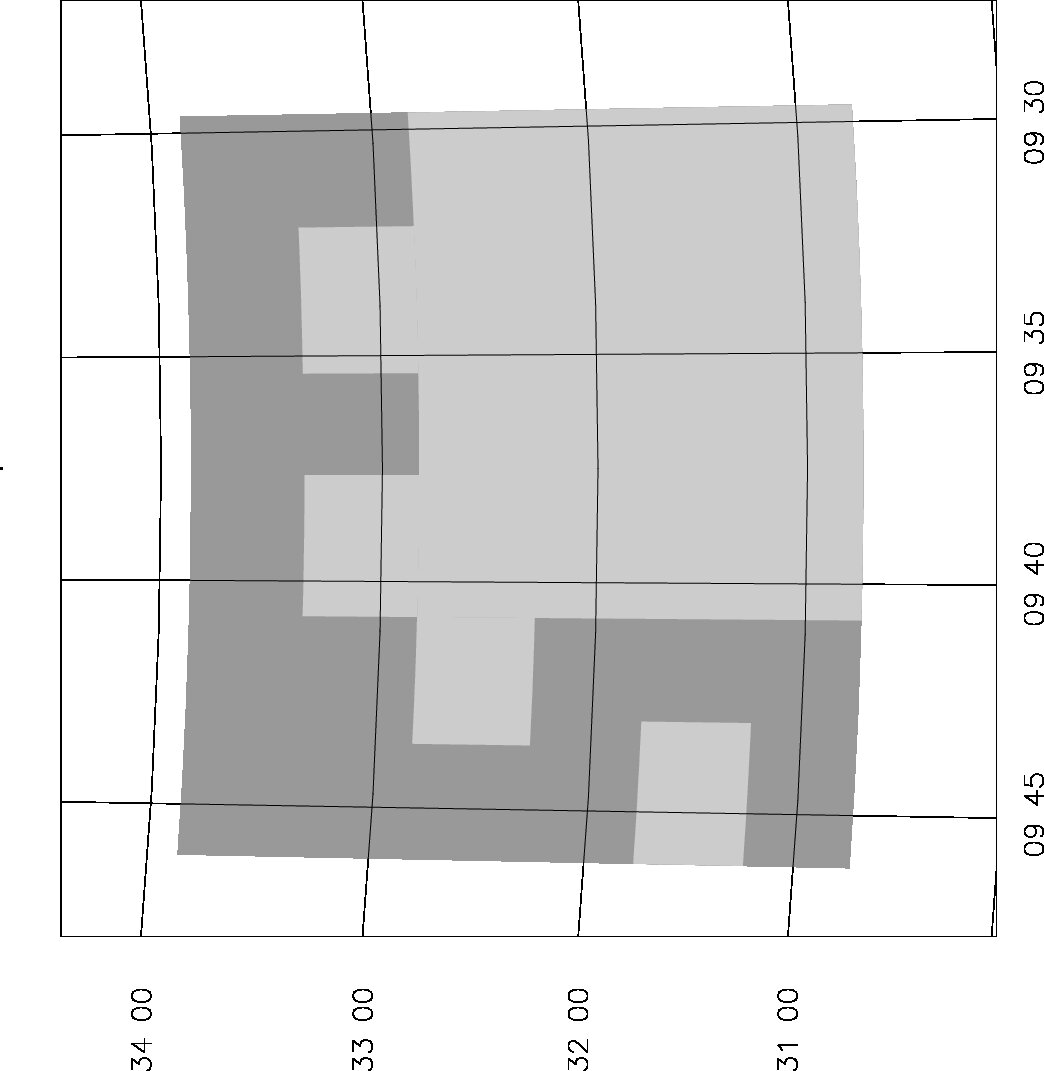 Figure 2
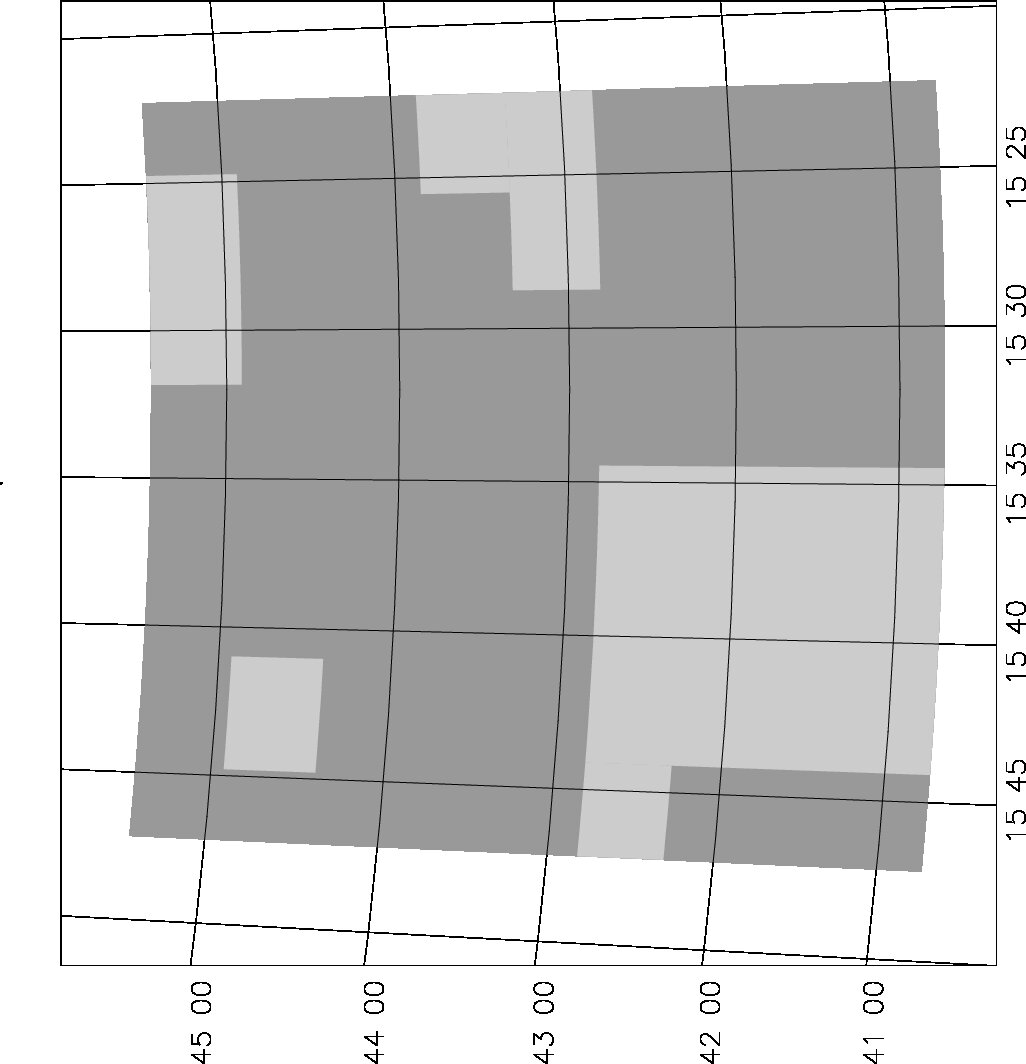 Figure 3
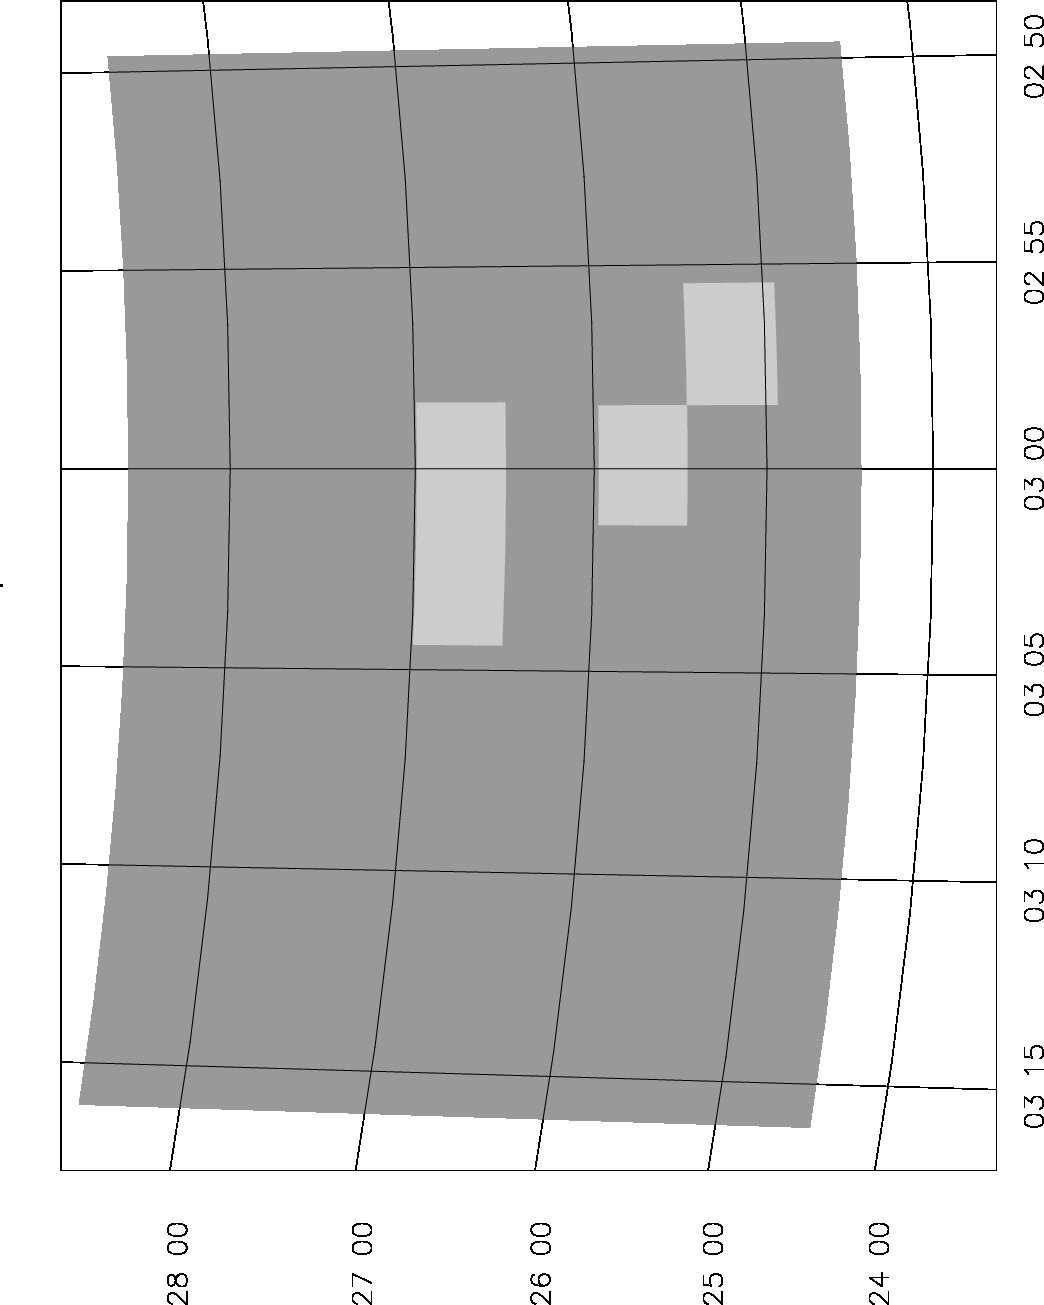 Figure 4
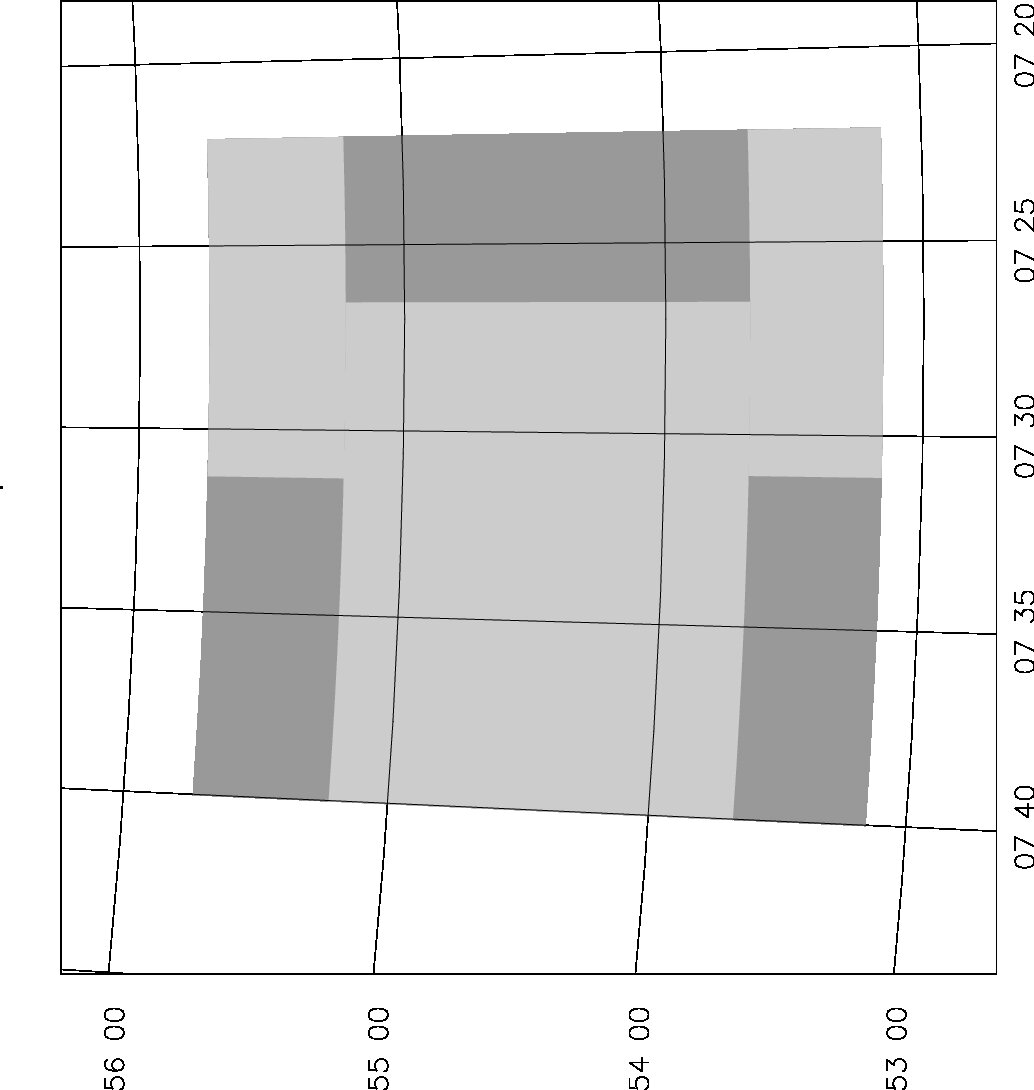 Figure 5
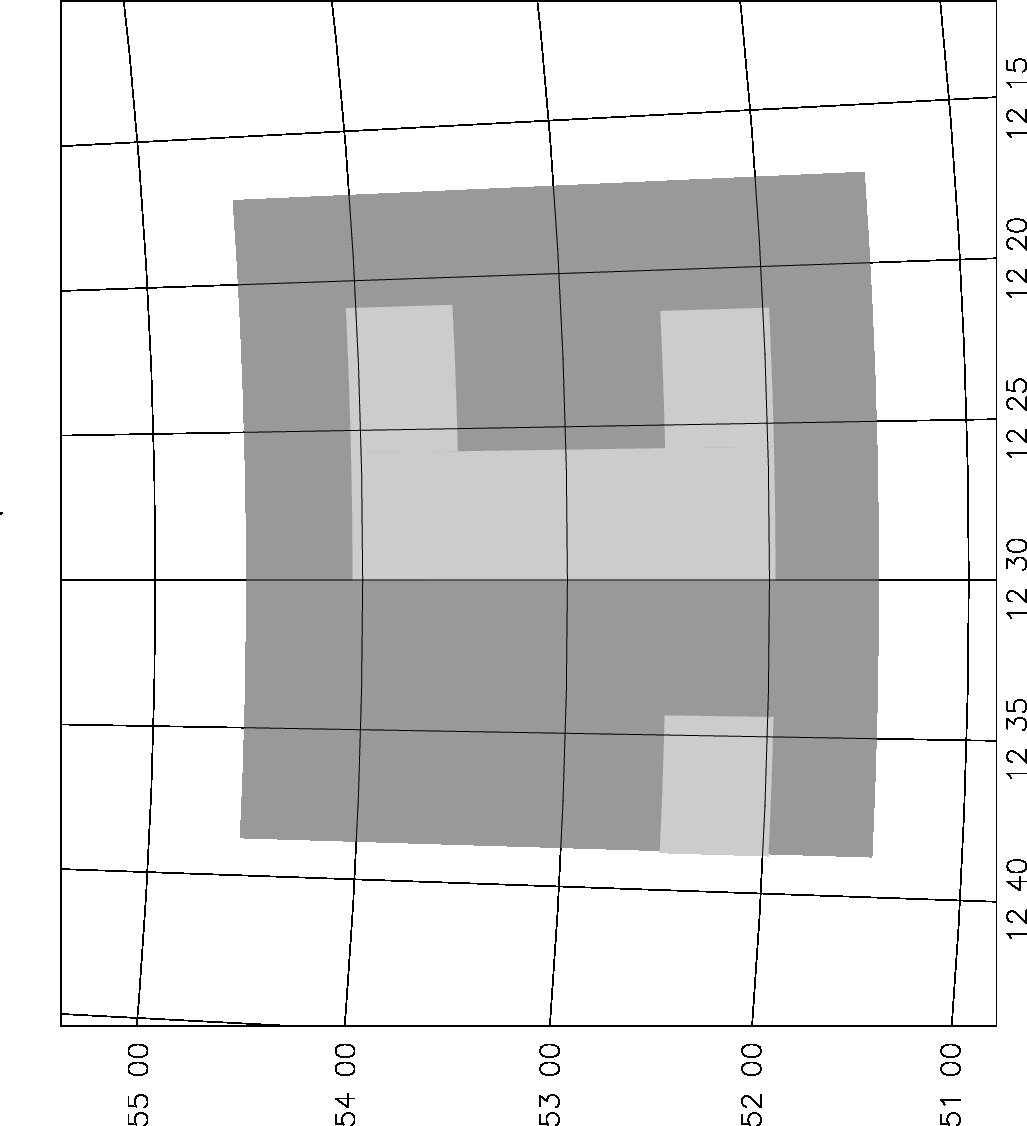 Figure 6
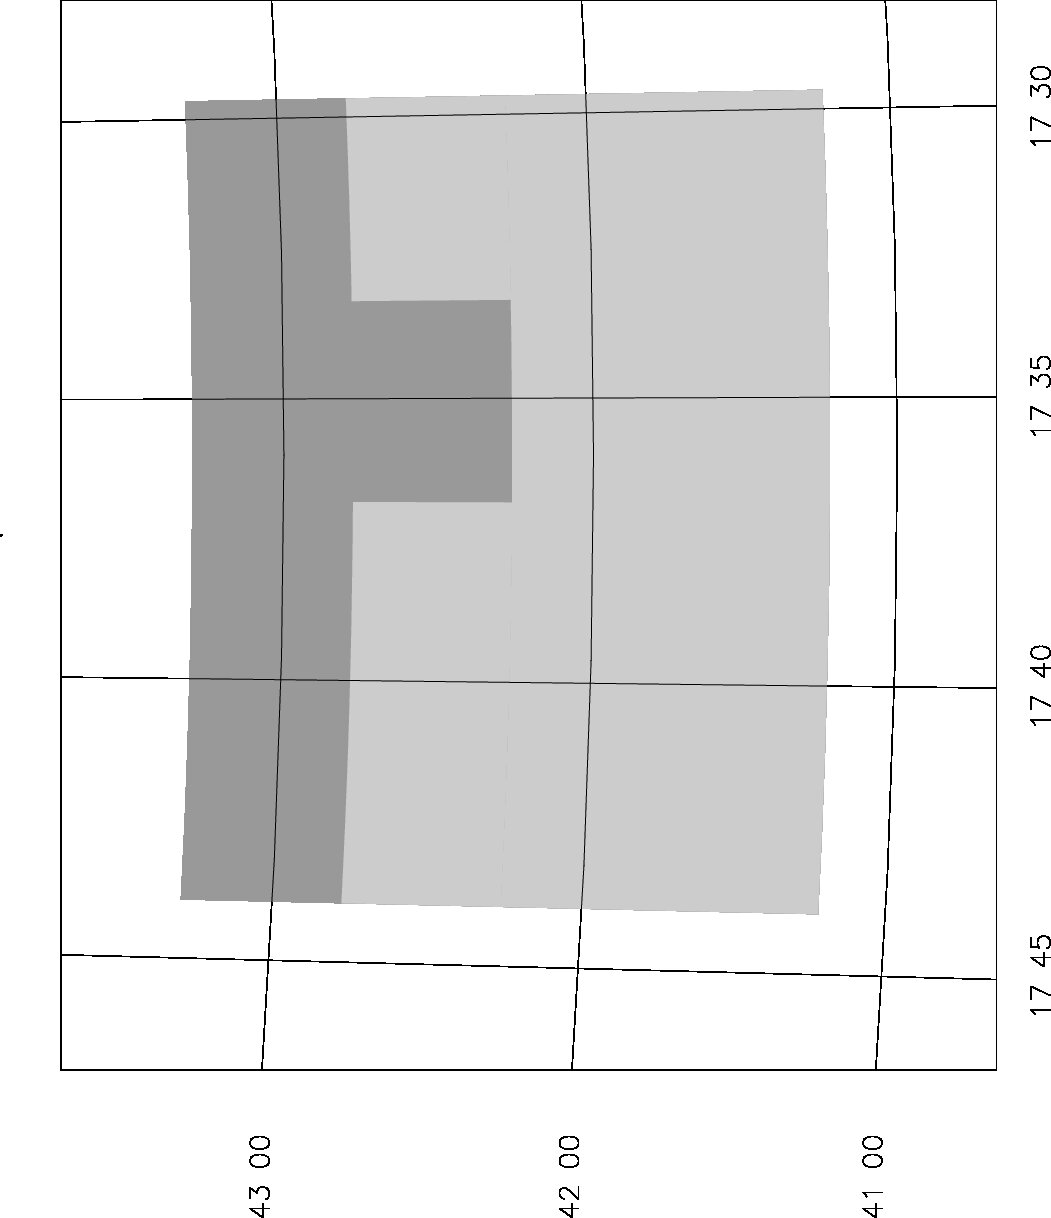 Figure 7
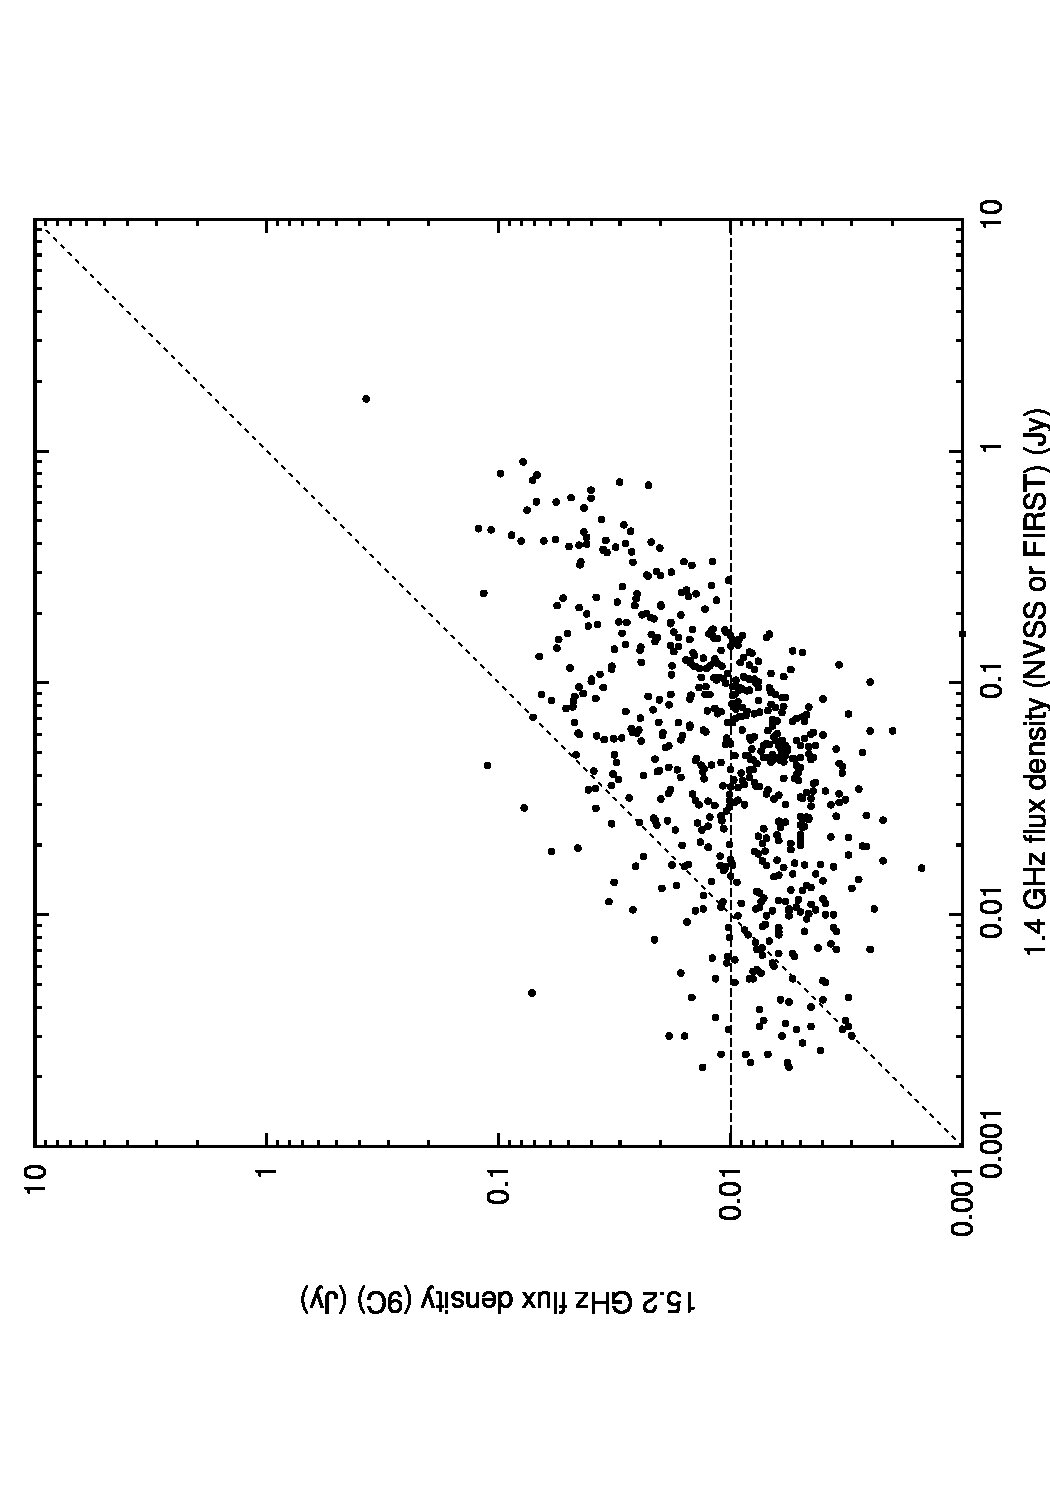 Figure 8
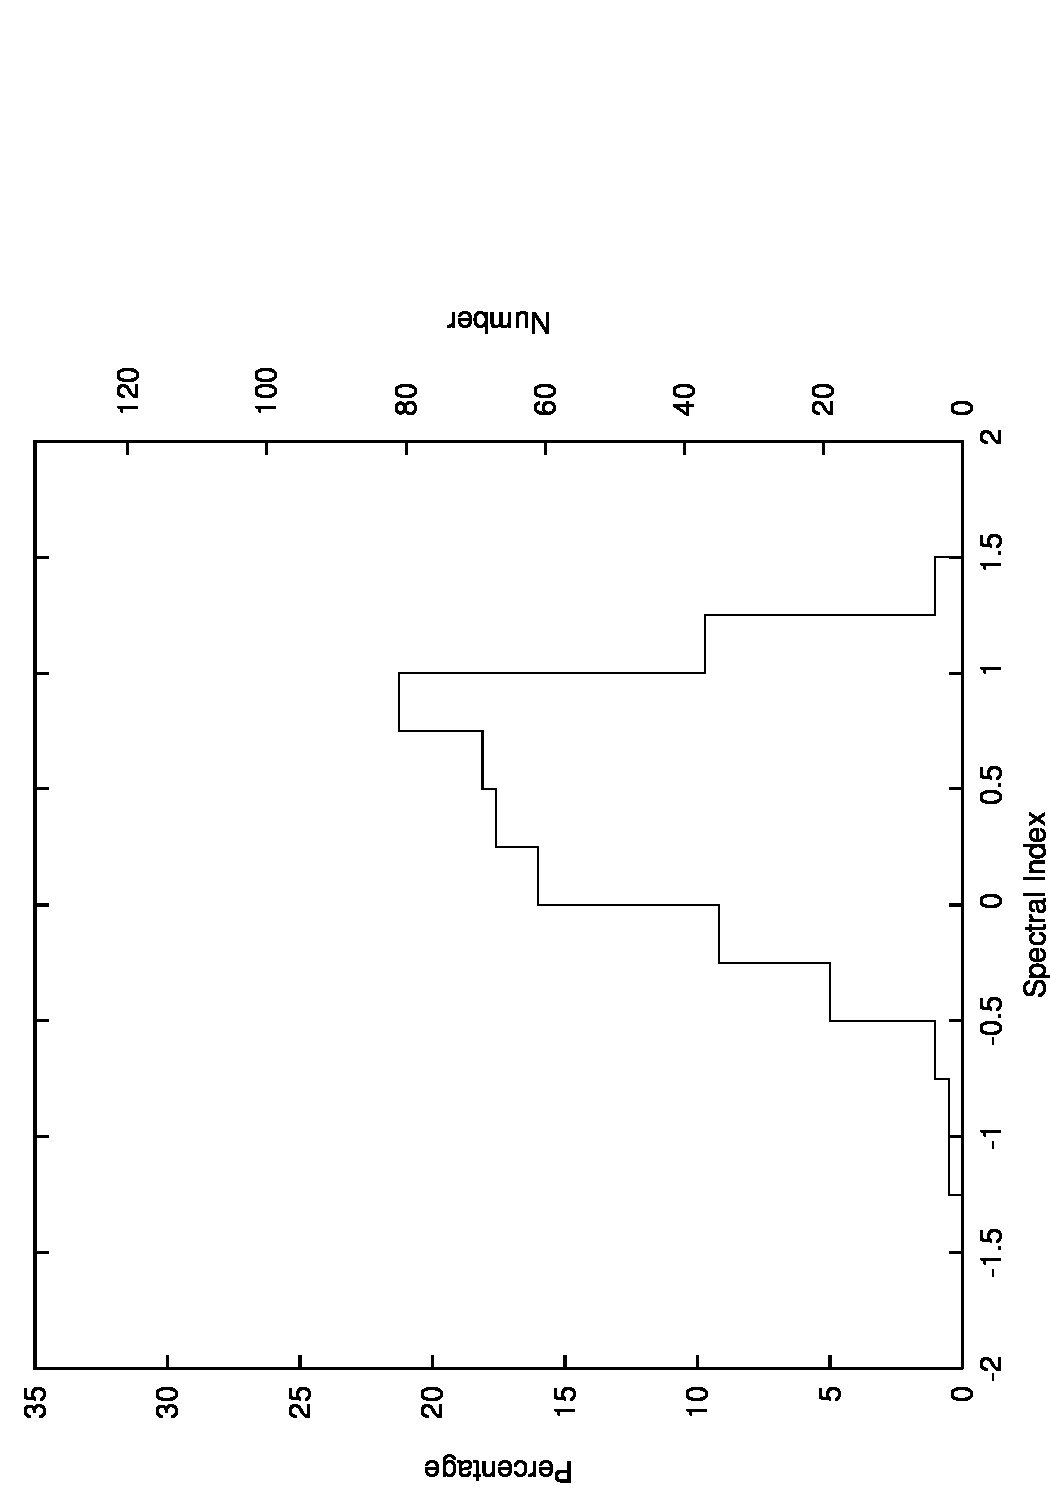 Figure 9
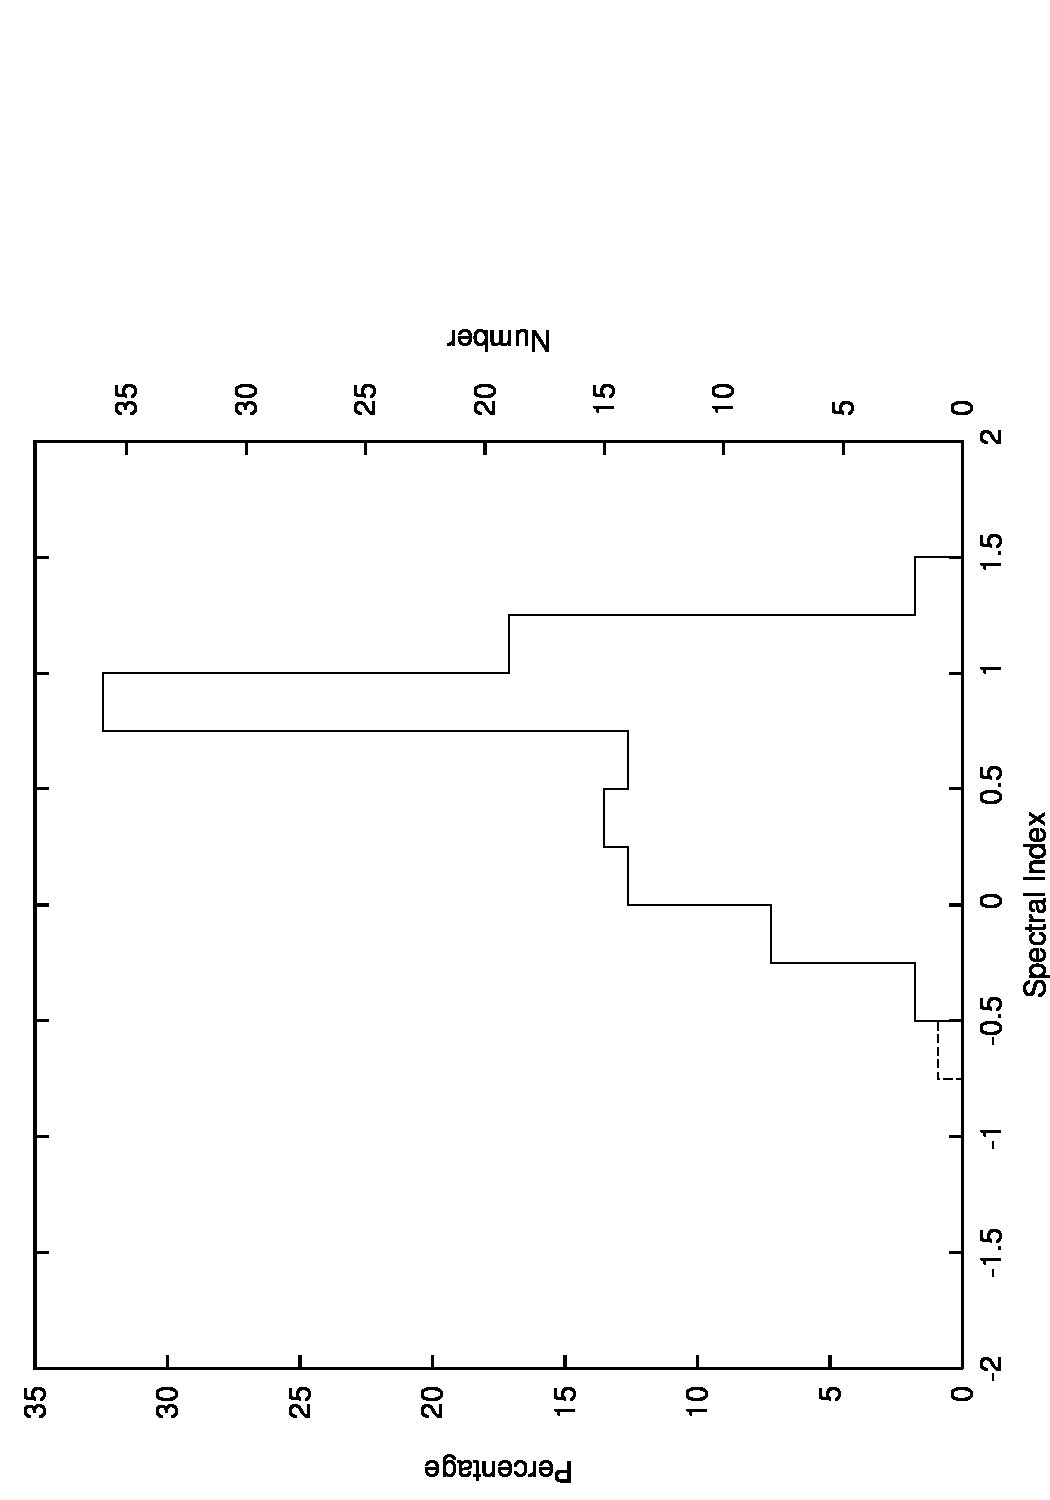 Figure 10
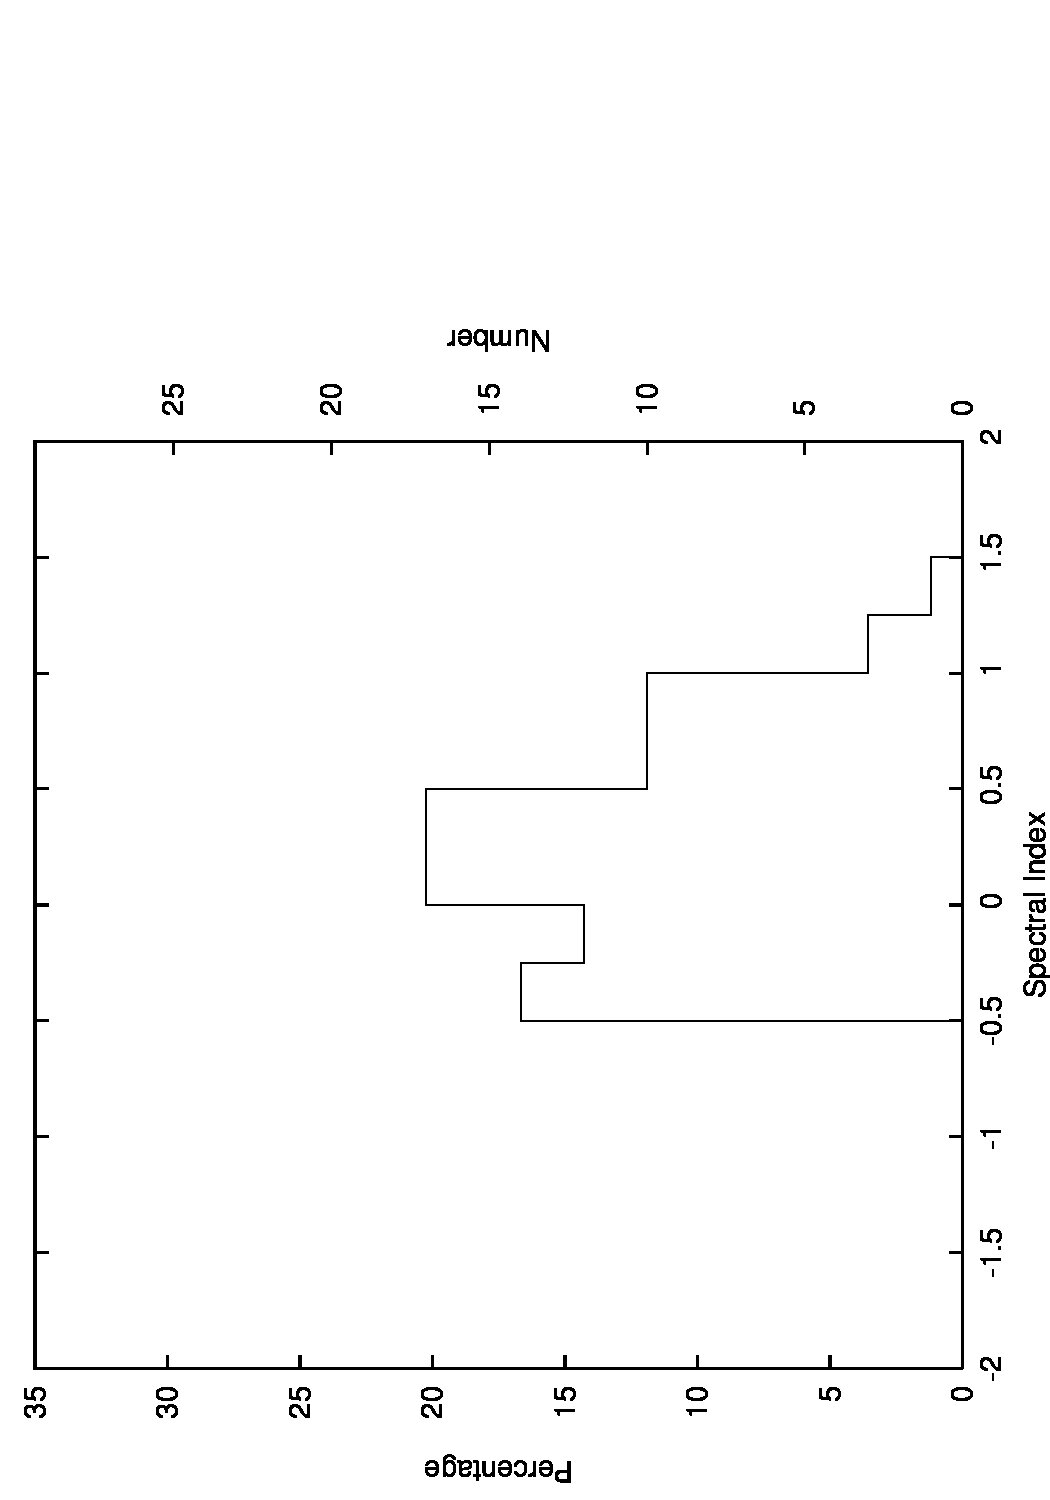 Figure 11
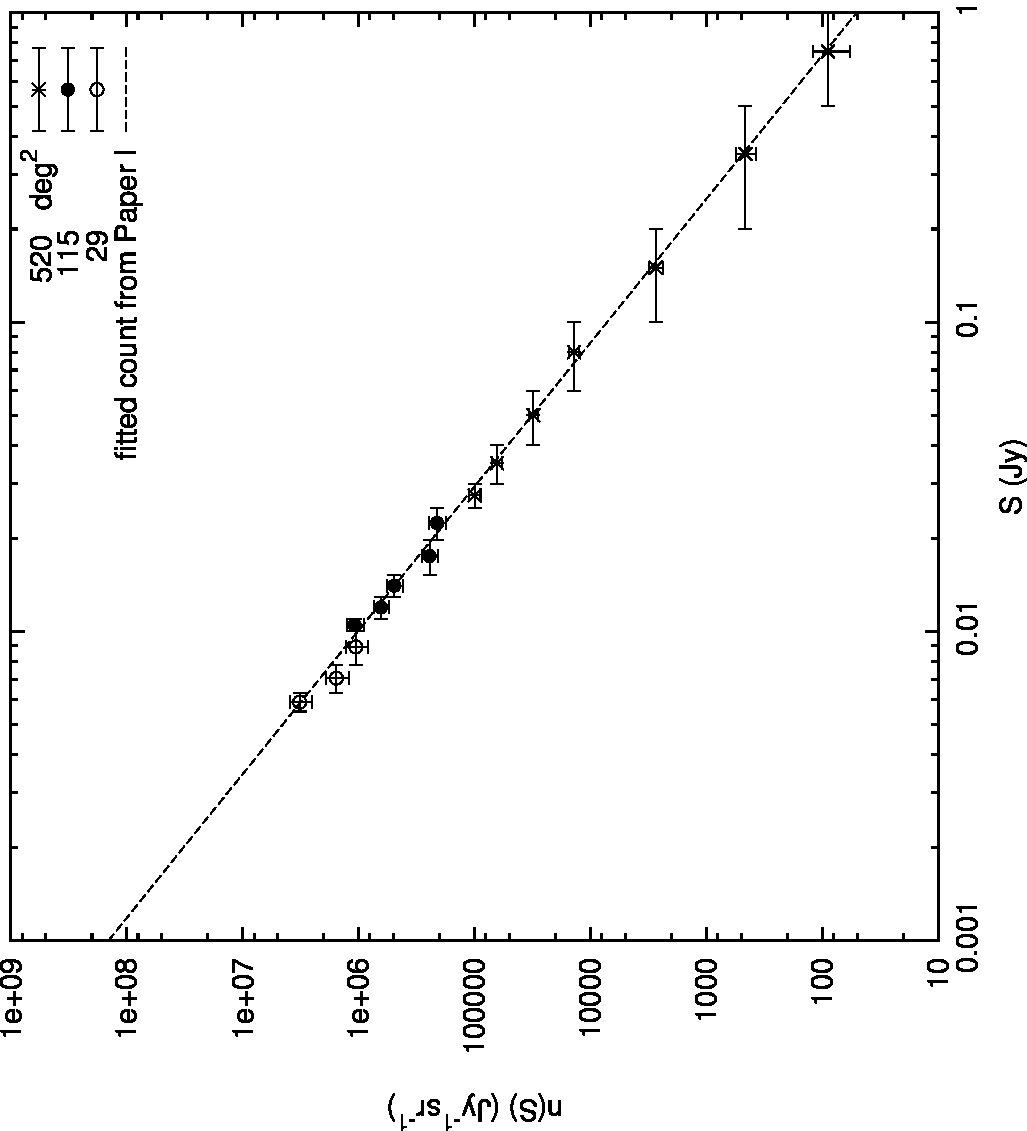 Figure 12
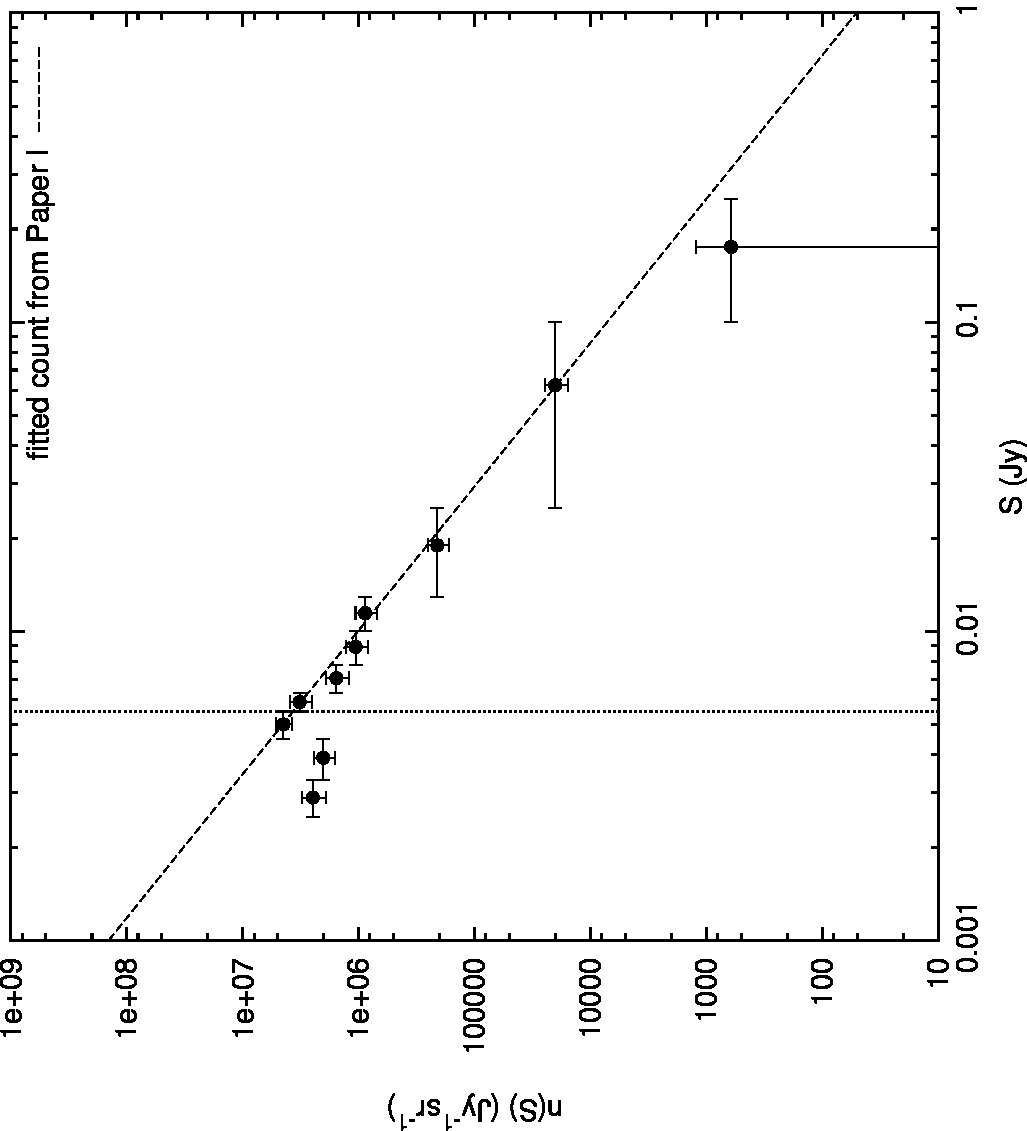 Figure 13
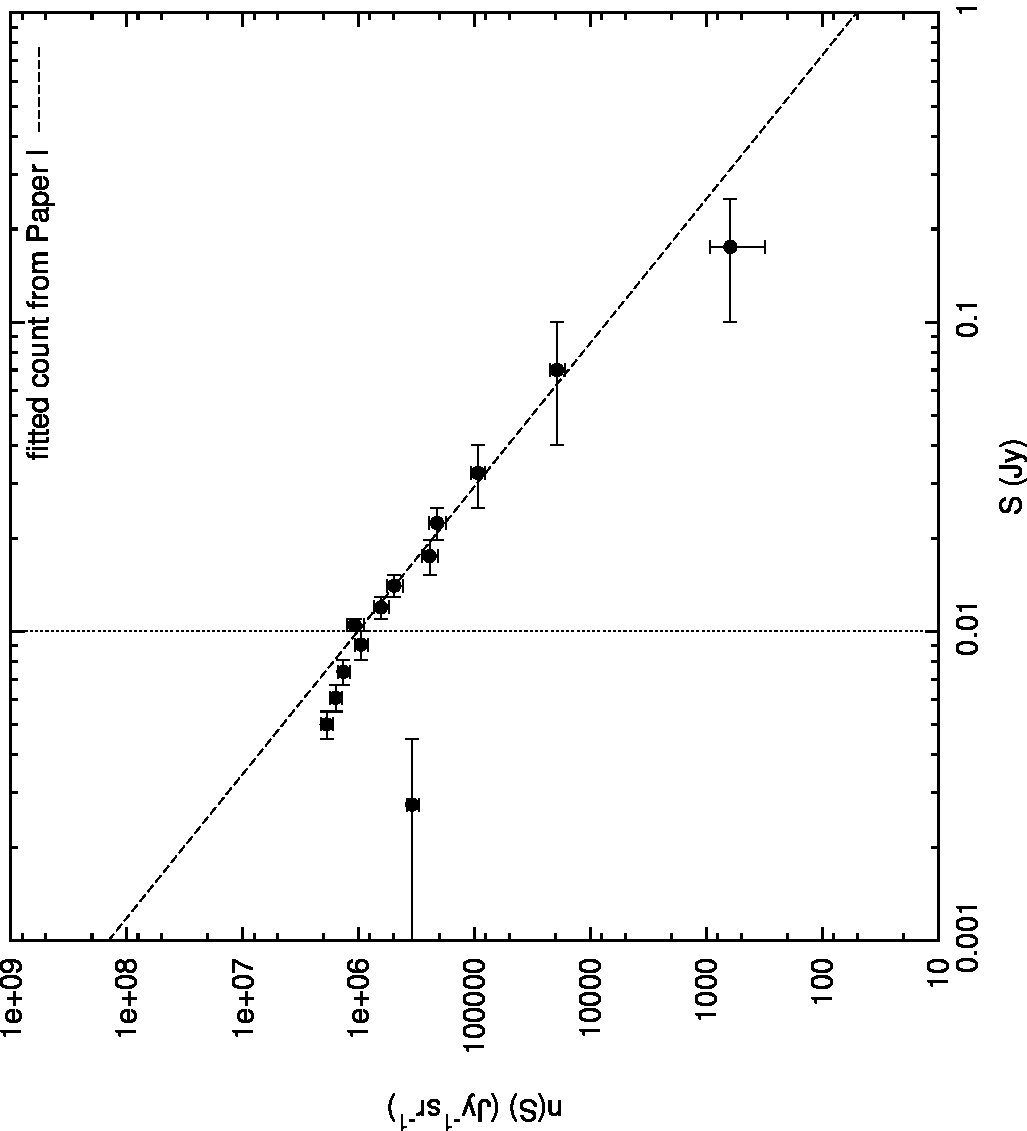 Figure 14
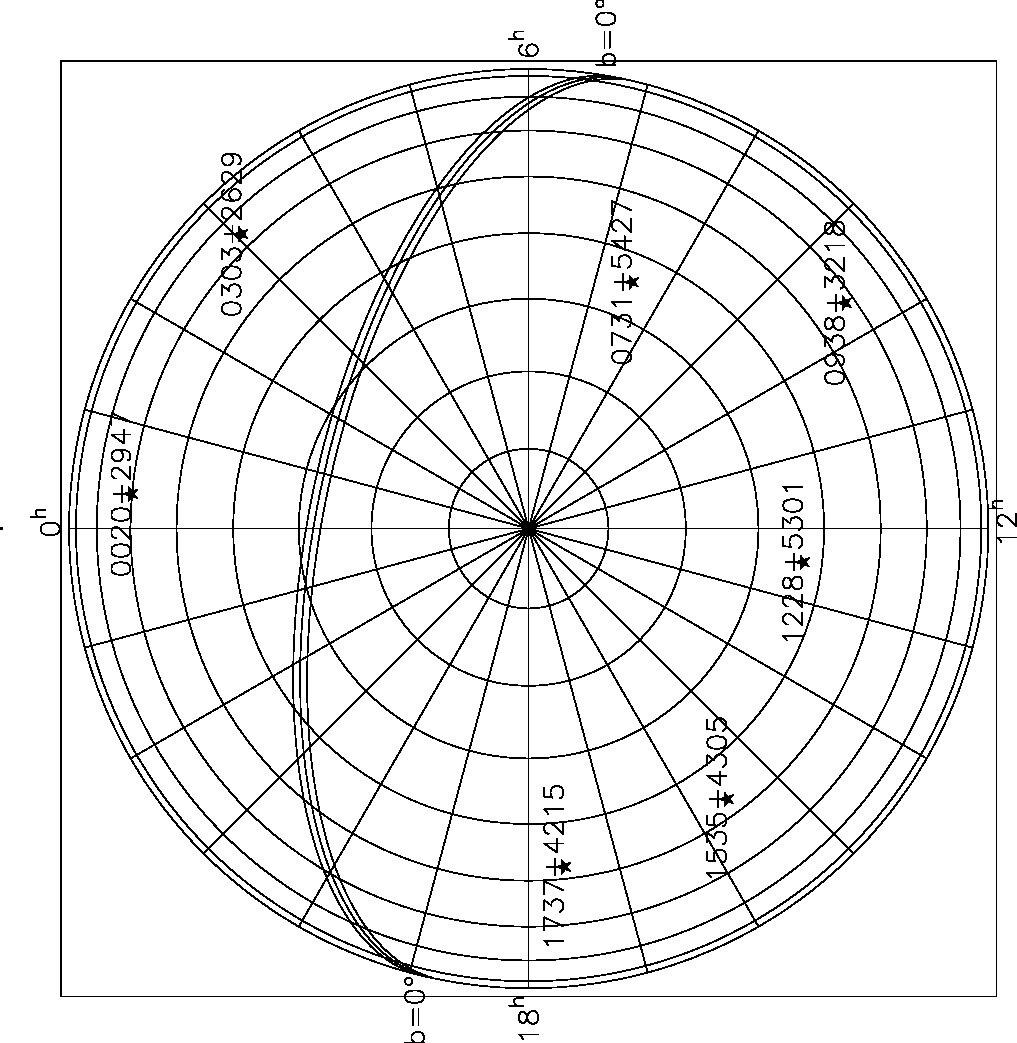 Figure 15
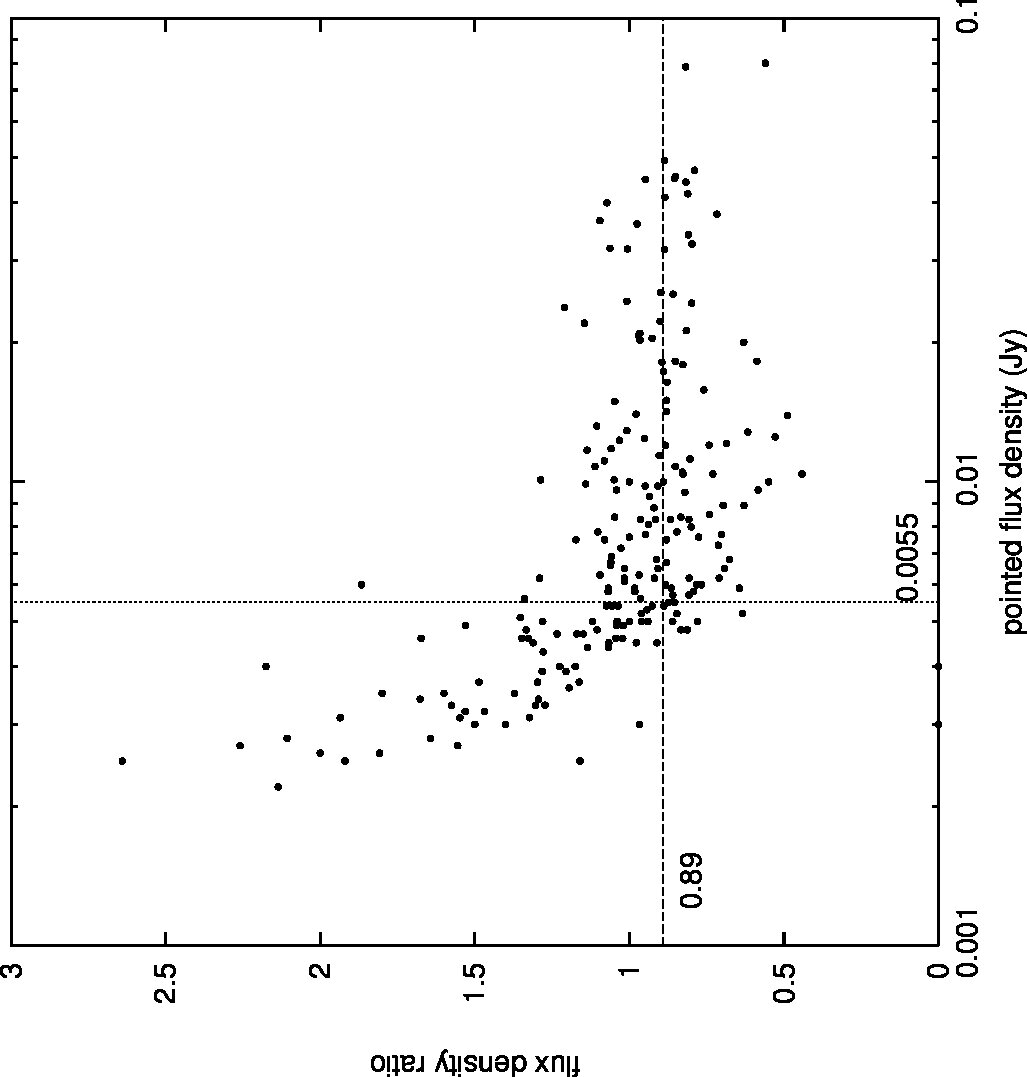 Figure 16
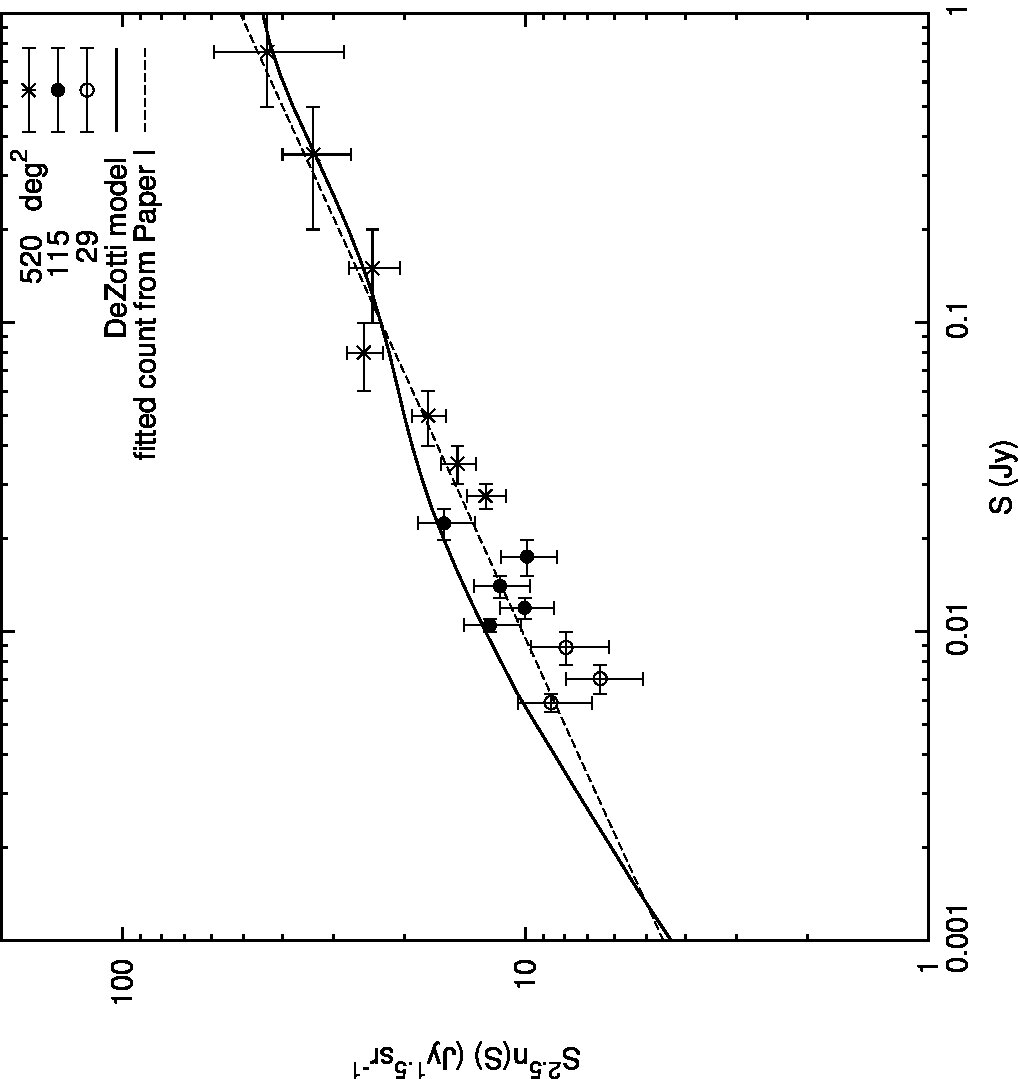 Figure 17
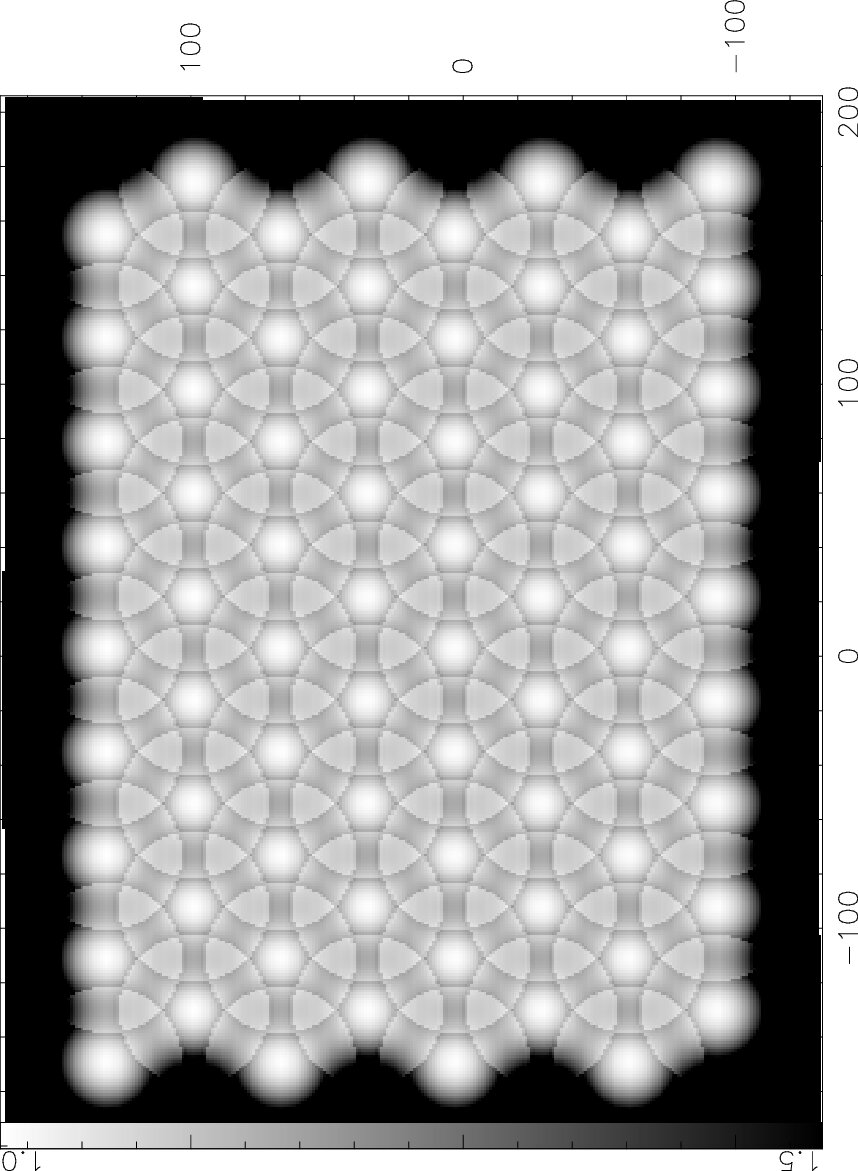 Figure 18
| Field | RA () to RA () | Dec () to Dec () | ||
|---|---|---|---|---|
| 0020+2947 | 00 06 48.2 00 33 04.6 | +26 37 55 +32 55 20 | ||
| 0303+2629 | 02 49 36.5 03 16 03.3 | +24 26 19 +28 32 04 | ||
| 0731+5427 | 07 22 05.0 07 40 01.2 | +53 09 29 +55 44 20 | ||
| 0938+3218 | 09 29 38.0 09 46 08.0 | +30 43 45 +33 51 55 | ||
| 1228+5301 | 12 17 08.5 12 38 43.9 | +51 27 16 +54 33 45 | ||
| 1535+4305 | 15 22 16.7 15 47 10.1 | +40 43 16 +45 25 52 | ||
| 1735+4215 | 17 29 40.3 17 43 57.2 | +41 13 24 +43 17 30 |
| Field | RA () to RA () | Dec () to Dec () | ||
| 0020+2947 | 00 11 55.7 00 20 08.0 | +27 09 39.0 +29 16 04 | ||
| 00 20 08.0 00 22 45.5 | +28 43 43.0 +29 16 04 | |||
| 00 25 00.8 00 30 54.6 | +31 53 24.0 +32 24 07 | |||
| 0303+2629 | 02 55 27.2 02 58 26.5 | +24 56 03.0 +25 27 56 | ||
| 02 58 26.5 03 01 23.7 | +25 27 56.0 +25 58 27 | |||
| 02 58 21.7 03 04 22.8 | +26 29 55.0 +26 59 31 | |||
| 0731+5427 | 07 22 05.0 07 31 04.6 | +53 09 29.0 +53 40 27 | ||
| 07 26 33.2 07 40 01.2 | +53 40 27.0 +55 13 28 | |||
| 07 22 05.0 07 31 17.7 | +55 13 28.0 +55 44 20 | |||
| 0938+3218 | 09 29 38.0 09 40 46.9 | +30 43 45.0 +32 49 53 | ||
| 09 43 01.8 09 46 08.0 | +31 14 44.0 +31 46 05 | |||
| 09 40 46.9 09 43 35.0 | +32 17 15.0 +32 49 55 | |||
| 09 32 08.6 09 35 23.3 | +32 49 53.0 +33 21 31 | |||
| 09 37 38.7 09 40 46.9 | +32 49 53.0 +33 21 16 | |||
| 1228+5301 | 12 21 19.2 12 25 44.9 | +51 58 14.0 +52 30 36 | ||
| 12 25 44.9 12 30 01.0 | +51 58 14.0 +54 02 56 | |||
| 12 34 22.2 12 38 48.0 | +51 58 21.0 +52 30 43 | |||
| 12 20 54.5 12 25 44.9 | +53 31 51.0 +54 02 56 | |||
| 1535+4305 | 15 34 28.4 15 44 07.5 | +40 43 16.0 +42 49 11 | ||
| 15 44 07.5 15 47 10.1 | +42 18 13.0 +42 49 11 | |||
| 15 22 16.7 15 28 44.7 | +42 48 44.0 +43 19 48 | |||
| 15 22 16.7 15 25 32.3 | +43 19 48.0 +43 51 07 | |||
| 15 40 59.3 15 44 46.9 | +44 23 59.0 +44 55 40 | |||
| 15 24 45.0 15 31 50.2 | +44 54 51.0 +45 25 52 | |||
| 1735+4215 | 17 29 40.3 17 43 57.2 | +41 13 24.0 +42 15 51 | ||
| 17 29 40.3 17 33 16.0 | +42 15 51.0 +42 46 40 | |||
| 17 36 50.1 17 43 57.2 | +42 15 51.0 +42 46 40 |
| bin start | bin end | number | area | |||
|---|---|---|---|---|---|---|
| /Jy | /Jy | sr | ||||
| 0.0055 | 0.0063 | 23 | 0.008856 | |||
| 0.0063 | 0.0078 | 21 | 0.008856 | |||
| 0.0078 | 0.0100 | 21 | 0.008856 | |||
| 0.0100 | 0.0110 | 38 | 0.034939 | |||
| 0.0110 | 0.0129 | 43 | 0.034939 | |||
| 0.0129 | 0.0152 | 40 | 0.034939 | |||
| 0.0152 | 0.0198 | 40 | 0.034939 | |||
| 0.0198 | 0.0250 | 39 | 0.034939 | |||
| 0.025 | 0.030 | 80 | 0.15841 | |||
| 0.030 | 0.040 | 104 | 0.15841 | |||
| 0.040 | 0.060 | 103 | 0.15841 | |||
| 0.060 | 0.100 | 94 | 0.15841 | |||
| 0.100 | 0.200 | 49 | 0.15841 | |||
| 0.200 | 0.500 | 27 | 0.15841 | |||
| 0.500 | 1.000 | 8 | 0.15841 |
| 15.2-GHz flux | Number | Number of | Number of | |
| density | of | sources | sources | |
| range (mJy) | sources | with | with | |
| 111 | 11 (10 %) | 40 (36 %) | 0.79 | |
| 381 | 62 (16 %) | 190 (50 %) | 0.51 | |
| 84 | 26 (31 %) | 60 (71 %) | 0.23 |
| 15-GHz flux | Number | Min. | Max. | Mean | Number of | Probability of |
| density | of | realisations | drawing median | |||
| range (mJy) | simulated | with | more extreme | |||
| sources | than observed | |||||
| 111 | 0.166 | 0.817 | 0.477 | is 14 | ||
| 381 | 0.311 | 0.685 | 0.474 | is 212833 | 0.426 | |
| 84 | 0.081 | 0.879 | 0.478 | is 161 |
| Flux density | Number of | 9C Area | Select | Number of |
|---|---|---|---|---|
| cut at | NVSS | sources | sources | |
| 1.4 GHz (mJy) | sources | with | selected | |
| 32.95 | 644 | 110 deg2 complete to 10 mJy | 63 (9.8 %) | |
| 10.0 | 1891 | 110 deg2 complete to 10 mJy | 20 (1.1 %) | |
| 18.12 | 295 | 29 deg2 complete to 5.5 mJy | 27 (9.2 %) | |
| 5.5 | 770 | 29 deg2 complete to 5.5 mJy | 11 (1.4 %) |
| RA (J2000) | Dec. (J2000) | 15.2-GHz | 1.4-GHz | |
|---|---|---|---|---|
| flux | flux | |||
| density | density | |||
| (mJy) | (mJy) | |||
| 17:40:17.1 | +42:14:31 | 14.0 | -0.59 | |
| 02:53:29.4 | +27:57:45 | 13.0 | -0.56 | |
| 00:27:28.0 | +28:08:10 | 10.9 | -0.49 | |
| 00:14:19.0 | +31:33:45 | 10.2 | -0.46 | |
| 15:37:42.1 | +43:49:12 | 10.2 | 0.87 | -1.03 |
| 12:35:22.9 | +53:11:29 | 6.2 | -0.25 | |
| 00:11:51.7 | +27:57:19 | 6.0 | -0.24 | |
| 09:44:27.2 | +33:03:22 | 6.0 | -0.24 | |
| 09:37:22.6 | +32:01:04 | 5.3 | -0.19 | |
| 09:34:35.9 | +30:44:05 | 5.0 | -0.16 | |
| 09:30:36.0 | +30:48:54 | 4.5 | -0.12 | |
| 17:33:11.1 | +41:21:05 | 4.5 | -0.12 | |
| 00:27:10.3 | +26:55:42 | 4.4 | -0.11 | |
| 15:32:04.6 | +42:51:52 | 4.1 | 2.56 | -0.20 |
| 03:14:20.8 | +26:26:27 | 4.0 | -0.07 | |
| 15:38:47.8 | +43:51:18 | 3.5 | -0.01 | |
| 17:42:52.2 | +43:09:51 | 3.2 | 0.03 | |
| 00:15:58.0 | +27:18:54 | 3.1 | 0.04 | |
| 00:31:12.7 | +27:12:58 | 3.0 | 0.05 | |
| 07:27:18.0 | +55:10:45 | 3.0 | 0.05 | |
| 15:40:52.8 | +44:16:22 | 2.6 | 0.11 |
| Flux | Number | Number of |
|---|---|---|
| density | of 9C | sources with no |
| range (mJy) | sources | NVSS counterpart |
| 62 | 8 (12.9 %) | |
| 281 | 8 (2.8 %) | |
| 117 | 5 (4.3 %) |
| Source name | RA J2000 | Dec. J2000 | Flux density | Date | Comment | |||
|---|---|---|---|---|---|---|---|---|
| (Jy) | yymmdd | |||||||
| 9CJ0015+3123 | 00:15:47.5 | 31:23:35 | 0.0127 | 020505 | e | |||
| 9CJ0015+2718 | D | 00:15:58.0 | 27:18:54 | 0.0031 | 031124 | |||
| 9CJ0016+2804 | D | 00:16:02.4 | 28:04:28 | 0.0027 | 031124 | |||
| 9CJ0016+3158 | 00:16:07.4 | 31:58:53 | 0.0092 | 041016 | ||||
| 9CJ0016+3239 | 00:16:11.0 | 32:39:26 | 0.0230 | 041228 | ||||
| 9CJ0016+2945 | 00:16:13.0 | 29:45:11 | 0.0156 | 010815 | ||||
| 9CJ0016+3238 | 00:16:13.6 | 32:38:37 | 0.0264 | 041228 | ||||
| 9CJ0016+3139 | 00:16:40.6 | 31:39:04 | 0.0110 | 030203 | b | |||
| 9CJ0017+3209 | 00:17:02.2 | 32:09:19 | 0.0345 | 041016 | ||||
| 9CJ0017+2733 | D | 00:17:04.6 | 27:33:43 | 0.0062 | 031124 |
Peer Reviews
No public reviews on file for this paper yet. If you reviewed it on a platform where reviews are public (OpenReview, ICLR, NeurIPS, ICML), you can paste yours below so the community can read it here.
Videos
No videos yet. Explain this paper in a talk, walkthrough, or lecture? Add one.
9C continued: results from a deeper radio-source survey at 15 GHz
E. M. Waldram,1 G. G. Pooley,1 M. L. Davies,1 K. J. B. Grainge1,2 and P. F. Scott1
1Astrophysics Group, Cavendish Laboratory, J J Thomson Avenue, Cambridge, CB3 0HE
2Kavli Institute for Cosmology Cambridge, Madingley Road, Cambridge, CB3 0HA Email: [email protected]
(Accepted ????. Received ????.)
Abstract
The 9C survey of radio sources with the Ryle telescope at 15.2 GHz was set up to survey the fields of the cosmic microwave background telescope, the Very Small Array. In our first paper we described three regions of the survey, constituting a total area of 520 deg2 to a completeness limit of mJy. Here we report on a series of deeper regions, amounting to an area of 115 deg2 complete to mJy and of 29 deg2 complete to mJy. We have investigated the source counts and the distributions of the 1.4 to 15.2 GHz spectral index () for these deeper samples. The whole catalogue of 643 sources is available online.
Down to our lower limit of 5.5 mJy we detect no evidence for any change in the differential source count from the earlier fitted count above 25 mJy, .
We have matched both our new and earlier catalogues with the NRAO VLA Sky Survey (NVSS) catalogue at 1.4 GHz. For samples of sources selected at 15.2 GHz, in three flux density ranges, we detect a significant shift in the median value of ; samples with higher flux densities have higher proportions of sources with flat and rising spectra. We suggest that this observed shift is consistent with a model containing two distinct source populations having differently sloped source counts. Samples selected at 1.4 GHz contain significantly smaller proportions of sources with flat and rising spectra. Also, in our area complete to mJy, we find 5 sources between 10 to 15 mJy, amounting to 4.3 per cent of sources in this range, with no counterpart in the NVSS catalogue. These results illustrate the problems inherent in using a low frequency catalogue to characterise the source population at a much higher frequency and emphasise the value of our blind 15.2-GHz survey.
keywords:
surveys – cosmic microwave background – radio continuum: general – galaxies:evolution
††pagerange: 9C continued: results from a deeper radio-source survey at 15 GHz–9††pubyear: 2009
1 Introduction
As explained in our first paper (Waldram et al. 2003), hereafter Paper I, the 9C survey with the Ryle Telescope (RT) at 15.2 GHz was designed specifically as part of the observing strategy of the Very Small Array (VSA) (Watson et al. 2003). Foreground radio sources are a major contaminant in the cosmic microwave background (CMB) observations of the VSA at 34 GHz and the prime purpose of the 9C survey has been to provide a catalogue of radio sources in each of the VSA fields (Taylor et al. 2003; Cleary et al. 2005, 2008). This has meant that the positions of the 9C fields and their depth in different areas have been determined by the VSA observing programme. For the VSA compact array ( 150 to 800) we covered a total area of 520 deg2 to a completeness limit of 25 mJy but for the extended array ( 300 to 1500) and now the super-extended array ( 600 to 2500) deeper surveying over some smaller regions has been required. It is these regions which are described here.
In addition to its specific application to the VSA observations, the 9C survey has proved to be of much wider interest. There have been other blind surveys at high radio frequencies, notably with the Australia Telescope Compact Array (ATCA) at 18 and 20 GHz (Ricci et al. 2004; Sadler et al 2006; Massardi et al. 2008), but 9C was the first such survey of any extent and is the only one to reach such low flux densities. It provides an important opportunity for exploring the radio-source population at high frequencies. Samples of 9C sources have been followed up with simultaneous multifrequency observations at 1.4, 4.8, 15.2, 22 and 43 GHz (Bolton et al. 2004) and there have been two further papers based on these data: Bolton et al. 2006a, which describes results from 5-GHz MERLIN and VLBA observations, and Bolton et al. 2006b, which examines variability at 15.2 GHz.
As a blind survey at 15.2 GHz, 9C is particularly valuable in the study of source counts at high radio frequencies. Point sources are a significant foreground in the CMB observations of many instruments (e.g. the Planck Surveyor) and, even if the brighter sources can be identified and subtracted from the data, there remains the problem of residual confusion from the fainter, unsubtracted source-population. This effect can be evaluated only from a knowledge of the source counts below the subtraction limit. Blind surveys at frequencies of 30 GHz and above are extremely problematical because of the small field of view of the available telescopes, so one approach has been to identify sources from a lower frequency survey, with a measured source count, and follow them up at the higher frequency. 9C, at 15.2 GHz, is comparatively close to the target frequencies and, therefore, has a considerable advantage over lower-frequency surveys.
We have used this method to make empirical estimates of the source counts at higher frequencies (including those in the lower Planck bands) by taking the spectral index distributions from the Bolton data together with our known 15.2-GHz source count (Waldram et al. 2007). Comparison with the theoretical model of de Zotti et al. (2005) shows good agreement below 43 GHz but at higher frequencies there is some divergence towards higher flux densities, indicating that our predictions imply fewer flat spectrum sources. However, the results of Sadler et al. (2008) who have made simultaneous observations with ATCA of a sample of sources at 20 and 95 GHz, do appear to confirm our own estimates of the count at 90 GHz in the common flux-density range.
More recently, Mason et al. (2009) have made a 31-GHz survey of the fields of the Cosmic Background Imager (CBI, Mason et al. 2003) by following up known extragalactic sources from the NVSS survey at 1.4 GHz (Condon et al. 1998). They have estimated the spectral index distribution from 1.4 to 31 GHz and hence the 31-GHz source count in the range 0.5 to 10 mJy, which has enabled them to make an assessment of the contribution of unresolved point sources to the CBI power spectrum. Our results here provide a useful comparison with their work.
Also, a subset of the sources in our present catalogue has now been followed up at 30 GHz with observations made using the 32-m, Toruń telescope (Gawroński et al., in preparation).
In this paper, we first explain the choice of fields and our methods of observation and data analysis, together with estimates of completeness (Sections 2, 3 and 4). In Section 5 we present the extended source counts and in Section 6 investigate the correlation of our source lists with the NVSS survey. Section 7 describes the source catalogue. Section 8 discusses our conclusions and Section 9 our plans for future work.
2 The survey areas
The seven areas of the survey presented here are centred at: 0020+2947, 0303+2629, 0731+5427, 0938+3218, 1228+5301, 1535+4305, 1735+4215 (RA () Dec. (), J2000.0), as indicated in Figure 1. They are situated away from the Galactic plane and are widely spaced in RA, their positions having been determined by the choice of fields for the observations of the VSA. The RA and Dec. ranges are given in Table 1. The total area amounts to 114.7 deg2 and within this our source list is complete to mJy. In each field there are also some much more sensitive areas; this was partly because deeper surveying was required near the centre of the VSA primary beam and partly because on some days there were particularly favourable observing conditions. For the purpose of this paper, in order assemble a complete sample of a useful size, we have selected a number of sub-areas with mJy completeness, which form a total area of 29.1 deg2 (Figure 2). These are of various shapes and sizes, so in Table 2 we have described them in terms of small constituent areas bounded by specific RA and Dec. ranges. Although our completeness limit in these regions is mJy, we have detected many fainter sources, the faintest being only 1 mJy.
3 Observations and data analysis
For our observations we have continued to use a rastering technique similar to that described in Paper I. This is necessitated by the relatively small area within the FWHM of the RT primary beam (0.01 deg2) compared with the areas of the VSA fields to be surveyed. As before, we used the RT’s E–W array of five aerials to give a resolution of and set up a hexagonal pattern of pointing directions with a spacing of 5 arcmin. But, in order to reach the required sensitivity, we now scanned only 72 pointings during a 12h observation, covering an area of sky of only 0.3 deg2. We also needed to integrate several observations of the same area, sometimes as many as six for the deeper regions, if the weather were unfavourable. Separate so-called ‘constituent’ maps were made from the accumulated data from the individual pointings and, in an improvement on our earlier method, these were then CLEANed before assembling them to form the ‘raster’ map. The method for combining the constituent maps was the same as before and produced a similar variation in sensitivity (of 20 %) over the corresponding raster map, as illustrated in Figure 3. We made an estimate of the mean noise, , over each raster map and continued to integrate data until we had reached the required sensitivity. Over all the areas we reached mJy and in the deeper areas mJy, though there was considerable variation within these.
The source extraction was also implemented much as before. Possible sources were identified as peaks from interpolation of the raster map and then each of these was followed up with a short pointed observation of 10–15 minutes, either to establish a reliable flux density or to eliminate it as a false detection. The only change in our method was that, while we continued to take as the pixel cut-off on the raster map, we now took , rather than , as the cut-off for the interpolated peak, in order to find as many of the weaker sources as possible.
4 Completeness
Since the original candidate sources were found from raster maps with a range of noise levels, assessment of the completeness limits of our source lists is not straightforward. Although we can be sure that every source in our catalogue is genuine, since it has been followed up with a pointed observation, it is difficult to estimate the number of undetected sources at any flux density level. We have approached the problem in the following way.
Taking the deeper areas first, we have plotted the ratio, , of the raster flux density to the pointed flux density versus , as in Figure 4. We find that, for the brighter sources, in the range mJy where we can assume completeness, there is a scatter about a median ratio of . This off-set of per cent in the median value is probably attributable to pointing problems; in particular, there was a necessary compromise between keeping as many of the observed data samples as possible and discarding those with excessive pointing errors. For the weaker sources the ratio rises progressively with decreasing flux density because at these levels the peaks detected on the raster maps are preferentially those boosted by a positive local noise contribution. In order to estimate the completeness limit, we have investigated the change in the relative numbers of sources above and below the median line as the pointed flux density decreases from 10 mJy. We find that there is no significant difference in the numbers down to 5.5 mJy but below this level there are significantly more sources with ratios above 0.89 than below. We therefore assume we have completeness to approximately 5.5 mJy, which means there are 135 sources above the limit and 81 below.
For the total areas, we apply similar arguments using higher flux densities and conclude we have a completeness limit of approximately 10 mJy, giving us 307 sources above the limit and 336 below.
We should also explain that within the areas presented in this paper there is a shortfall in the number of sources above 100 mJy as compared with the number expected from the source count in Paper I (see next section). This is because these VSA fields were deliberately selected to contain as few bright sources as possible.
5 Source counts
The source count for the sources in the total areas is shown in Figure 5 which indicates the lower completeness limit of 10 mJy and also the shortfall above 100 mJy mentioned in the previous section. Figure 6 is a similar plot for the sub-set of these sources which lie in the deeper areas.
Using these counts, we are now able to extend the original 9C count to a lower flux density level. We have combined data from Paper I in the range mJy with data from this paper in the range mJy from the total areas and mJy from the deeper areas (see Table 3). As explained in the earlier paper, the effect of the random errors in the flux densities is negligible compared with the Poisson errors on , but we have applied a correction for the bin widths in the same way as before. At the completeness limit of 5.5 mJy the survey continues to be limited by noise rather than confusion; we estimate that above this level there are typically 2000 synthesized beam areas per source.
Figure 7 shows the differential count and we see that, down to 5.5 mJy, there is no evidence for any significant change from the fitted count calculated in Paper I: i.e.
[TABLE]
In Figure 8 we compare our normalized count with that derived from the model of de Zotti et al. (2005) and note that our count appears to lie somewhat below their prediction in the lower flux density range.
These two figures effectively update the plots in Figures 6 and 7 of Paper I. We should mention here that we found retrospectively that the positions of two points in each of those figures are in error. These are the two open circles corresponding to the higher flux bins of the deeper survey. In fact, since they lie in the flux density range of the main survey, they do not affect any of the arguments or conclusions in that paper and can simply be ignored.
6 Correlation with NVSS at 1.4 GHz
In this section we present the results of our investigations but defer any discussion of their implications to Section 8.
6.1 Matching the catalogues
We have attempted to match the 643 sources in our catalogue with the catalogue from the NVSS 1.4-GHz survey, which has a resolution of 45 arcsec (not dissimilar to our own) and a completeness of 50 percent at mJy rising rapidly to 99 percent at 3.4 mJy. In the first instance, we searched for a counterpart within 40 arcsec of each of the 9C sources and then in every case inspected the corresponding NVSS contour plot, paying particular attention to sources which had multiple matches within 40 arcsec and to those where there was no match within 20 arcsec. For about 90 percent of the sources the matching was straightforward; the remainder, however, required further attention in order to make the appropriate correlation of flux densities. For example, some binary sources had a single entry in the 9C catalogue, but appeared separately in the NVSS catalogue and, conversely, there were some single NVSS sources which appeared as separate components in 9C. Where possible, we made use of the deeper FIRST 1.4-GHz survey (Becker, White & Helfand 1995), with its resolution of 5 arcsec, to assist in resolving ambiguities.
Our correlation is illustrated in Figure 9. In all, out of the 643 sources in our list, there were 21 with no counterpart in the NVSS catalogue, though two of these did appear in FIRST. Also, a number of them were found to be coincident with one or two contours on the NVSS plots but clearly these were not significant enough detections to justify their inclusion as sources in the NVSS catalogue. (See sub-section 6.3 for further details.)
6.2 Spectral index distributions: samples selected at 15.2 GHz
A histogram of the spectral index distribution for the 111 sources with mJy and lying in our deep areas is shown in Figure 10. We define by . The figure also shows the spectral index distributions, over the same range of frequencies, for sources with mJy and mJy; these distributions contain 381 and 84 sources, respectively, and were originally included in Paper I. They are derived from an area of 520 deg2 complete to mJy. In Table 4 we have summarised some important features of the distributions; it is clear from this table and Figure 10 that, as one moves to lower flux densities, the proportion of sources with flat and rising spectra decreases.
In order to assess the significance of the shift in median spectral index with flux density, we have combined the spectral indices of the 576 sources to form a single spectral index distribution, which we have plotted as a histogram in Figure 11. We assume that there is an underlying spectral index distribution which has no dependence on flux density and that the combined data represent our best approximation to this distribution. For each of our flux density bins, we calculate the probability of drawing the observed number of sources from the combined distribution and finding a median spectral index as extreme as those observed, using a Monte Carlo simulation of realisations. For example, for the lowest flux density bin, for each realisation, we draw, at random, 111 values from the combined spectral index distribution and find the median spectral index. We find 14 realisations, out of , in which the this value is greater than or equal to the observed value of 0.79 and conclude that the probability of drawing 111 sources from the combined distribution and observing a median as or more extreme than 0.79 is .
Table 5 provides a summary of the results from the simulations. It shows that the median spectral index observed for the middle flux density bin is not significantly different from that of the combined distribution of Figure 11. However, the probabilities of having obtained median spectral indices more extreme than observed, for the two outer flux density bins, by drawing sources randomly from the combined distribution are very small. Consequently, we can reject our null hypothesis, that the underlying spectral index distribution has no dependence on flux density, with a high level of confidence. In other words, the shift in the median spectral index with flux density is significant.
6.3 Spectral index distributions: samples selected from NVSS at 1.4 GHz
It is not possible to calculate a full spectral index distribution for a sample of NVSS sources complete to a level of 3.4 mJy, since many of the steep spectrum sources will not be detectable in our survey. We can, however, investigate the proportion of flat and rising spectrum sources in the NVSS catalogue for different cut-offs in 1.4 GHz flux density, where we use ‘flat and rising’ to refer to sources with .
We have selected all sources from the NVSS catalogue, lying in the areas complete to 10 mJy at 15.2 GHz, with mJy; in total, 644 sources are selected. These selection criteria ensure that any sources with will have mJy, our completeness limit at 15.2 GHz. Of the 644 sources selected, 63 are found to have . In other words, we find that 9.8 per cent of sources with mJy have . We have plotted this flat and rising part of the spectral index distribution at 1.4 GHz as a histogram in Figure 12. We have also taken a lower flux density cut at 1.4 GHz of 10 mJy (again in our total areas), which enables us to investigate sources with for a somewhat deeper sample.
Similarly, we have taken appropriate NVSS flux density cuts in the deeper areas, complete to 5.5 mJy at 15.2 GHz, to enable us to investigate the rising, and flat and rising side of the distribution at lower flux densities. Our results are summarised in Table 6.
6.4 Sources not in NVSS
Table 7 lists the 21 sources in our total source list which do not appear in the NVSS catalogue. Only one of these lies in the deeper areas (see the dotted box in the top plot of Figure 10) and the others are all in the total areas. By dividing these 21 sources into three flux-density bins, as shown in Table 8, we can gain an indication of the proportion of 9C sources, with no counterparts in NVSS, as a function of flux density. We are complete only in the highest bin ( mJy), for which we find 4.3 per cent of sources with no NVSS counterpart. Assuming that the proportion of sources with no counterpart increases with decreasing flux density, our estimates of the proportions of ‘missing’ sources are likely to be under-estimates for the two lower flux density bins. This is because these bins are incomplete; sources with higher fluxes are preferentially detected in these incomplete bins, yet it is the brighter sources that are more likely to have an NVSS counterpart.
We should note that several of the sources have been observed at other frequencies. For example, a number are close to sources in the 2MASS (Skrutskie et al. 2006) and ROSAT all-sky survey (Voges et al. 1999) catalogues. However, here we are concerned with the number of sources at 15 GHz that would be missed by reliance on the NVSS catalogue.
7 The source catalogue
The reference list from the paper itself. Each links out to its DOI / PubMed record.
- 1[1] Becker R.H., White R.L., Helfand D.J., 1995, Ap J, 450, 559
- 2[2] Bock D.C.-J., Carpenter J.M., 2008, in Bridle A.H., Condon J.J., Hunt G.C., eds., ASP Conf. Ser. Vol. 395, Frontiers of Astrophysics: A Celebration of NRAO’s 50th Anniversary. Astron. Soc. Pac., San Francisco, p.362
- 3[3] Bolton R.C., Cotter G., Pooley G.G., Riley J.M., Waldram E.M., Chandler C.J., Mason B.S., Pearson T.J., Readhead A.C.S., 2004, MNRAS, 354, 485
- 4[4] Bolton R.C., Chandler C.J., Cotter G., Pearson T.J., Pooley G.G., Readhead A.C.S., Riley J.M., Waldram E.M., 2006 a, MNRAS, 367, 323
- 5[5] Bolton R.C., Chandler C.J., Cotter G., Pearson T.J., Pooley G.G., Readhead A.C.S., Riley J.M., Waldram E.M., 2006 b, MNRAS, 370, 1556
- 6[6] Cleary K.A., Taylor A.C., Waldram E. et al., 2005, MNRAS, 360, 340
- 7[7] Cleary K.A., Taylor A.C., Waldram E. et al., 2008, MNRAS, 386, 1759
- 8[8] Condon J.J., Cotton W.D., Greisen E.W., Yin Q.F., Perley R.A., Taylor G.B., Broderick J.J., 1998, AJ, 115, 1693