Observations towards early-type stars in the ESO-POP survey: II -- searches for intermediate and high velocity clouds
J. V. Smoker, I. Hunter, P. M. W. Kalberla, F. P. Keenan, R. Morras,, R. Hanuschik, H. M. A. Thompson, D. Silva, E. Bajaja, W. G. L. Poppel, M., Arnal

TL;DR
This study uses optical spectra and HI data to determine lower distance limits to various intermediate and high velocity clouds in the galaxy, improving understanding of their locations and origins.
Contribution
It provides new distance constraints for multiple velocity clouds using combined optical absorption and radio emission data, especially for the Magellanic System.
Findings
Lower distance limit of 2.7 kpc for Anti-Centre cloud ACII
Lower distance limit of 2.9 kpc for a high velocity cloud
Lower distance limit of 3.2 kpc for a high velocity cloud in the Magellanic System
Abstract
We present CaII K and TiII optical spectra of early-type stars taken mainly from the UVES Paranal Observatory Project, plus HI 21-cm spectra from the Vila-Elisa and Leiden-Dwingeloo surveys, which are employed to obtain distances to intermediate and high velocity clouds. HI emission at a velocity of -117 km/s towards the sightline HD 30677 with NHI=1.7x10^19 cm-2 has no corresponding CaII K absorption, which has a signal-to-noise (S/N) ratio of 610. The star has a spectroscopically determined distance of 2.7-kpc, and hence sets this as a firm lower distance limit towards Anti-Centre cloud ACII. Towards another sightline (HD 46185), HI at +122 km/s and NHI=1.2x10^19 cm-2 is seen. The CaII K spectrum has a S/N = 780, although no absorption is observed at the cloud velocity. This similarly places a firm lower distance limit of 2.9-kpc towards this parcel of gas that may be an intermediate…
Click any figure to enlarge with its caption.
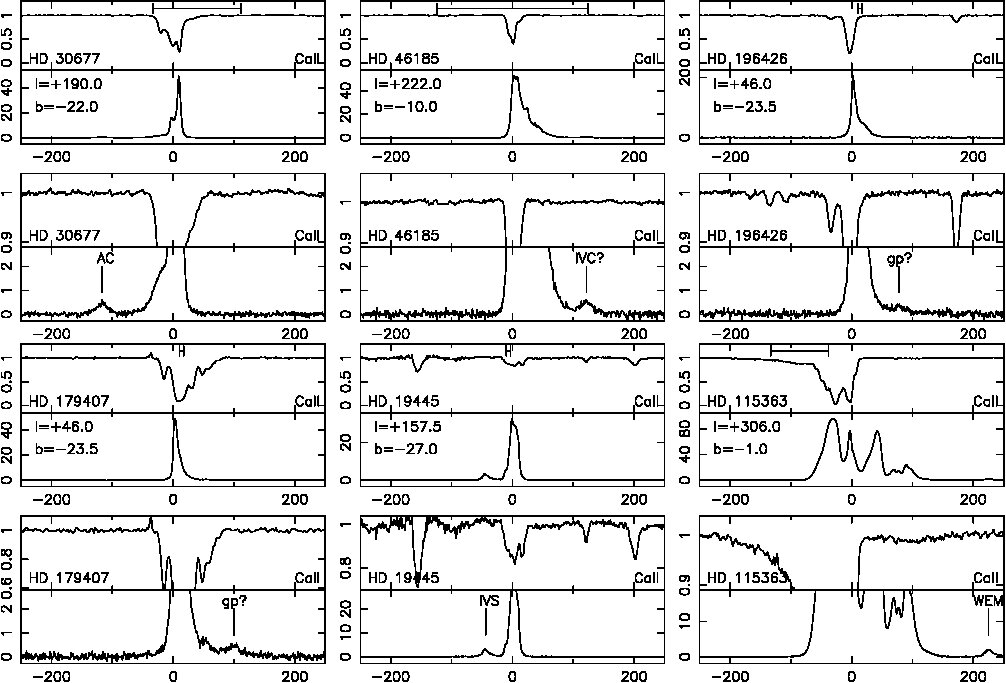 Figure 1
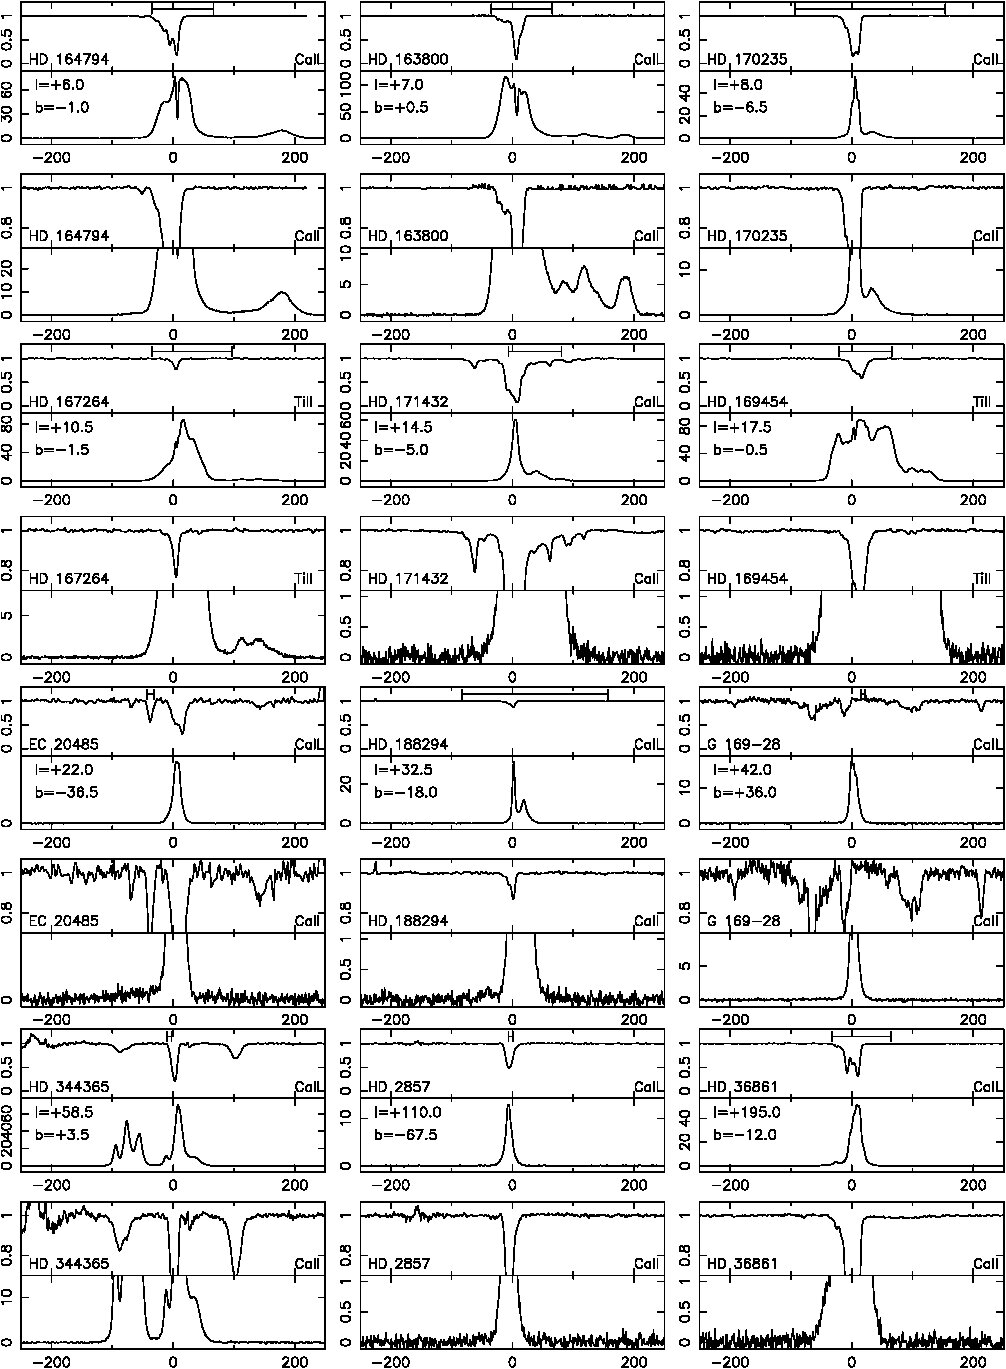 Figure 2
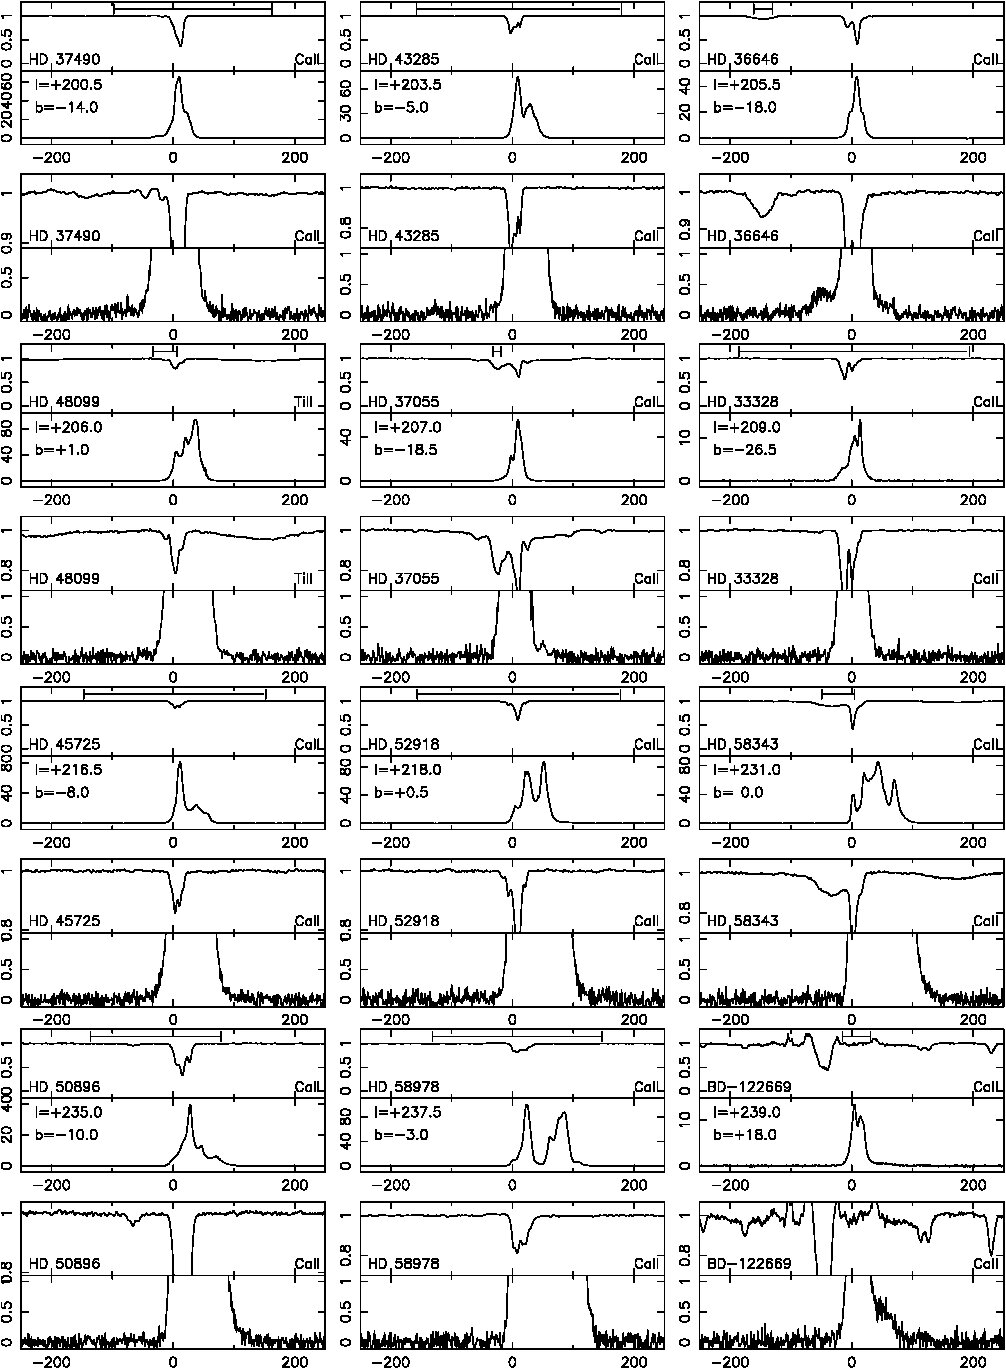 Figure 2
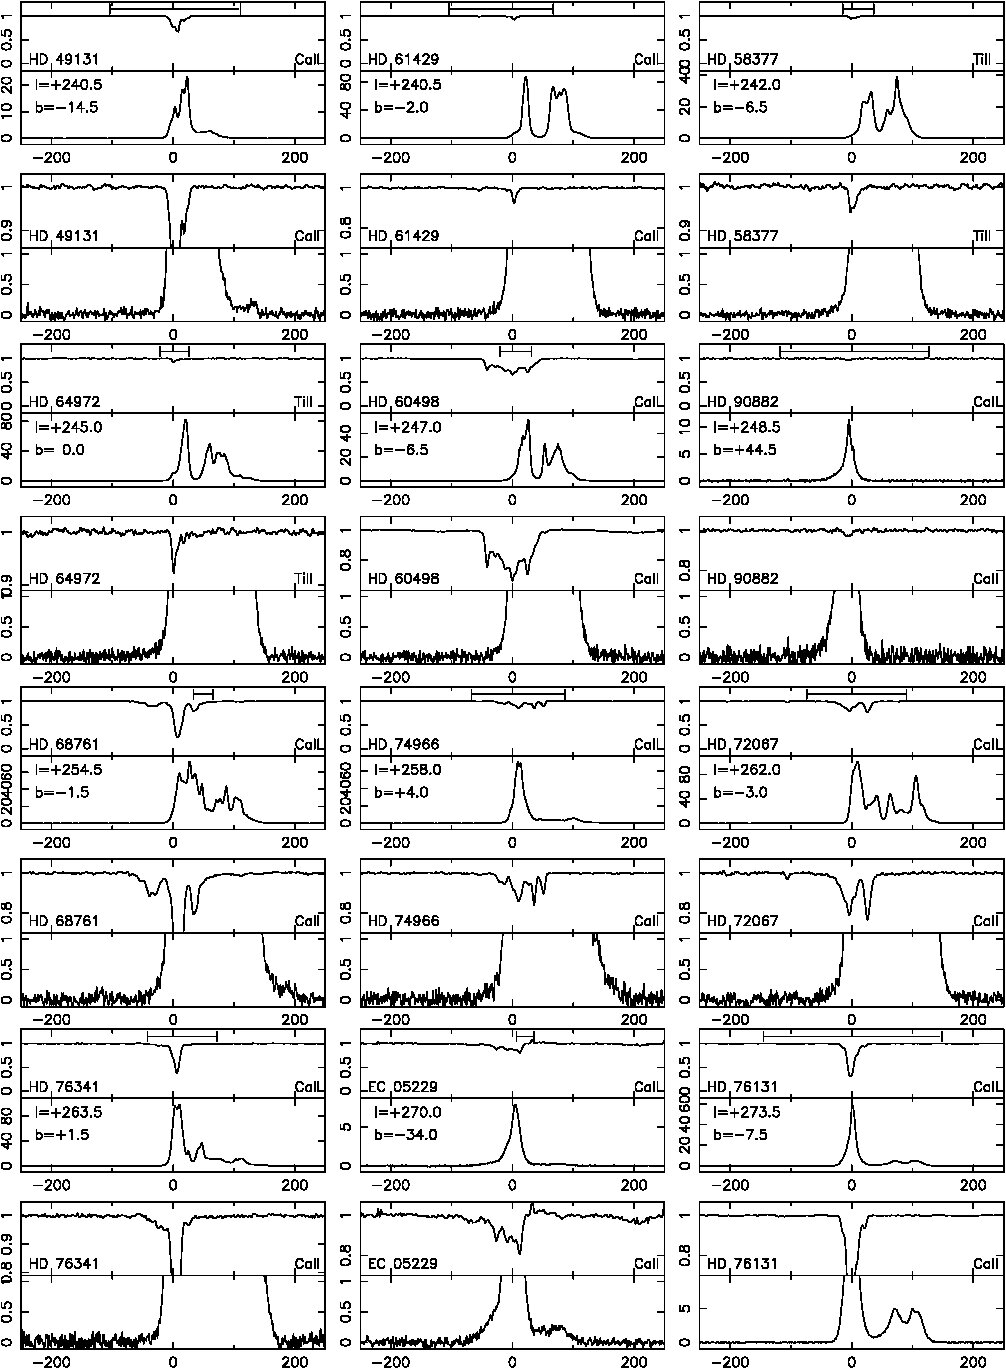 Figure 2
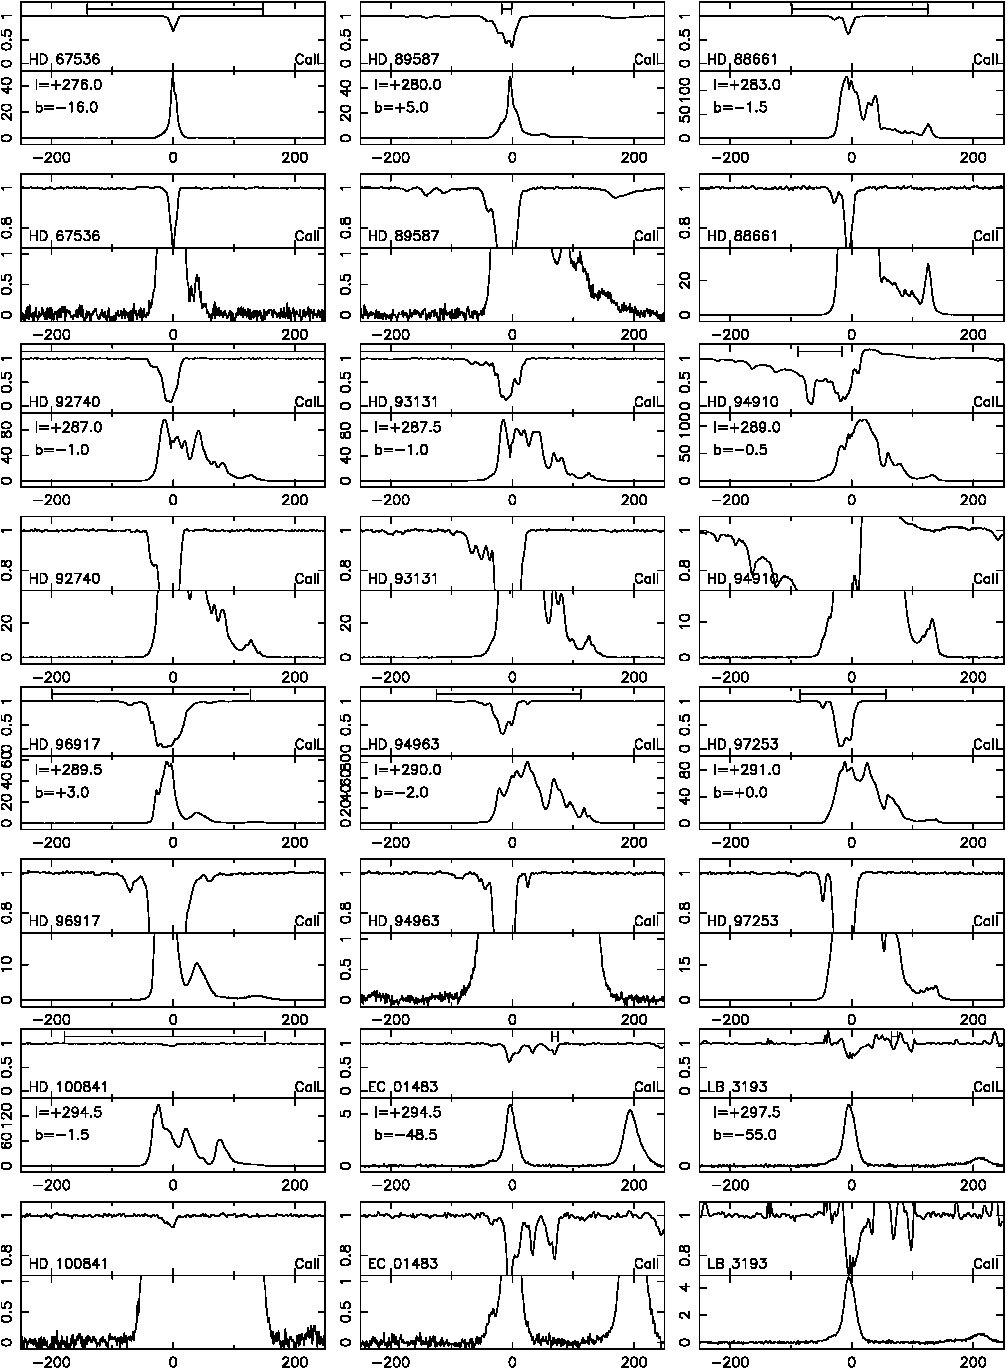 Figure 2
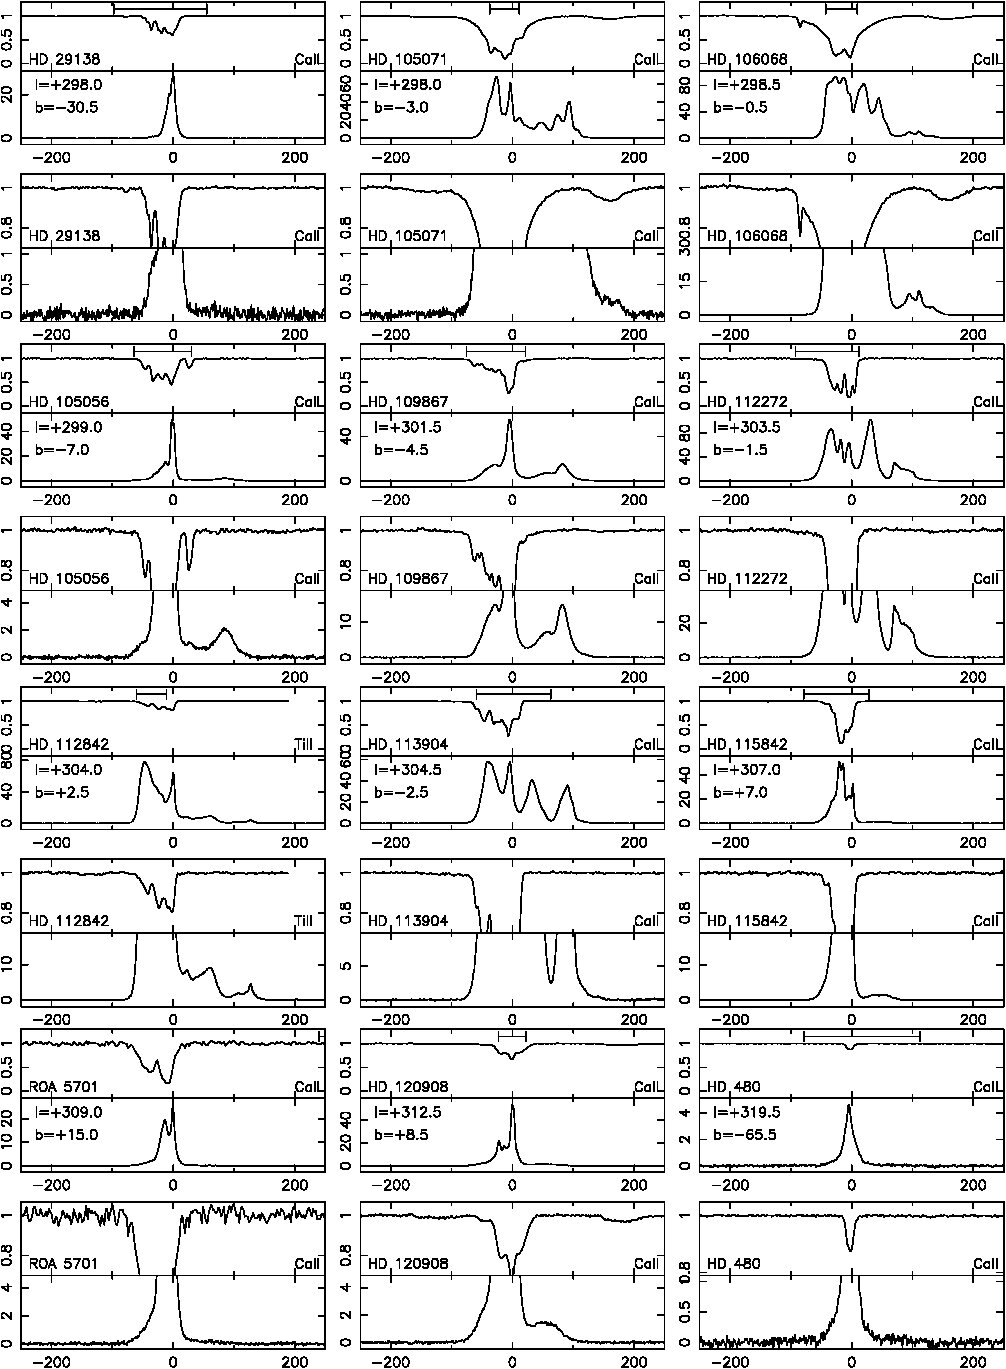 Figure 2
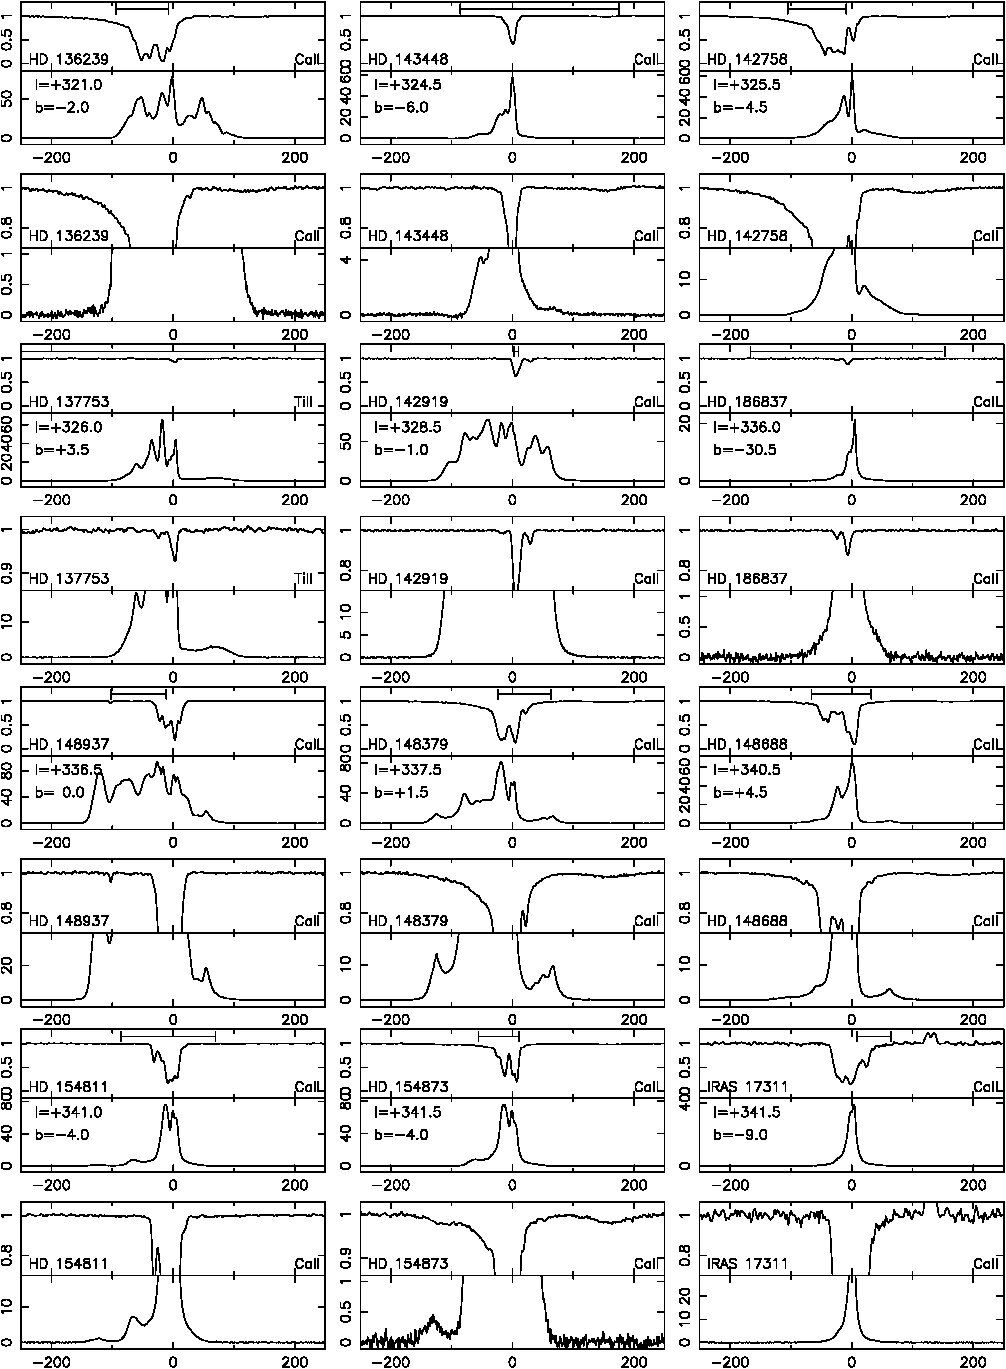 Figure 2
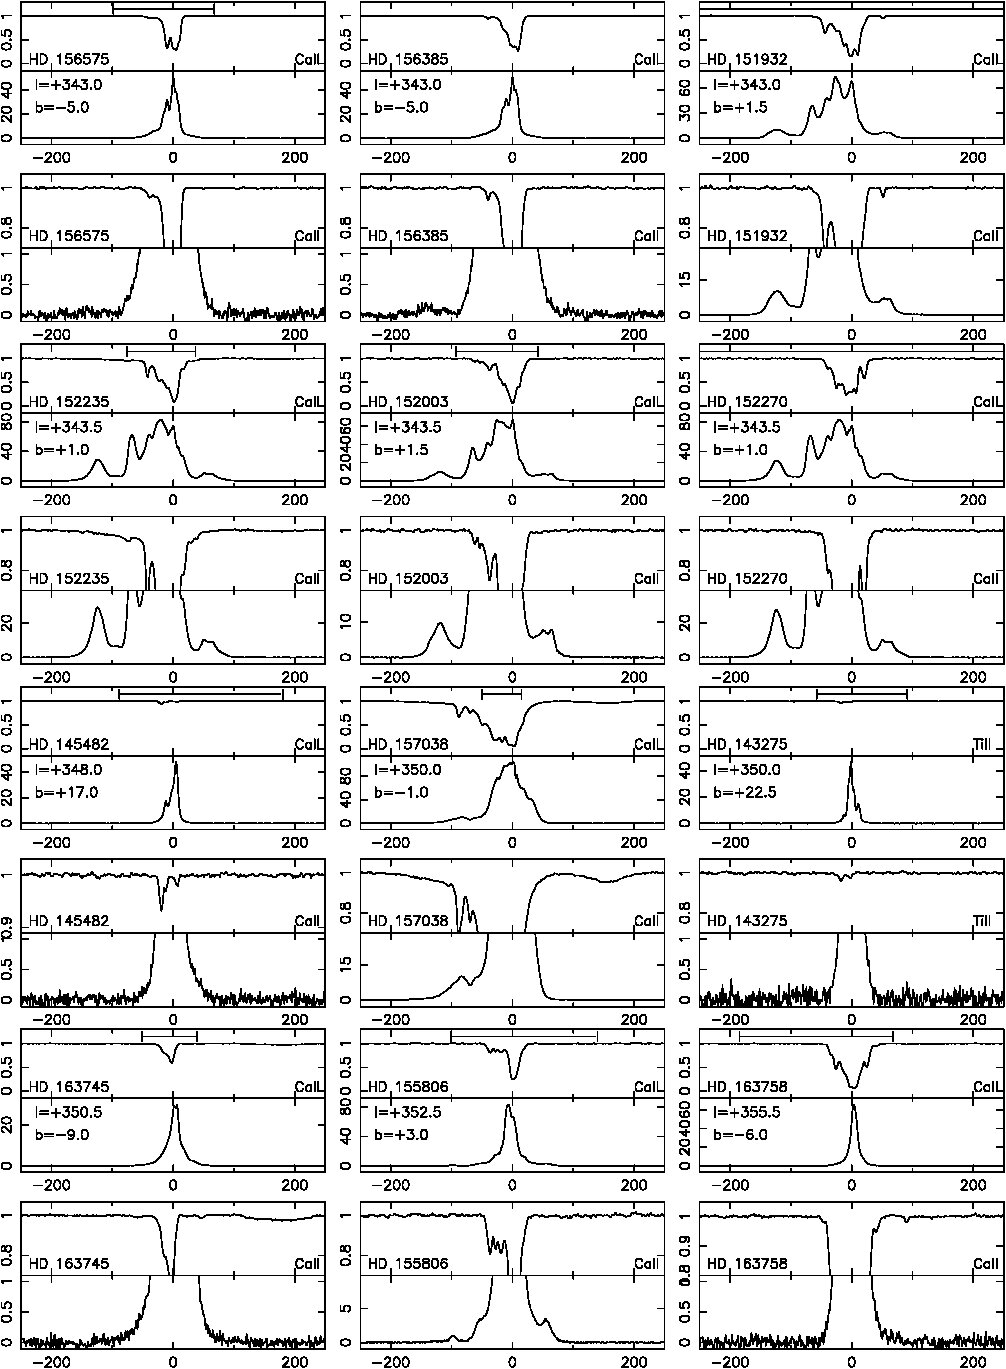 Figure 2
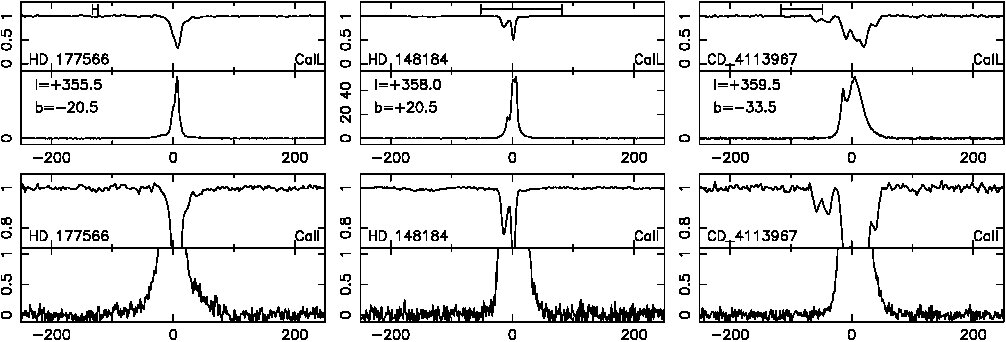 Figure 2
| Star | Alt. | S/N | IHVC | v | v | Source | |||||
|---|---|---|---|---|---|---|---|---|---|---|---|
| Name | (deg.) | (deg.) | (mag.) | (pc) | (pc) | pixel-1 | Opt./H i | ||||
| HD 171432 | BD-18 5008 | 14.62 | -4.98 | 7.11 | 4014 | -348 | 590 | – | 0.0 | 43.9 | POP/VE |
| EC 20485-2420 | 21.76 | -36.36 | 11.77 | 36005 | -1200 | 40 | gp | 0.0 | 28.9 | FER1/VE | |
| HD 179407 | BD-12 5308 | 24.02 | -10.40 | 9.44 | 76001 | -1400 | 120 | gp | 0.0 | 128.3 | FER1/VE |
| HD 188294 | 57 Aql B | 32.65 | -17.77 | 6.44 | 212 | -64 | 420 | gp | 0.0 | 2.3 | POP/VE |
| G169–28 | HIP 82398 | 41.83 | +36.06 | 11.26 | 1172 | 69 | 100 | K | 0.0 | 1.0 | S07/LD |
| HD 196426 | HR 7878 | 45.81 | -23.32 | 6.21 | 7003 | -280 | 360 | gp | 0.0 | 3.3 | S07/LD |
| HD 344365 | 58.63 | +3.41 | 10.8 | 103213 | 61 | 210 | – | 0.0 | 11.4 | S07/LD | |
| HD 2857 | 110.05 | -67.64 | 9.95 | 7177 | -663 | 270 | IVS | -0.9 | 0.0 | S07/LD | |
| HD 19445 | 157.48 | -27.20 | 8.05 | 3912 | -18 | 200 | IVS, ACC | -0.3 | 0.0 | S07/LD | |
| HD 30677 | BD+08 775 | 190.18 | -22.22 | 6.84 | 2707 | -1023 | 430 | ACII | 0.0 | 8.1 | POP/VE |
| HD 46185 | BD-12 1520 | 221.97 | -10.08 | 6.79 | 2937 | -514 | 550 | – | 0.0 | 31.1 | POP/VE |
| BD-12 2669 | 239.12 | +18.17 | 10.22 | 1588 | 49 | 250 | IV Spur | 0.0 | 1.6 | S07/LD | |
| HD 72067 | HR 3356 | 262.08 | -3.08 | 5.83 | 488 | -26 | 450 | – | 0.0 | 2.0 | POP/VE |
| EC 05229-6058 | 269.97 | -34.08 | 11.4 | 22005 | -2100 | 150 | – | 0.0 | 4.1 | FER1/VE | |
| HD 94910 | HIP 53461 | 289.18 | -0.69 | 7.09 | 60004 | -72 | 430 | – | -12.2 | 3.4 | POP/VE |
| EC 01483-6806 | 294.73 | -48.36 | 11.1 | 26005 | -2000 | 130 | – | -9.5 | 0.0 | FER1/VE | |
| LB 3193 | 297.32 | -54.90 | 12.70 | 80006 | 1800 | 100 | – | -14.4 | 0.0 | FER1/VE | |
| HD 115363 | HIP 64896 | 305.88 | -0.97 | 7.82 | 3282 | -55 | 290 | WE | -35.3 | 0.0 | POP/VE |
| ROA 5701 | 309.24 | +15.05 | 13.16 | 48007 | 1246 | 50 | – | -46.5 | 0.0 | FER2/VE | |
| HD 120908 | 312.25 | +8.37 | 5.88 | 338 | 49 | 370 | – | -4.3 | 0.0 | S07/VE | |
| HD 480 | 319.45 | -65.58 | 7.03 | 469 | 427 | 530 | – | -1.0 | 0.0 | S07/VE | |
| HD 142919 | 328.43 | -0.76 | 6.10 | 268 | -4 | 500 | WE | -3.2 | 0.0 | S07/VE | |
| HD 186837 | 335.85 | -30.57 | 6.20 | 329 | -167 | 620 | WE | -2.4 | 0.0 | S07/VE | |
| IRAS 17311 | 341.41 | -9.04 | 11.4 | 11008 | -174 | 55 | – | -9.5 | 0.0 | FER1/VE | |
| HD 163758 | SAO 209560 | 355.36 | -6.10 | 7.32 | 4103 | -436 | 550 | – | -16.1 | 0.0 | POP/VE |
| HD 163745 | 350.56 | -8.79 | 6.50 | 2189 | 335 | 620 | – | -11.9 | 0.0 | S07/VE | |
| BD+09 2860 | 353.04 | +63.21 | 11.27 | 53310 | 475 | 250 | – | -0.4 | 0.0 | S07/LD | |
| HD 177566 | 355.55 | -20.42 | 10.17 | 11009 | -383 | 120 | – | -190.2 | 0.0 | FER1/VE | |
| CD-41 13967 | 359.28 | -33.50 | 9.5 | 350011 | -1900 | 80 | – | -1.2 | 0.0 | FER1/VE |
| Star | IHVC | (H i) | log((H i)) | (Ca ii) | log((Ca ii)) | log((Ca ii)) | ||
|---|---|---|---|---|---|---|---|---|
| (pc) | (pc) | complex | km s-1 | (log(cm-2)) | (log(cm-2)) | (log(cm-2)) | (log(cm-2)) | |
| HD 196426 | 700 | 800-4300 | gp | +78 | 19.06 | -7.42 | 10.20 | 11.65 |
| HD 179407 | 7600 | ” | gp | +50 | 18.49 | -7.42 | 10.60 | 11.07 |
| ” | ” | ” | gp | +97 | 18.49 | -7.42 | 10.60 | 11.07 |
| HD 19445 | 39 | – | IVS | -45 | 19.49 | -7.88 | 10.46 | 11.61 |
| ” | ” | – | IVS | -40 | 19.71 | -7.88 | 10.46 | 11.82 |
| HD 30677 | 2700 | 400 | ACII | -117 | 19.24 | -8.39 | 9.82 | – |
| HD 115363 | 3200 | – | WEM | +224 | 19.71 | – | 9.99 | – |
| ” | ” | – | WEM | +240 | 19.30 | – | 9.99 | – |
| HD 46185 | 2900 | – | Other | +122 | 19.09 | – | 9.71 | – |
| IHVC | () | (H i) | Probes | |
|---|---|---|---|---|
| (deg.) | km s-1 | (pc) | ||
| gp | 46,–23 | +78 | HD 196426 | 800-43001,2 |
| IVS | 157,–27 | –45, –40 | HD 19445 | 391 |
| ACII | 190,–22 | –117 | HD 30677 | 27001 |
| WEM | 306,–1 | +224, +240 | HD 115363 | 32001 |
| Other | 222,–10 | +122 | HD 46185 | 29001 |
Peer Reviews
No public reviews on file for this paper yet. If you reviewed it on a platform where reviews are public (OpenReview, ICLR, NeurIPS, ICML), you can paste yours below so the community can read it here.
Videos
No videos yet. Explain this paper in a talk, walkthrough, or lecture? Add one.
Observations towards
early-type stars in the ESO-POP survey: II – searches for intermediate and high velocity clouds
J. V. Smoker1, I. Hunter1, P. M. W Kalberla2, F. P. Keenan1, R. Morras3, R. Hanuschik4, H. M. A. Thompson1, D. Silva5, E. Bajaja3, W. G. L Poppel3, M. Arnal3
1Astrophysics Research Centre, Department of Physics and Astronomy, Queen’s University Belfast,
Belfast, BT7 1NN, U.K.
2Argelander-Institut für Astronomie, Universität , Auf dem Hügel 71, 53121 Bonn, Germany
3Instituto Argentino de Radioastronomia, Casilla de correo 5, Villa Elisa, Argentina.
4European Southern Observatory, Karl-Schwarzschild-Str. 2, D-85748 Garching bei M nchen, Germany
5TMT Observatory Scientist, AURA/Thirty Meter Telescope, 2636 East Washington Blvd., Pasadena, CA 91107, U.S.A. email: [email protected].
Based on observations taken at UT2, Kueyen, Cerro Paranal, Chile, ESO DDT programme 266.D-5655(A), UVES Paranal Observatory Project, with additional observations from 071.B-0529(A), 072.B-0585(A), 073.B-0607(A), 074.B-0639(A), 076.D-0018(A) and 077.D-0025(A).Founded by merging of the Sternwarte, Radioastronomisches Institut, and Institut für Astrophysik und Extraterrestrische Forschung der Universität Bonn.
(Accepted Received in original form )
Abstract
We present Ca ii K and Ti ii optical spectra of early-type stars taken mainly from the UVES Paranal Observatory Project, plus H i 21-cm spectra from the Vila-Elisa and Leiden-Dwingeloo surveys, which are employed to obtain distances to intermediate and high velocity clouds (IHVCs). H i emission at a velocity of –117 km s*-1* towards the sightline HD 30677 (=190.2*∘,–22.2∘) with column density 1.71019* cm*-2* has no corresponding Ca ii K absorption in the UVES spectrum, which has a signal-to-noise (S/N) ratio of 610 per resolution element. The star has a spectroscopically determined distance of 2.7-kpc, and hence sets this as a firm lower distance limit towards Anti-Centre cloud ACII. Towards another sightline (HD 46185 with =222.0*∘, –10.1∘), H i at a velocity of +122 km s-1* and column density of 1.21019 cm*-2* is seen. The corresponding Ca ii K spectrum has a S/N = 780, although no absorption is observed at the cloud velocity. This similarly places a firm lower distance limit of 2.9-kpc towards this parcel of gas that may be an intermediate velocity cloud. The lack of intermediate velocity (IV) Ca ii absorption towards HD 196426 (=45.8*∘,–23.3∘) at a S/N = 500 reinforces a lower distance limit of 700-pc towards this part of Complex gp, where the H i column density is 1.11019* cm*-2* and velocity is +78 km s*-1*. Additionally, no IV Ca ii is seen in absorption in the spectrum of HD 19445, which is strong in H i with a column density of 81019 cm*-2* at a velocity of –42 km s*-1*, placing a firm although uninteresting lower distance limit of 39-pc to this part of IV South. Finally, no HV Ca ii K absorption is seen towards HD 115363 (=306.0*∘,–1.0∘) at a S/N = 410, placing a lower distance of 3.2-kpc towards the HVC gas at velocity of +224 km s-1* and H i column density of 5.21019 cm*-2*. This gas is in the same region of the sky as complex WE (Wakker 2001), but at higher velocities. The non-detection of Ca ii K absorption sets a lower distance of 3.2-kpc towards the HVC, which is unsurprising if this feature is indeed related to the Magellanic System.
keywords:
ISM: general – ISM: clouds – ISM: abundances – ISM: structure – stars: early-type
1 Introduction
The Paranal Observatory Project (POP; Bagnulo et al. 2003)111See also http://sc.eso.org/santiago/uvespop/ provides a wealth of high-resolution (80,000) optical spectra towards stars mainly in the Galactic disc that can be used to study subjects such as stellar properties, kinematics and the interstellar medium. In a previous paper (Hunter et al. 2006, hereafter Paper i) we used a sample of early-type stars in the POP survey in order to investigate the interstellar medium in the Na i UV, Ti ii and Ca ii K lines, using the stars as light sources to probe the material between the star and the Earth. Because these O- and B-type stars are often fast rotators with weak metal lines, they are ideal for probing narrow interstellar features.
In the current paper, we use mainly Ca ii and Ti ii spectra in order to search for Intermediate and High Velocity Clouds (IHVCs) towards the sightlines investigated in Paper i, plus some additional sightlines for which high S/N data have now become available. Our aim is to improve the distances to these still enigmatic objects by searching for IHVCs in the Villa-Elisa Southern Sky 21-cm H i Survey (Bajaja et al. 2005) or Northern Hemisphere counterpart, the Leiden-Dwingeloo Survey (Hartmann & Burton 1997), and subsequently searching for corresponding absorption in the Ca ii or Ti ii optical spectra. Although the distance to many Intermediate Velocity Clouds (IVCs) is known (e.g. Kuntz & Danly 1996 and references therein), to date there are very few uncontroversial upper distance limits towards High Velocity Clouds (HVCs). Indeed towards the main complexes there are currently only three uncontroversial detections; towards Complex A (van Woerden et al. 1999), Complex M (Danly, Albert & Kuntz 1993) and Complex WB (Thom et al. 2006). Hence it is still unclear whether many of these objects are associated with the Galaxy, for example linked with a Galactic fountain with distances of 10 kpc (e.g. Quilis & Moore 2001), or are failed dwarf galaxies with distances of several hundred kpc (e.g. Braun & Burton 1999). Clearly, as the sample stars in the POP survey were not chosen to intersect with known IHVC complexes, the majority of the sightlines do not cross known IHVCs. However, serendipitously a few of the sightlines intersect complexes and are studied in the current paper. In addition to the POP data, we include spectra from two recent high spectral resolution observing runs taken using the échelle spectrometer FEROS, plus further UVES observations whose primary aim was to obtain spectra for a stellar library but that are also at high S/N and cover the Ca ii K line (Silva et al. 2007).
The current work complements our previous studies in which we obtained improved distance limits towards IVC complexes gp and K and HVC complexes C, WA-WB, WE, and H (Smoker et al. 2004, 2006), by searching for absorption in high-resolution spectra of mainly B-type stars taken from the Edinburgh-Cape (Stobie et al. 1997) and Palomar-Green Surveys (Green, Schmidt & Liebert 1986). In particular the current sightlines intersect IVC Complex K with previous distance limit of 0.7–6.8-kpc (de Boer & Savage 1983, Smoker 2006), the Anti-Centre clouds with previous distance limit of 0.4-kpc (Tamanaha 1996) and Complex WE with distance limit 12.8-kpc (Sembach et al. 1991). Finally, one of our current sightlines lies towards the M 15 intermediate velocity cloud lying in the IVC complex gp. This cloud has been studied extensively, in the optical to determine variations in velocity and equivalent width variations (Lehner et al. 1999, Meyer & Lauroesch 1999, Smoker et al. 2002), plus in the H i, infrared and H (Kennedy et al. 1998, Smoker et al. 2002). An improvement in the current distance limit of 0.8–4.3 kpc (Wakker 2001 and references therein) would be very useful to more accurately define the cloud parameters such as cloudlet sizes and densities and to provide clues to the high metalicity of this IVC (Little et al. 1994).
Sect. 2 describes the sample, provides a table noting the cases where the current sightlines cross known IHVC complexes plus new observations not previously described in Paper I, and shows the optical and H i spectra. Sect. 3 gives the main results, including the cases where the current optical sightlines intersect IHVCs and an attempt to obtain improved distance limits towards these clouds. Sect. 4 discusses the most interesting lower limits to IHVCS and finally Sect. 5 gives a summary of the main findings.
2 The sample, observations and data reduction
The list of sample stars is shown in Table 1. The table includes all stars for which new observations were taken, plus sightlines that lie towards IHVC complexes that are discussed in Sect. 3.2, but does not include the POP paper i objects that have no IHVC detection. Further information concerning the POP objects is given in Paper i. They are all O- and B-type stars with 2.3 7.9 mag. For these POP optical spectroscopic data, we used the on-line versions of reduced data from the Paranal Observatory Project (Bagnulo et al. 2003). These are spectra taken with the UVES échelle spectrometer mounted on the 8.2-m Kueyen telescope at the Very Large Telescope at a spectral resolution of 80,000 or 3.75 km s*-1* and S/N pixel*-1* ranging from 190–770. In this paper we concern ourselves with the Ca ii K (=3933.66Å) and Ti ii (=3383.76Å) species only. A further 9 stars were observed with FEROS on the ESO 2.2-m on La Silla during observing sessions in Oct. 2005 (FER1 in Table 1) and May 2006 (FER2 in Table 1). These stars are all B-type post-AGB stars or Planetary Nebulae and have fainter magnitudes than the POP stars, with 9.4 13.3 mag. The S/N ratios pixel*-1* at Ca ii K range from 40–120 and the resolution is =48,000. The spectra shown in this paper are the quick-look pipeline products. As a check of their reliability, during each of the FEROS runs a bright B-type star from the POP survey was observed and the velocities and equivalent widths of some of the absorption lines were compared between the two datasets. Agreement was found to be excellent. Finally, 12 stars were taken from the dataset of Silva et al. (2007; S07 in Table 1). These are UVES spectra of early-type stars with 5.9 11.3 mag., observed at a spectral resolution of 40,000 with S/N = 100–620 pixel*-1*, and were reduced using the ESO pipeline (MIDAS context) with calibrations taken the morning after the observations. For the H i 21–cm spectra, we used either the Southern Villa-Elisa H i survey data (Bajaja et al. 2005), corrected for the effects of stray radiation or the Leiden-Dwingeloo survey for sightlines with Dec.–20*∘* (Hartman & Burton 1997). Both surveys have been merged to form the Leiden/Argentine/Bonn (LAB) H i line survey (Kalberla et al. 2005) which has a velocity resolution of 1 km s*-1* and brightness temperature sensitivity of 0.07 K.
In Table 1 the columns are as follows. Columns 1–5 give the star HD name, alternative name, Galactic coordinates and -band magnitude taken from simbad. Columns 6–7 give the estimated stellar distance and -height above or below the Galactic plane. These distances were primarily estimated using the method of spectroscopic parallax from the spectral type, apparent magnitude and reddening towards each star, estimated from the observed colour. Absolute magnitudes as a function of spectral type were taken from Schmidt-Kaler (1982) with colours from Wegner (1994). Details are given in Paper i. Excluding perhaps large systematic errors caused by the uncertainty in the absolute magnitude calibration of our sample, the distances have an uncertainty of 30 per cent. For a number of objects (in particular the Wolf-Rayet stars, peculiar objects and Post-AGB stars), distances were taken from the reference given at the foot of the table. For example for HD 179407 the distance is given as 76001 where the suffix refers to reference number 1 where the distance of 7600-pc was given. Column 8 gives the signal-to-noise (S/N) ratio pixel*-1* in the Ca ii spectrum; to obtain the S/N per resolution element this needs to be multiplied by .
If the coordinate of the sightline lies within any of the figures of Wakker (2001) which display H i column densities towards IHVCs, this name is given in Column 9. We must stress that although more than 35 of our stars lie within the boundaries of these figures, often they are in regions where no IHVC is observed in H i, for example because the stars lie in holes in the H i distribution. Columns 10 and 11 give the minimum and maximum expected LSR velocity for gas orbiting the Galactic Centre, based on the direction of the sightline and the distance to the stellar target. To calculate the velocity range for ”normal” gas, we use the methodology of Wakker (1991), in that we assume a flat rotation curve with rot = 220 km s*-1* at 0.5 kpc, decreasing linearly towards the Galactic Centre, together with equations from Mihalas & Binney mih81 (1981). A deviation velocity for interstellar cloud components which lie outside the expected velocity range is calculated, where the deviation velocity is defined as the difference between the velocity of the component and the nearest limit of the expected velocity range (Wakker 1991). We classify low velocity clouds (LVCs) as having absolute values of their deviation velocities below 30 km s*-1*, IVCs between 30 km s*-1* and 90 km s*-1*, and HVCs greater than 90 km s*-1*. Finally, column 12 gives the source for the optical spectra (POP for stars from Paper i; FER1/FER2 for FEROS observations; S07 for stars from Silva et al. 2007), and H i data (LD for Leiden-Dwingeloo; VE for Villa-Elisa Survey sightlines).
3 Results
In this section we discuss those cases where the stellar sightlines intersect with known IHVCs, and hence determine improved distance estimates towards a handful of objects.
Fig. 1 shows the optical and H i spectra towards the sightlines where a distance limit has been determined towards an IHVC. Fig. 2 (available online) shows the remaining sightlines. Two plots are shown for each sightline in order to emphasise both weak and strong features. The majority of the optical spectra are in the Ca ii K line; where this was not available the Ti ii line is shown. The horizontal line at the top of the first of the optical plots shows the extent of the full width half maximum of the stellar line. In most cases, these lines are wide, hence there is no possibility that stellar lines could be misidentified as interstellar features, which tend to be much narrower. If the stellar lines have a FWHM exceeding 100 km s*-1* they were removed in the normalisation process to facilitate visualisation of the interstellar lines in all cases apart from HD numbers 115363, 136239 and 142758 where too much overlap of stellar and interstellar components occur.
3.1 Methodology of estimating distances to IHVCs
The method of estimating distances to IHVCs is discussed fully in Schwarz, Wakker & van Woerden (1995). For an upper distance limit, detection of optical absorption, in association with an H i detection, is sufficient to provide an upper distance limit, being the distance of the stellar probe. Lower-distance limits are more problematic. A firm lower distance limit can only be set if no optical absorption is seen at a sufficient S/N ratio, the abundance of the optical element is known (generally from observations of the same part of the complex towards QSOs), and the H i column density is accurately defined using a pencil beam. For the current sample, the chemical abundance of the IHVC is often not known, and the observations in H i only have a spatial resolution of 0.5*∘*, which means that care must be taken in ascribing a lack of optical absorption as due to the stellar probe being closer than the IHVC. However, these factors are somewhat ameliorated by the fact that the optical spectra have high S/N, frequently being 500 per resolution element and with a median of 410 in the sightlines with a detected IHVC.
3.2 Distance limits towards individual complexes
A number of the current sightlines either intersect with known IHVC complexes, or have gas present at IHVC velocities in the Villa-Elisa or Leiden-Dwingeloo H i spectra. These cases are discussed below, and lower distance estimates towards five IHVCs are determined. Table 2 summarizes these cases. Columns 1–6 gives the star name, stellar distance, previous IHVC distance limit, IHVC complex, observed H i velocity and corresponding log of the H i column density. Columns 7–8 give the previously-known abundance in Ca ii taken from Wakker (2001) and limiting 5 Ca ii column density estimated from the current spectra. This was derived using the observed S/N ratio and instrumental resolution, assuming the the optically thin approximation. Finally, column 9 gives the predicted Ca ii column density derived by subtracting the previously-known Ca ii abundance from the log of the observed H i column density. Where this predicted value is much higher than the limiting 5 Ca ii column density a non-detection is interpreted as the cloud lying further away than the stellar probe. Individual complexes are discussed below.
3.2.1 Complex gp IVC
Complex gp is a positive-velocity IVC lying in the direction of the globular cluster M 15, which has previously been studied in infrared, optical, H and H i by Smoker et al. (2002). The previously-existing distance limit was 0.8–4.3 kpc (Wakker 2001 and references therein) with an uncertain lower distance limit of 2.0-kpc (Smoker et al. 2006). The Complex has LSR velocities of +60 to +90 km s*-1*. In our current sample, the star HD 188294 lies towards this Complex, but only has a distance of 212-pc and no H i is detected for this sightline due to it being in a “hole” in the Complex. Additionally, HD 196426 (=45.81*∘,–23.32∘) lies towards Complex gp, and weak H i is observed in emission in the Leiden-Dwingeloo spectrum, with a LSR velocity +781 km s-1*, a FWHM of 242 km s*-1*, peak brightness temperature =0.250.05 K and brightness temperature integral of 6.51.0 K km s*-1*, corresponding to an H i column density of 1.10.21019 cm*-2*. Although weak, this should have been detected in our UVES spectrum which has a S/N = 500 per resolution element. The star has a distance of 700-pc, which is similar to the distances for previous objects towards which there were non-detections. In Complex gp we also observed HD 179407 (=24.02*∘,–10.4∘, distance=7600-pc) at a S/N pixel-1* of 120 in Ca ii K. At the current position, there are two weak H i velocity features, at =+501 and =+971 km s*-1* with FWHM values of 262 and 424 km s*-1* and brightness temperature integrals of 1.70.2 and 1.70.2 K km s*-1* respectively, corresponding to column densities of 31018cm*-2*. There is obvious detection of Ca ii in the +50 km s*-1* feature (as in the Ca ii spectrum of Sembach & Danks 1994), but no detection of the v km s*-1* feature, perhaps due to clumpiness in the H i or ionisation issues; a higher S/N Ca ii spectrum would be useful. Given the weak nature of both H i features a higher spatial-resolution and sensitivity H i spectrum would be useful at this position although in any case the star lies at a distance exceeding the current upper limit of the cloud. Although HD 179407 was also observed in the FUSE spectrum by Zsargo et al. (2003), the presence of a complex stellar continuum meant that no interstellar O vi was observed. Finally, although EC 20485-2420 lies in the general direction of this complex, no H i is obvious in the Villa-Elisa spectrum.
3.2.2 IV South
IV South is a group of IVCs that extend over much of the southern sky, with velocities of –85 to –45 km s*-1*. Towards HD 19445 (=157.48*∘,–27.20∘), no IV absorption is seen in the Ca ii spectrum at a S/N of 280 per resolution element, thus placing a rather uninteresting firm lower distance limit of 39-pc to this part of the IVC that has two components with =–450.5 km s-1*, –40.20.5 km s*-1*, FWHM values of 81 km s*-1* and 222 km s*-1*, peak TB values of of 2.10.2 K and 1.20.2 K and brightness temperature integral of 172 K km s*-1* and 283 K km s*-1*. The combined H i column density in these two features is 81019 cm*-2* which should have been easily detected in the current optical spectrum if the cloud were closer than the star.
3.2.3 Complex K
Complex K is a Northern-Hemisphere cloud with LSR velocities ranging from –65 to –95 km s*-1*. Its previous distance bracket was 700–6800-pc (Smoker et al. 2006 and refs. therein). One of our sightlines towards G169-28 (=41.83*∘,+36.06∘*) lies in the general direction of Complex K, but no H i emission is visible in the Leiden-Dwingeloo spectrum and there are many stellar lines. Thus the current observations do not add anything to our knowledge of this IVC.
3.2.4 Anti-centre HVCs
Seven of our sightlines lie in the region of the Anti-Centre HVC (Fig. 9 of Wakker 2001). No upper distance limit is available for this HVC and the previous lower-distance limit towards Cloud ACI is only 0.4-kpc (Tamanaha 1996). We only detect H i at high velocity towards one of the current sightlines which lies towards ACII, namely HD 30677 at a velocity of –1171 km s*-1*, peak brightness temperature of 0.400.04 K, FWHM of 232 km s*-1* and integrated brightness temperature of 9.51.0 K km s*-1*, corresponding to an HVC column density of 1.70.21019 cm*-2*. Assuming that the HVC has a similar abundance to the relation from Wakker & Mathis (2000), we would expect a corresponding column density log(Ca ii cm*-2*)=11.64. However, no corresponding optical absorption is detected in our Ca ii K spectrum, which has a S/N = 430 pixel*-1* or 610 per resolution element. Assuming that the cloud is optically thin in Ca, a 5 detection, f = 0.634 for the Ca ii K transition and instrumental resolution of 0.05Å, the limiting column density observable with the current spectrum is log(Ca ii cm*-2*)=9.82, more than a factor 60 lower than predicted from the H i profile. Hence the current observations put a firm lower distance limit of 2.7-kpc towards complex ACII, assuming that the H i observed in the Villa-Elisa survey reflects that in the pencil beam towards HD 30677.
3.2.5 Complex WE/WEM HVC
Complex WE is a group of small HVCs centred on ()(320*∘,0∘), first detected by Mathewson, Cleary & Murray (1974) and mapped in H i by Morras (1982). Parts of it lie in the same region of the sky as two large low-velocity H i shells in the direction of the Coalsack nebula described by McLure-Griffiths et al. (2001). At 0∘* latitude the predicted values of Galactic rotation at 320*∘* are from –120 to +70 km s*-1*, falling to –100 to 0 km s*-1* at –15*∘. Towards HD 156359 (=328.68∘, –14.52∘), Sembach et al. (1991) found optical absorption at +110 km s-1*, putting an upper distance limit of 12.8 kpc. Eighteen of our sightlines lie within the general area of WE as defined in Fig. 11 of Wakker (2001). One of the sample stars HD 115363 (=306.0*∘,–1.0∘* with spectroscopic distance=3.2-kpc) has HVC gas detected with two components at +224.53.0 km s*-1*, +240.05.0 km s*-1*, velocity widths 14.40.8 km s*-1* and 19.22.4 km s*-1*, peak brightness temperatures of 1.80.06 K and 1.10.1 km s*-1* and brightness temperature integrals of 28.31.0 K km s*-1* and 11.10.8 K km s*-1* which correspond to H i column densities of 5.2 0.21019 cm*-2* and 2.00.11019 cm*-2*. There is no Ca ii K absorption present in the spectrum, which has a S/N = 410 per resolution element. This HVC is probably associated with the clouds defined by Putman (2000) as the Leading Arm: the counterpart of the Magellanic Stream, as projected on the sky, between the Magellanic Clouds and the Galactic Plane. These data hence set an unsurprising lower limit of 3.2-kpc towards this HVC that is probably related to the Magellanic System, using our distance estimated spectroscopically . If we assume that HD 115363 is a part of the Centaurus OB1 association, its distance is slightly closer at 2.5-kpc (McClure-Griffiths et al. 2001 and refs. therein). Finally we note that this HVC appears to be a different set of clouds to the lower-velocity and more negative galactic-latitude clouds described in Wakker (2001) and observed by Sembach et al. (1991), hence in the current paper it is named WEM due to its possible association with the Magellanic system.
3.2.6 Other IVCs
In the line-of-sight towards HD 46185 (=222.0*∘,–10.1∘), H i emission is detected at +1222 km s-1*, with a peak brightness temperature of 0.35 K, FWHM of 173 km s*-1* and brightness temperature integral of 6.70.7 K km s*-1*, corresponding to an H i column density of 1.20.11019 cm*-2*. Normal Galactic rotation predicts velocities of upto +97 km s*-1* in this part of the sky, so the deviation velocity is only 25 km s*-1* and the cloud many not be an IVC. Assuming that the cloud has a similar abundance to the relation from Wakker & Mathis (2000), we would expect a column density log(Ca ii K cm*-2*)=11.59. However, no corresponding optical absorption is detected in our Ca ii K spectrum, which has a S/N = 550 pixel*-1* or 780 per resolution element. The 5 limiting column density observable with the current spectrum is log(Ca ii cm*-2*)=9.71, a factor 75 lower than predicted from the H i profile. Hence the current observations put a firm lower distance limit of 2.9-kpc towards this parcel of gas that lies within 20*∘* of the Anti-Centre Shell (Fig. 8 of Wakker 2001) but is at different velocities and probably unrelated.
3.3 IHVCs detected in Ca ii absorption
A number of sightlines were already flagged in Paper i as having IHVC components detected in the optical spectra. These include the Wolf Rayet stars HD 94910 and HD 163758 and the sightline HD 72067 which lies towards the Vela Supernova remnant. No H i is detected towards any of these sightlines. In the first two cases this implies the presence of circumstellar lines and in the latter case lines within the SN remnant. Similarly, towards HD 171432 many IVCs are detected in the optical. This sightline lies towards the Scutum Supershell mapped in H i by Callaway et al. (2000) and with a distance of 3000-pc. Although towards HD 171432 there is a dearth of H i detected in the Callaway maps, there is H i in our H i spectrum up to a velocity of +90 km s*-1*, coincident with our detections of Ca ii. No H i is seen in our highest-velocity Ca ii component of +120 km s*-1*, perhaps due to S/N limitations. The detections in Ca ii and H i are consistent with the supershell being closer than our stellar distance of 4000 pc and with the previous observations, but add nothing to the distance bracket.
4 Discussion
Table 3 gives a summary of the distance limits to IHVCs set by the current observations, plus existing limits to the clouds where available. Particularly interesting is the improved lower limit towards part of the Anti-Centre complex ACII which has firm lower-distance limit of 2.7-kpc. This compares with the indirect distance estimate of a part of the complex at 60*∘,–45∘* derived from morphological and kinematical arguments of 4-kpc (Peek et al. 2007), and an H estimated distance of between 8 and 20-kpc (Weiner et al. 2001) which is based upon the observed ionisation being caused by the Galactic radiation field. Although a big improvement on the previous lower-distance limit of 0.4-kpc (Tamanaha 1996), the current observations cannot discriminate between the indirectly-estimated distances and clearly searches for more distant probe stars in this part of the sky would be useful. Other less interesting results are the consolidation of the lower-distance limit towards complex gp and the first lower distance limit towards the WEM complex. The -distance of the former IVC is now constrained to 300-1700-pc which compares to the H i scaleheight of 200-pc at Galactocentric radii of 10-kpc (Narayan, Saha & Jog 2005). Further progress on this sightline should involve performing obtaining a high-resolution spectrum of the star HD 357657 and associated model atmosphere calculation and abundance analysis. Although Smoker et al. (2006) estimated a distance of 2.0-kpc for this object on the line of sight to Complex gp and found no associated Ca ii absorption, the distance of the star remains uncertain. If a firm lower distance limit of 2-kpc were confirmed, cloud parameters such as the cloudlet sizes, cloud electron density, fractional H i to H ii ratios and ionizing radiation field could be better constrained (c.f. Smoker et al. 2002), and the position of the cloud relative to the H i disc of the Galaxy confirmed.
Finally, the lower distance limit of 3.2-kpc towards HVC WEM is consistent with both a Magellanic origin as proposed for example by Putman (2000), or a ’classical’ high velocity cloud. H i synthesis mapping towards other HVCs in this part of the sky (e.g. Bekhti et al. 2006) have provided evidence from cloud structure and linewidths of distances of 10–60-kpc, consistent with a Magellanic origin, and the same observations could be performed for the present sightline in order to obtain an indirect distance estimate, perhaps in conjunction with H mapping. However, in the absence of early-type stars present in the leading arm as present in the Magellanic Bridge (Rolleston et al. 1999), obtaining a firm upper distance limit will be difficult although perhaps possible due to the offset in velocity from the stellar and interstellar Ca ii K lines (c.f. Smoker et al. 2002).
5 Summary
We have correlated optical spectra in the Ca ii K and Ti ii lines observed towards early-type stars in the POP Survey, plus other optical data, with 21-cm H i spectra taken from the Villa-Elisa and Leiden-Dwingeloo Surveys, in order to determine the distances to Intermediate and High Velocity Clouds. The lack of Ca ii K absorption at –117 km s*-1* towards HD 30677 at a S/N ratio of 610 has set a firm lower distance limit towards Anti-Centre cloud ACII which previously had a lower distance limit of 0.4-kpc. Likewise, towards HD 46185 no Ca ii K absorption at +122 km s*-1* is seen at a S/N ratio of 780, hence placing a lower distance limit of 2.9-kpc towards this gas that is perhaps an IVC. Towards Complex gp no Ca ii K absorption is seen in the spectrum of HD 196426 at a S/N of 500, reinforcing the assertion that this IVC lies at a distance exceeding 0.7-kpc. Likewise, towards the nearby star HD 19445 at 39-pc in the line of sight to IV South no Ca ii K absorption is seen setting a a firm but uninteresting distance limit towards this part of the complex. Finally, no HV Ca ii K absorption is seen in the stellar spectrum of HD 115363 at a S/N = 410, placing a lower distance of 3.2-kpc towards the HVC gas at velocity of +224 km s*-1*. This gas is in the same region of sky as the WE complex of Wakker (2001), but at higher velocities. If related to the Magellanic system (Putman 2000) then a distance limit of 3.2-kpc is not unexpected.
A future paper will describe the use of new FEROS observations combined with UVES archive data to provide improved distance limits to complex EP, the Cohen Stream, IV South and the Anti-Centre shell. Concerning the POP data, future papers will investigate the neutral species of Ca i, Fe i, Na i D and K i as well as molecular line species CH, CH*+* and CN in order to better understand the local interstellar medium.
acknowledgements
We would like to thank the staff of the Very Large Telescope, Paranal for the large amount work involved in producing the POP Survey (ESO DDT programme ID 266.D-5655(A), http://www.eso.org/uvespop). Especially due thanks are S. Bagnulo, R. Cabanac, E. Jehin, C. Ledoux and C. Melo. In addition, we are grateful to the staffs of Dwingeloo/Leiden and the Villa-Elisa Telescope for producing the H i all sky surveys. JVS and HMAT thank the support staff at La Silla for their help with the FEROS observations. FPK is grateful to AWE Aldermaston for the award of a William Penney Fellowship. This research has made use of the simbad Database, operated at CDS, Strasbourg, France. JVS acknowledges financial support from the Particle Physics and Astronomy Research Council with HMAT and IH thanking the Department of Education and Learning for Northern Ireland. JVS thanks M. García Muñiz, L. Salinas and I. Dino for discussions and to an anonymous referee for comments.
The reference list from the paper itself. Each links out to its DOI / PubMed record.
- 1(1) Bagnulo S., Jehin E., Ledoux C., Cabanac R., Melo C., Gilmozzi R., 2003, ESO Messenger no. 114, Page 10
- 2Bajaja et al. (2005) Bajaja E., Arnal E. M., Larrarte J. J., Morras R., Pöppel W. G. L., Kalberla P. M. W., 2005, A&A, 440, 767
- 3(3) Beers T.C., Chiba M., Yoshii Y., Platais I., Hanson R. B., Fuchs B., Rossi S., 2000, AJ, 119, 2866
- 4(4) Bekhti B., Bruns C., Kerp J., Westmeier T., 2006, A&A, 457, 917
- 5(5) Braun B., Burton W. B., 1999, A&A, 341, 437
- 6(6) Callaway M. B., Savage B. D., Benjamin R. A., Haffner L. M., Tufte S. L., 2000, Ap J, 532, 943
- 7(7) Carney B. W., Latham D. W., Laird J. B., Aguilar L. A., 1994, AJ, 107, 2240
- 8(8) Danly L., Albert C. E., Kuntz K. D., 1993, Ap J, 416, 29