Acoustic resonances in microfluidic chips: full-image micro-PIV experiments and numerical simulations
S. Melker Sundin, Thomas Glasdam Jensen, Henrik Bruus, Jorg P., Kutter

TL;DR
This paper demonstrates that combining full-image micro-PIV with transient particle imaging effectively studies acoustic forces and streaming in microfluidic chips, supported by experiments and numerical simulations of acoustic eigenmodes.
Contribution
It introduces a comprehensive approach integrating micro-PIV and numerical modeling to analyze acoustic phenomena in microfluidic devices under MHz actuation.
Findings
Steady-state particle motion aligns with acoustic eigenmodes.
Numerical solutions confirm experimental observations.
Effective method for studying acoustic resonances in microfluidics.
Abstract
We show that full-image micro-PIV analysis in combination with images of transient particle motion is a powerful tool for experimental studies of acoustic radiation forces and acoustic streaming in microfluidic chambers under piezo-actuation in the MHz range. The measured steady-state motion of both large 5 um and small 1 um particles can be understood in terms of the acoustic eigenmodes or standing ultra-sound waves in the given experimental microsystems. This interpretation is supported by numerical solutions of the corresponding acoustic wave equation.
Click any figure to enlarge with its caption.
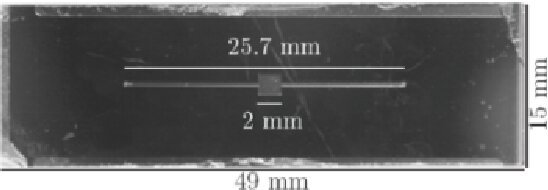 Figure 1
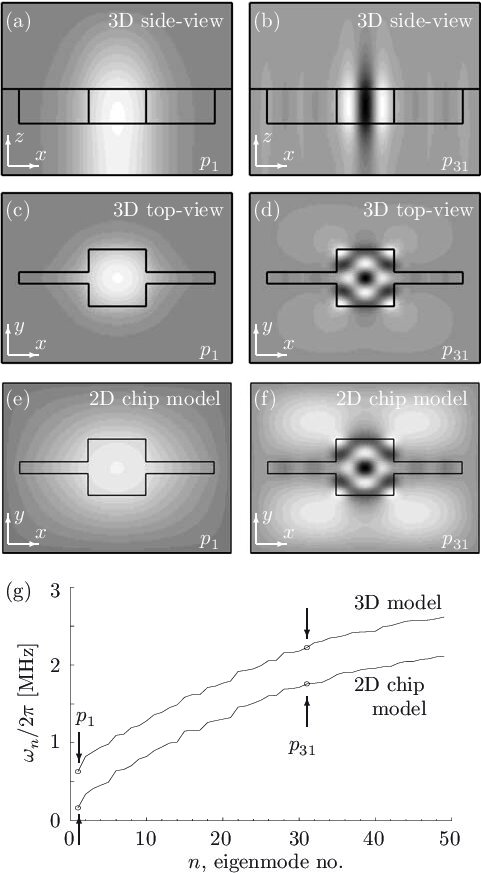 Figure 2
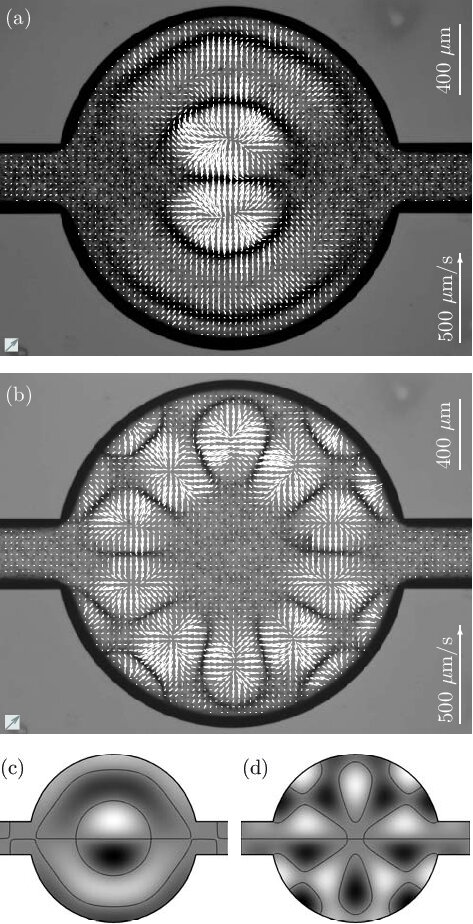 Figure 3
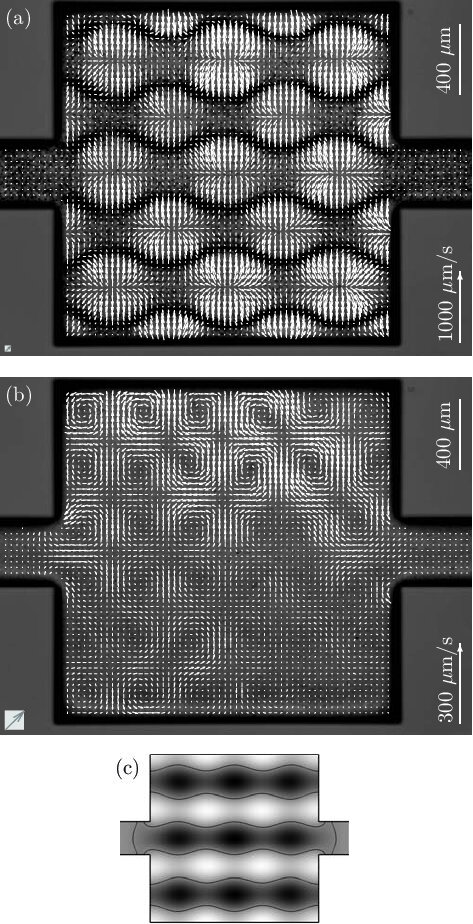 Figure 4
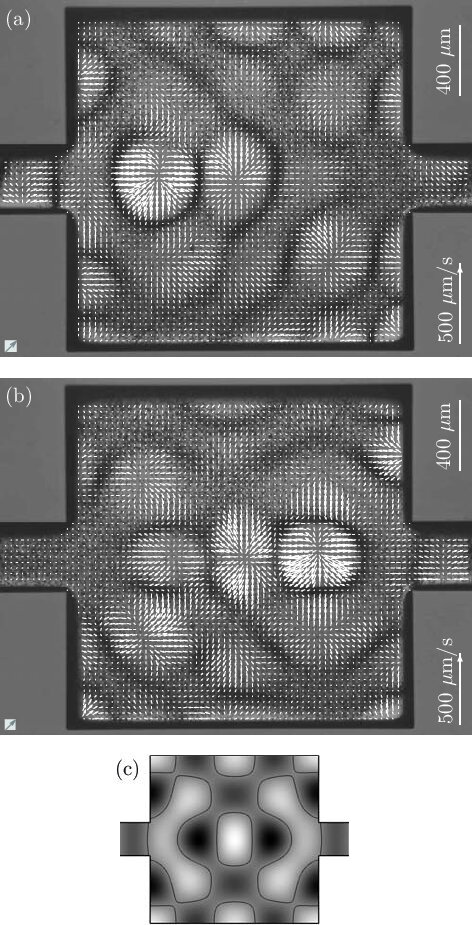 Figure 5
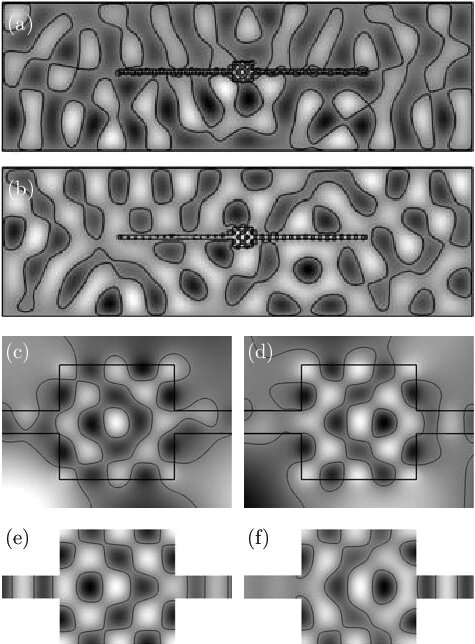 Figure 6
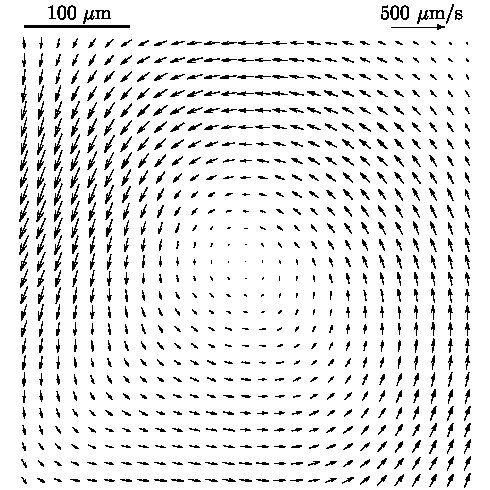 Figure 7
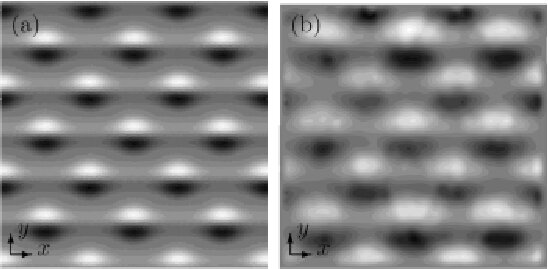 Figure 8
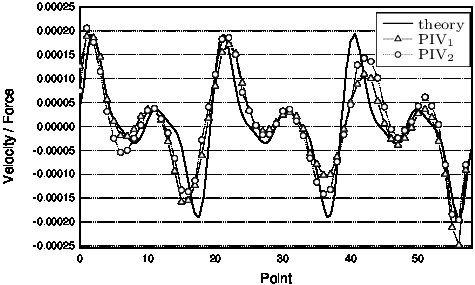 Figure 9
| chip length | 49 mm | silicon thickness | 500 m | ||
| chip width | 15 mm | pyrex thickness | 500 m | ||
| channel length | 26 mm | chamber height | 200 m | ||
| channel width | 400 m | chamber width | 2 mm |
| tracer type | force | direction |
|---|---|---|
| beads (1 m) | weak | nodes |
| beads (5 m) | strong | nodes |
| red blood cells | strong | nodes |
| milk particles | weak | anti-nodes |
| large micelles | strong | anti-nodes |
| fluorescein | none | - |
| material | speed of sound | density | |
|---|---|---|---|
| water | 1483 m/s | 998 kg/m3 | |
| silicon | 8490 m/s | 2331 kg/m3 | |
| pyrex | 5640 m/s | 2230 kg/m3 | |
Peer Reviews
No public reviews on file for this paper yet. If you reviewed it on a platform where reviews are public (OpenReview, ICLR, NeurIPS, ICML), you can paste yours below so the community can read it here.
Videos
No videos yet. Explain this paper in a talk, walkthrough, or lecture? Add one.
Acoustic resonances in microfluidic chips:
full-image micro-PIV experiments and numerical simulations
S. M. Sundin, T. Glasdam Jensen, H. Bruus and J. P. Kutter
MIC – Department of Micro and Nanotechnology, Technical University of Denmark
DTU Bldg. 345 east, DK-2800 Kongens Lyngby, Denmark
(30 March 2007)
Abstract
We show that full-image micro-PIV analysis in combination with images of transient particle motion is a powerful tool for experimental studies of acoustic radiation forces and acoustic streaming in microfluidic chambers under piezo-actuation in the MHz range. The measured steady-state motion of both large 5 m and small 1 m particles can be understood in terms of the acoustic eigenmodes or standing ultra-sound waves in the given experimental microsystems. This interpretation is supported by numerical solutions of the corresponding acoustic wave equation.
I Introduction
For the typical dimensions of microfluidic structures there are two acoustic effects of main importance: the acoustic radiation force King1934 ; Yosioka1955 ; Gorkov1962 , which moves suspended particles either towards or away from pressure nodes depending on their acoustic material properties, and acoustic streaming Rayleigh1883 ; Riley2001 , which imparts movement onto the entire solvent. Both of these forces have been utilized, alone or in combination, for several lab-on-a-chip applications. Yasuda et al. Yasuda1995 ; Yasuda1996 , demonstrated concentration of particles by acoustic radiation forces, and separation of particles by acoustic forces in combination with electrostatic forces. One of the most attractive applications for acoustics in microfluidics is for mixing Zhu1998 ; Yang2001 ; Liu2003a , as this process typically is diffusion limited in microscale devices. Valveless ultrasonic pumps, utilizing acoustic streaming, have also been presented Rife2000 ; Andersson2001 . Numerous examples of microsystems where acoustics are applied to handling and analysis of biological material have been suggested. Among others these include: trapping of microorganisms Saito2002 , bioassays Lilliehorn2005 , and separation and cleaning of blood Nilsson2004 ; Jonsson2004 ; Li2004 . Apart from on chip devices, acoustic forces have also been suggested for use in other m-scale applications Wiklund2003 .
There are different imaging strategies and tools, which can be used in order to enhance the understanding, and to visualize the function of acoustic micro-devices during operation. For acoustic mixers the effect can be illustrated and measured by partly filling the mixing chamber with a dye prior to piezo-actuation Yang2001 ; Liu2003a . However, this approach is mainly limited to determine the total, and not the local, mixing behavior within the chamber. A more refined method, which is not limited to the study of micromixers, is to apply streak- or streamline analysis. This was shown by Lutz et al. Lutz2003 ; Lutz2005 , who neatly demonstrated 3D steady micro streaming around a cylinder. Although streamline analysis can be employed to illustrate flow behaviour, it is not suitable in determining local variations in velocity. For that purpose, the micron-resolution particle image velocimetry (micro-PIV) technique is the method of choice Santiago1998 . With this technique the motion of tracer particles, acquired from consecutive image frames, is utilized to obtain velocity vector fields. In a large chamber, local measurements of particle motion induced by acoustic radiation forces and acoustic streaming have been performed by Spengler et al. Spengler2000a ; Spengler2003 , and further developed by Kuznetsova et al. Kuznetsova2004 . Li and Kenny derived velocity profiles in a particle separating device utilizing the acoustic radiation force Li2004 . Jang et al. used confocal scanning microscopy to perform micro-PIV measurements on circulatory flows in a piezo-actuated fluidic chamber Jang2005 . Furthermore, Manasseh et al. applied micro-PIV to measure streaming velocites around a bubble trapped in a microfluidic chamber Manasseh2006 .
As particles under the influence of acoustic fields do no longer function as true independent tracers in all situations, and as several acoustic effects come into play at the same time, extra caution and consideration have to be taken when applying micro-PIV for microfluidic acoustic studies. These considerations will be discussed in more detail in section II.3. The situation is further complicated by the coupling from the actuator to the structures and their acoustic resonances, which is a yet poorly understood mechanism. The resonances depend on the acoustic material parameters as well as the geometry of both the chip and the chamber. For substrate materials with low attenuation, such as silicon, the actuation will result in strong resonances over the whole devices, whereas for substrate materials with high attenuation, the effect will be mostly confined to the proximity of the actuator. Moreover, in a real system the coupling strengths vary for different resonances, and amplitude fluctuations across the structures are often observed. Therefore, if investigations striving to yield a better understanding of acoustic resonances in low attenuation microfluidic chips are to be performed, it is not sufficient only to study the acoustic phenomena locally.
In this work, full-image micro-PIV analysis in combination with images of transient particle motion is suggested as a tool for studying acoustic resonances in microfluidic chambers under piezo-actuation. The acousto-fluidic phenomena mentioned above can be investigated by comparing these experimental images with plots of acoustic eigenmodes of the device structure obtained by numerical solution of the corresponding acoustic wave equation.
II Materials and experimental methods
II.1 Microchip fabrication
In this study, two microfluidic chambers were investigated, one of quadratic footprint with a side-length of 2 mm and one of circular shape with a diameter of 2 mm. The size was chosen to be a few times the acoustic wavelength of 2 MHz ultrasound waves in water, and the specific shapes were employed to ensure simple patterns in the pressure field at the acoustic resonances. Both chambers were connected to 400 m wide inlet and outlet channels, and the depth was 200 m throughout. The microfluidic chips were fabricated in silicon via deep reactive ion etching (DRIE). The same technique was also applied on the backside of the chip to etch 300 m diameter round fluidic inlets. Anodic bonding was used to seal the structures with a 500 m thick pyrex glass lid on the channel side. Silicon rubber tubings were glued to the holes on the backside of the chip, for easy attachment of teflon tubing. A picture of one of our microfluidic chips is shown in Fig. 1, and a list of the geometrical parameters is given in Table 1.
II.2 Experimental setup and procedure
The piezo-actuator (Pz27, Ferroperm) was pressed to the backside of the chip using an ultrasonic gel (ECO, Ceracarta) and biased by a 20 V ac tone generator (Model 195, Wavetek). Images were captured with a progressive scan interline CCD camera (Hisense MkII, Dantec Dynamics), mounted with a 0.63x TV-adapter on an epifluorescent microscope (DMLB, Leica). The objective used was a Plan 5x with a numerical aperture NA of 0.12. For the given fluidic geometries, this combination allowed capture of full-image PIV vector fields, while utilizing the largest number of pixels on the CCD. A blue light emitting diode, LED, (Luxeon Star 3W, Lumileds) was used as illumination source in a front-lit configuration, which is described elsewhere Sundin2007 . The LED was powered by an in-house built power supply controlled by a PIV timing system (Dantec Dynamics). Image acquisition was performed on a PC with Flowmanager software (Dantec Dynamics). As tracer fluids solutions of 1 m polystyrene micro-beads (Duke Scientific), 5 m polyamide micro-beads (Danish Phantom Design), diluted milk, and fluorescein have been used.
The investigations were performed by scanning the applied frequency from the tone generator and identifying those frequencies which led to a strong response, an acoustic resonance, in the microfluidic chamber. At the resonance frequencies, the behavior of the different tracer particle solutions was observed. Between successive recordings the chip was flushed to assure homogeneous seeding. Furthermore, to make sure that only particle motion caused by acoustic forces were recorded, no external flow was applied during measurements.
II.3 Micro-PIV considerations
In micro-PIV tracer particles are chosen for their ability to truthfully follow the motion of the flow that is to be investigated. Particles under the influence of an acoustic field do no longer fulfil this criterium in all situations. Therefore, extra caution and considerations have to be taken regarding what movements are actually measured when applying micro-PIV for these types of studies. Given that particle motion caused by thermal or gravitational forces can be neglected, the main task is to determine if particle motion is caused by acoustic radiation forces, acoustic streaming or a combination of the two. In this study, this problem was tackled by applying three tracer solutions with different physical properties.
Typically, the large polyamide particles are more strongly affected by the acoustic radiation forces than by the forces due to acoustic streaming of the surrounding water. In contrast, since the acoustic radiation force scales with the volume of the particle, the small polystyrene particles will follow the motion of the water, if relatively strong acoustic streaming is present. However, there is no simple relation between the two forces, and for an arbitrary frequency and geometry one can be strong whereas the other is not, and vice versa. Therefore, in order to determine whether particle motion is caused by acoustic radiation forces or acoustic streaming it is necessary to utilize the dependance of the acoustic radiation forces on the compressibility of the particle.
The polymer particles will move towards the pressure nodes since their compressibility is smaller than that of water. The opposite is true for the lipid particles in milk: their compressibility is larger than that of water, and consequently they will move towards pressure antinodes. Like the small polystyrene particles, the lipid particles we used were small enough to typically follow the net acoustic streaming flow of the water. Thus, if similar motion is recorded with two types of tracers with different compressibilities compared to the medium, the acoustic radiation forces can be ruled out as cause of the motion. As an alternative or complementary technique to micro-PIV measurements, fluorescein can be used to investigate acoustic streaming. A summary of the acoustic behavior of the different particles used in this study, and some other bodies that are common in microfluidic applications, is given in Table 2.
The speed of sound in water has a significant dependence on temperature given by the large derivative m s*-1K-1*. All tracer fluids were therefore kept at room temperature, so that the temperature was not changed when the microchip was flushed during tracer particle exchange. The microchips used in this study are comparable in size and mode of actuation to those used for ultrasonic agitation in a study by Bengtsson and Laurell Bengtsson2004 . They performed sensitive temperature measurements on the reactor outlet, where no temperature increase caused by the acoustic power could be detected. In our study, the piezo-actuator was run at a moderate power-level and only for the short intervals during recordings (typically less than one second). Therefore, it can be ruled out that heating from the piezo-actuator would have any measurable impact on the measurements.
One important factor, which needs to be accounted for when applying micro-PIV on systems affected by acoustic forces, is that the local seeding density will be distorted during actuation. This is normally not a problem when measuring on particle motion caused solely by acoustic streaming, as this motion generally will be of a circulating nature. On the other hand, in the case of particle motion induced by acoustic radiation forces, it will typically lead to total expulsion of particles from certain regions into others. If PIV-vector statistics is applied, only the first few image-pairs recorded after piezo-actuation has been initiated can be used, and in this study, images from a number of consecutively recorded sets have been used for averaging. Moreover, in the case of scanning, or mapping, techniques the expulsion of particles is especially problematic, as the seeding conditions in the device, or chamber, need to be restored for each measurement position. Also, the conditions may change during these lengthy recordings, leading to results that are difficult to interpret.
The acoustic resonances in low attenuation piezo-actuated microfluidic devices are formed over the whole devices, and they are also depending on the geometry of the whole device. As a consequence, there will typically be amplitude fluctuations over the devices, due to unwanted artifacts, or deliberate designs. Therefore, when investigating acoustic resonances, and the influence caused by different modifications to the sample, it is important to study the effects globally. If the acoustic effects are only measured in a part of the device, this kind of information will not be yielded, independently on how detailed the flow is mapped within that region. Therefore, we suggest full-image micro-PIV for the investigation of acoustic resonances in microfluidic devices.
In this study, emphasis has been put on how to present the measured data in such a way that still images and PIV-vector plots give the best illustration of the transient particle motion caused by the acoustic forces. To achieve this, we have chosen to superimpose the PIV-vector plots of the initial transient velocities on top of the pictures of the steady-state patterns of the particles obtained after a few seconds of actuation. After longer actuation times, secondary patterns will form, so images taken at this point can give a false impression of the particle motion. This method of combining the transient PIV-vector plots and steady-state pictures has shown useful when comparing numerical simulations with micro-PIV measurements, especially for measuring amplitude fluctuations across the structures, and when discriminating between different numerical models. This will be demonstrated in Sec. IV.
III Numerical simulations
In the experiments, the acoustic pressure field, which is superimposed on the ambient constant pressure, is driven by a harmonically oscillating piezo-actuator, i.e., the time-dependence can be described as . In this work, we focus on the acoustic resonances where the response of the bead solution is particularly strong. As the attenuation of the acoustic waves is relatively small, we can approximate the actual frequency-broadened acoustic resonances of the driven system by the infinitely sharp eigenmodes of the isolated dissipationless chip.
The pressure eigenmodes , labelled by an integer index , and the angular eigenfrequencies or resonance frequencies are found as solutions to the Helmholtz eigenvalue equation , where the index is referring to the three material domains of silicon, water and glass in the chip. The boundary conditions at the outer edges of the system are given by the soft-wall condition except at the bottom plane, where a hard-wall condition is chosen to mimic the piezo-actuator which fixes the velocity of the wall. At the internal interfaces between the different material regions the boundary conditions are continuity of the pressure as well as of the wall-velocity. The latter is ensured by continuity of the field . A list of the acoustic material parameters, i.e., sound velocities and densities , is given in Table 3.
The Helmholtz equation was solved numerically using the COMSOL finite element method software. However, the large aspect ratio of the flat device made it impossible to simulate the actual device in 3D due to limited computer memory. We therefore investigated the possibility of making 2D simulations. The rationale for doing this is that the total height of the chip is only 1 mm. Given a weighted average speed of sound in the silicon-glass chip of m/s, the wavelength of a wave at the highest used frequency MHz is 3 mm and thus three times the chip height. Similarly, at the same frequency the wavelength in water is 0.6 mm or three times the chamber height. Consequently, there is not room enough for even half a standing wave in the vertical direction neither in the water filled chamber nor in the silicon-glass chip.
The first step towards a more rigorous justification for doing 2D simulations was to make a smaller 3D version of the system geometry. While keeping all the correct height measures as well as the chamber width as listed in Table 1, we shrunk the planar dimensions of the surrounding chip to mm, mm and mm. With this reduced geometry we could carry out the full 3D simulations, and the results thereof confirmed that the variations in the vertical -direction of the 3D eigenmodes were modest, see the -plane plots of Figs. 2(a) and (b). A 2D simulation was then carried out for the horizontal center-plane of the chamber, i.e., a 2D water-filled area surrounded by a 2D silicon region. Comparing the 50 lowest 3D and 2D eigenmodes gave the following results: (1) in the horizontal center-plane of the chamber the 3D eigenmodes agreed with the 2D eigenmodes, see Figs. 2(c–f); (2) due to the lack of the -dependence in the Laplacian of the 2D Helmholtz equation, the 2D eigenfrequencies were systematically smaller than the 3D eigenfrequencies, see Fig. 2(g). It has thus been justified to simulate the experimentally observed resonances by 2D eigenmodes in the horizontal center-plane of the chamber. This we denote the 2D chip model.
Due to the small acoustic impedance ratio between silicon and water, the simulations could be simplified even further. As demonstrated in Figs. 3(c) and (d), it suffices to find the eigenmodes of the chamber itself using hard-wall boundary conditions along its edges, except at the very ends of the inlet channels where soft-wall boundary conditions are employed to mimic in- and outlets. This we will refer to as the 2D chamber model.
IV Results and discussion
We have measured the flow response to the acoustic actuation in the frequency range from 0.5 to 2.5 MHz paying special attention to the strong responses corresponding to acoustic resonances. More than 30 of such resonances have been detected, but we present only a few, which we find to be representative for the method and the problems associated with acoustics in microfluidics.
The most important results are the full-image micro-PIV analyses. For these, two types of experimental results are presented. One type are the PIV-vector plots (white arrows) of the motion of the tracer particles, in most cases corresponding to the transient motion immediately after the onset of the acoustic piezo-actuation. The other type are micrographs of the microfluidic chamber with the steady-state particle patterns (often visible as narrow black bands) obtained after a few seconds of actuation. These two types of images are superimposed to illustrate the relation between the initial motion of the tracer beads and their final steady-state positions.
The full-image micro-PIV analysis illustrations are also accompanied by the results of our numerical simulations in the form of gray-scale plots of the pressure eigenmodes . The pressure antinodes appear as white (positive amplitude) and black (negative amplitude) regions. The pressure nodal lines are shown as thin black lines in the gray (small amplitude) regions.
Additionally, we show a close up measurement of a streaming vortex, and provide a more in-depth comparison between the measured velocities and the calculated body force.
IV.1 Acoustic radiation force
We first show results for the acoustic resonances at 1.936 and 2.417 MHz in the circular chamber containing large 5 m tracer particles.
In Figs. 3(a) and (b) are shown the measured transient PIV-vector plots superimposed on the micrographs of the chamber with the static steady-state particle patterns. The fact that the particles accumulate in static patterns indicates that the dominant force on the tracer particles is the acoustic radiation force, an observation also expected from the relatively large size of the tracer particles. The matching numerically calculated acoustic eigenmodes of the 2D chamber model are shown in panels (c) and (d). It is noteworthy that even for the complicated resonance pattern of panels (b) and (d), the observed transient particle motion towards the steady-state positions, and the static steady-state patterns themselves, are in good agreement with the numerically calculated pressure nodal lines. This demonstrates that even the simple 2D chamber model can predict what kind of fluidic behavior will be observed in the device. It also demonstrates that full-image micro-PIV analysis in combination with images of transient particle motion is effective in visualizing in-plane acoustic phenomena in micrometer-scale devices.
IV.2 Acoustic streaming
To illustrate the difference between the acoustic radiation force and acoustic streaming, we now turn to the acoustic resonance at 2.17 MHz in the square chamber containing large 5 m beads and small 1 m beads as shown in Figs. 4(a) and (b), respectively.
When micro-PIV is applied to investigate acoustic effects in microfluidic chambers, the simultaneous presence of both acoustic radiation forces and acoustic streaming needs to be taken into account. For the large beads in Fig. 4(a) the acoustic radiation force dominates exactly as in Figs. 3(a) and (b), which results in particle accumulation at the pressure nodal lines. However, as shown in Fig. 4(b) reduction of the particle volume by a factor of 125 leads to a qualitative change in the response. The motion of the smaller particles is dominated by the acoustic streaming of the water, and it manifests itself as a 66 pattern of vortices. The same 66 pattern was found by full-image micro-PIV when diluted milk was used as tracer solution, and also by optical inspection with a fluorescein solution in the chamber (data not shown). All three experimental results strongly support the interpretation that the 66 vortex pattern is caused by acoustic streaming.
In Fig. 4(b) is also seen a pronounced inhomogeneity in the strength of the vortices across the microfluidic chamber. This effect cannot be ascribed to the geometry of the chamber, but is probably due to either a geometric top-bottom asymmetry in the entire chip (similar to the left-right asymmetry discussed in Sec. IV.3), or to an inhomogeneous coupling between the piezo-actuator and the silicon chip. If the frequency is shifted slightly in the vicinity of 2.17 MHz, the same vortex pattern will still be visible, but the strength distribution between the vortices will be altered. When investigating acoustic phenomena the advantage of full-image micro-PIV compared to partial-image micro-PIV is thus evident: partial-image micro-PIV employed locally in a part of the chamber would not have shown the symmetrical 66 vortex pattern, nor would it supply us with information of the inhomogeneity in strength for the same. Moreover, since the same inhomogeneity is not seen in the acoustic radiation force vector plot, this example shows that there is no direct relation between the strength of the acoustic streaming and the acoustic radiation force.
Finally, we note that our measurements show that the acoustic radiation force on the large particles leads to a much larger particle velocity than the acoustic streaming velocities of the smaller particles.
Turning to the numerical simulation in the 2D chamber model of the corresponding pressure eigenmode, shown in Fig. 4(c), we find good agreement with the experimental results. The calculated pressure nodal lines correspond well to the static steady-state particle patterns obtained with the large tracer particles dominated by the acoustic radiation force. Moreover, the calculated 33 antinode pattern is also consistent with the observed period-doubled 66 vortex pattern of the small tracer particles dominated by acoustic streaming. The spatial period-doubling arises from the non-zero time-average of the non-linear term in the Navier–Stokes equation governing the attenuated acoustic flows leading to acoustic streaming Lighthill .
IV.3 Effects of geometric asymmetries
For the results presented so far the simple 2D chamber model proved sufficient to interpret the experimental observations. However, as explained already in Sec. III the pressure eigenmodes are not confined to the chamber region but fill the entire chip. The acoustic resonances even propagate in all media (air and piezo-actuator) in contact with the chip. In the following we show one example of asymmetric resonance patterns that can only be explained by employing the more complete 2D chip model or by introducing asymmetries in the 2D chamber model.
In Figs. 5(a) and (b) we consider the square chamber containing the large 5 m beads at two nearby resonance frequencies, 2.06 and 2.08 MHz. As before, the acoustic radiation force dominates and the beads accumulate at the pressure nodal lines. Note that the two patterns are similar, but that the first has a higher amplitude on the left side, while the second has a higher amplitude on the right side. Both resonance patterns are similar to the acoustic pressure eigenmode shown in Fig. 5(c), which is found by numerical simulation using the 2D chamber model. However, since the chamber itself is left-right symmetric, the calculated eigenmode is also left-right symmetric, so to explain the observed asymmetry we have to break the left-right symmetry in the theoretical model. We investigate two ways of doing this: first, in the 2D chip model by placing a symmetric chamber asymmetrically on the chip, and second, in the 2D chamber model by letting the inlet channel have a different length than the outlet channel.
In Figs. 6(a-d) is shown the result of a numerical simulation in the 2D chip model where the left-right symmetry has been broken by displacing the chamber 1 mm left of the symmetry center of the chip. This displacement corresponds to the geometry of the actual chip used in the experiment. Panels (a) and (b) show the entire chip while panels (c) and (d) are the corresponding closeups of the chamber region. With this left-right asymmetric geometry, we do find asymmetric solutions at nearby frequencies that resemble the measured patterns: Figs. 6(c) and (d) correspond to Figs. 5(a) and (b), respectively. In the left-right symmetric case the left-right acoustic resonance is two-fold degenerate, i.e., two different resonances have the same frequency. When the symmetry is broken the two resonances are affected differently: one gets a slightly higher eigenfrequency and the other a slightly lower, i.e., a splitting of the two-fold degenerate eigenfrequency into two non-degenerate nearly identical eigenfrequencies. The two closely spaced eigenmodes of the asymmetric 2D chamber model shown in Figs. 6(e) and (f) also resemble the measured patterns in Figs. 5(a) and (b). The calculated frequency splitting is 28 kHz, which is in fair agreement with the measured 20 kHz.
Unquestionably, advanced models, like the chip model, are necessary for more complete theoretical investigations of how different factors contribute to the breaking of the symmetry of the simple chamber model. Experimentally this effect could be studied by measuring on a range of devices, with strictly controlled geometries of both structures and substrates. We have only investigated two devices, and special concern was not taken as to the uniformity of the substrate. It is therefore not possible in the present study to determine whether the observed symmetry breaking was due to geometric asymmetries in the chip, in the chip-actuator coupling, or in other parts of the system (such as air-bubbles trapped at the fluidic inlet and outlet).
IV.4 Validation of method
Fig. 7 shows a micro-PIV vector plot of streaming motion in the center of the square chamber at 2.17 MHz, recorded with a 20x microscope objective. With this kind of recording, detailed information of a section of the device can be obtained, but it will not supply any information about the amplitude fluctuations over the device, nor does it reveal the 6x6 vortex pattern as seen in Fig. 4(b). Clearly, more detailed measurements of specific features are valuable, but for studies of resonances in low attenuation microfluidic devices, full-image recordings are of most importance.
By regarding the suspended particles as springs governed by Hooke’s law, we can estimate the acoustic radiation force , from the potential elastic energy. We find , where is a constant parameter for each kind of particles, and is the time-averaged second-order pressure field. As is an unknown positive constant for blood-cell like particles, the amplitude becomes a fitting parameter. Assuming the particles move in a quasi-stationary steady state, we can directly compare calculated force patterns to measured velocity patterns. Such a comparison is seen in Fig. 8, where the calculated force pattern is compared with a scalar map of the velocity in -direction, extruded from the measurement presented in Fig. 4(a). A comparison between the two is also seen in Fig. 9, where two vertical cross-sectional views, each located 330 m away from the center of the chamber, are compared with the theoretical estimate. Both micro-PIV velocity plots show a good agreement with the calculated forces, and the fluctuations in amplitude over the device can be seen by comparing the two micro-PIV velocity plots with each other.
V Conclusion
Using full-image micro-PIV we have made direct observations of the acoustic resonances in piezo-actuated, flat microfluidic chambers containing various tracer particles.
Depending on the size of the tracer particles either the acoustic radiation force or acoustic streaming of the solvent dominates their motion. Large particles are dominated by the acoustic radiation force that pushes them to the static pressure nodal lines, while small particles are dominated by acoustic streaming and end up forming steady-state vortex patterns. However, for an arbitrary frequency and geometry one of the forces can be strong whereas the other is not, and it is therefore always necessary to apply more than one tracer solution in order to determine which forces are present.
The observed acoustic resonances correspond to the pressure eigenmodes found by numerical simulation of 2D models of the system. The symmetric patterns can be explained by using the simple 2D chamber model, while asymmetric patterns can be explained by using the more complete 2D chip model taking into account the geometric asymmetries of the surrounding chip, or in special cases, by an asymmetric 2D chamber model.
We have demonstrated that full-image micro-PIV is a useful tool for complete characterization of the in-plane acoustically induced motion in piezo-actuated microfluidic chambers.
Acknowledgement
SMS was supported through Copenhagen Graduate School of Nanoscience and Nanotechnology, in a collaboration between Dantec Dynamics A/S, and MIC, Technical University of Denmark.
The reference list from the paper itself. Each links out to its DOI / PubMed record.
- 1(1) L.V. King, Proc. R. Soc. London, Ser. A , 1934, 147 , 212.
- 2(2) K. Yosioka and Y. Kawasima, Acustica , 1955, 5 , 167.
- 3(3) L.P. Gorkov, Sov. Phys. Doklady , 6 , 1962, 773.
- 4(4) Lord Rayleigh, Proc. R. Soc. London , 1883, 36 , 10.
- 5(5) N. Riley, Annu. Rev. Fluid Mech. , 2001, 33 , 43.
- 6(6) K. Yasuda, S. Umemura, and K. Takeda, Jpn. J. Appl. Phys., Part 1 , 1995, 34 , 2715.
- 7(7) K. Yasuda, K. Takeda, and S. Umemura, Jpn. J. Appl. Phys., Part 1 , 1996, 35 , 3295.
- 8(8) X. Zhu and E. S. Kim, Sens. Actuators, A , 1998, 66 , 355.