Metal-insulator transition in the low-dimensional organic conductor (TMTSF)2FSO3 probed by infrared microspectroscopy
A. Pashkin, K. Thirunavukkuarasu, Y.-L. Mathis, W. Kang, and C. A., Kuntscher

TL;DR
This study investigates the metal-insulator transition in the quasi-one-dimensional organic conductor (TMTSF)2FSO3 using infrared microspectroscopy, revealing an energy gap, structural modulations, and a novel infrared mode with unique temperature behavior.
Contribution
It provides new insights into the infrared response, structural changes, and a novel vibrational mode associated with the transition, supported by a proposed coupling model.
Findings
Energy gap of about 1500 cm-1 opens below transition
Long-range crystal structure modulation detected
A new infrared mode at around 710 cm-1 observed
Abstract
We present measurements of the infrared response of the quasi-one-dimensional organic conductor (TMTSF)2$SO3 along (E||a) and perpendicular (E||b') to the stacking axis as a function of temperature. Above the metal-insulator transition related to the anion ordering the optical conductivity spectra show a Drude-like response. Below the transition an energy gap of about 1500 cm-1 (185 meV) opens, leading to the corresponding charge transfer band in the optical conductivity spectra. The analysis of the infrared-active vibrations gives evidence for the long-range crystal structure modulation below the transition temperature and for the short-range order fluctuations of the lattice modulation above the transition temperature. Also we report about a new infrared mode at around 710 cm-1 with a peculiar temperature behavior, which has so far not been observed in any other (TMTSF)2X salt showing…
Click any figure to enlarge with its caption.
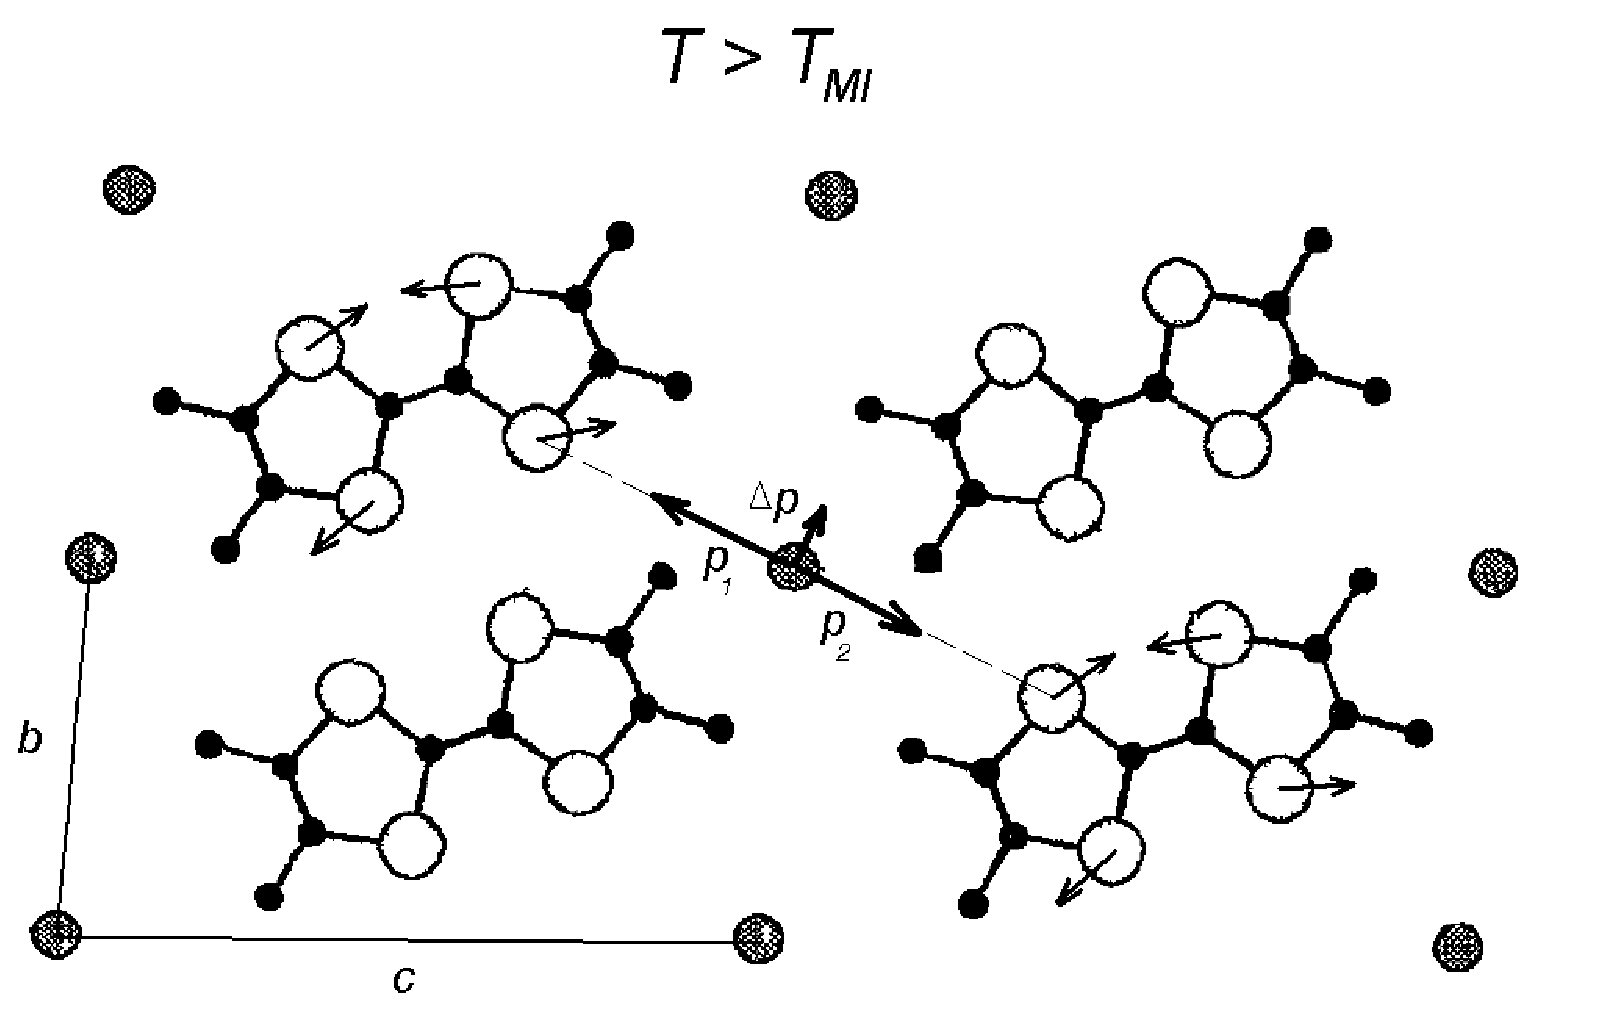 Figure 1
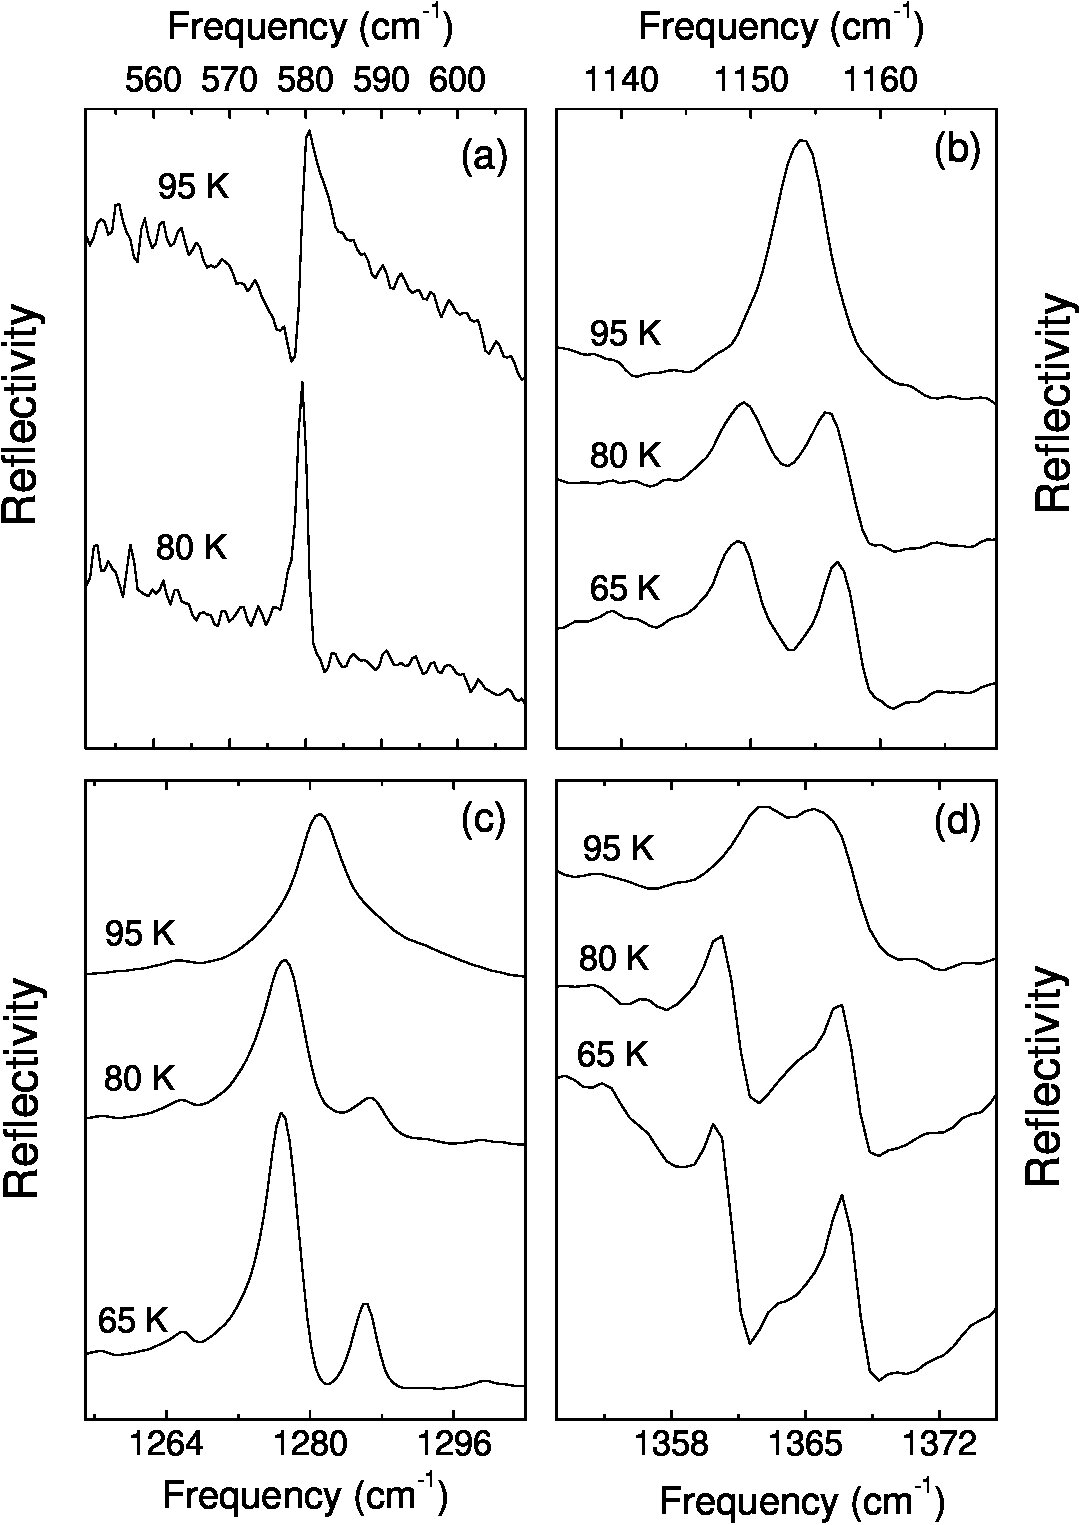 Figure 2
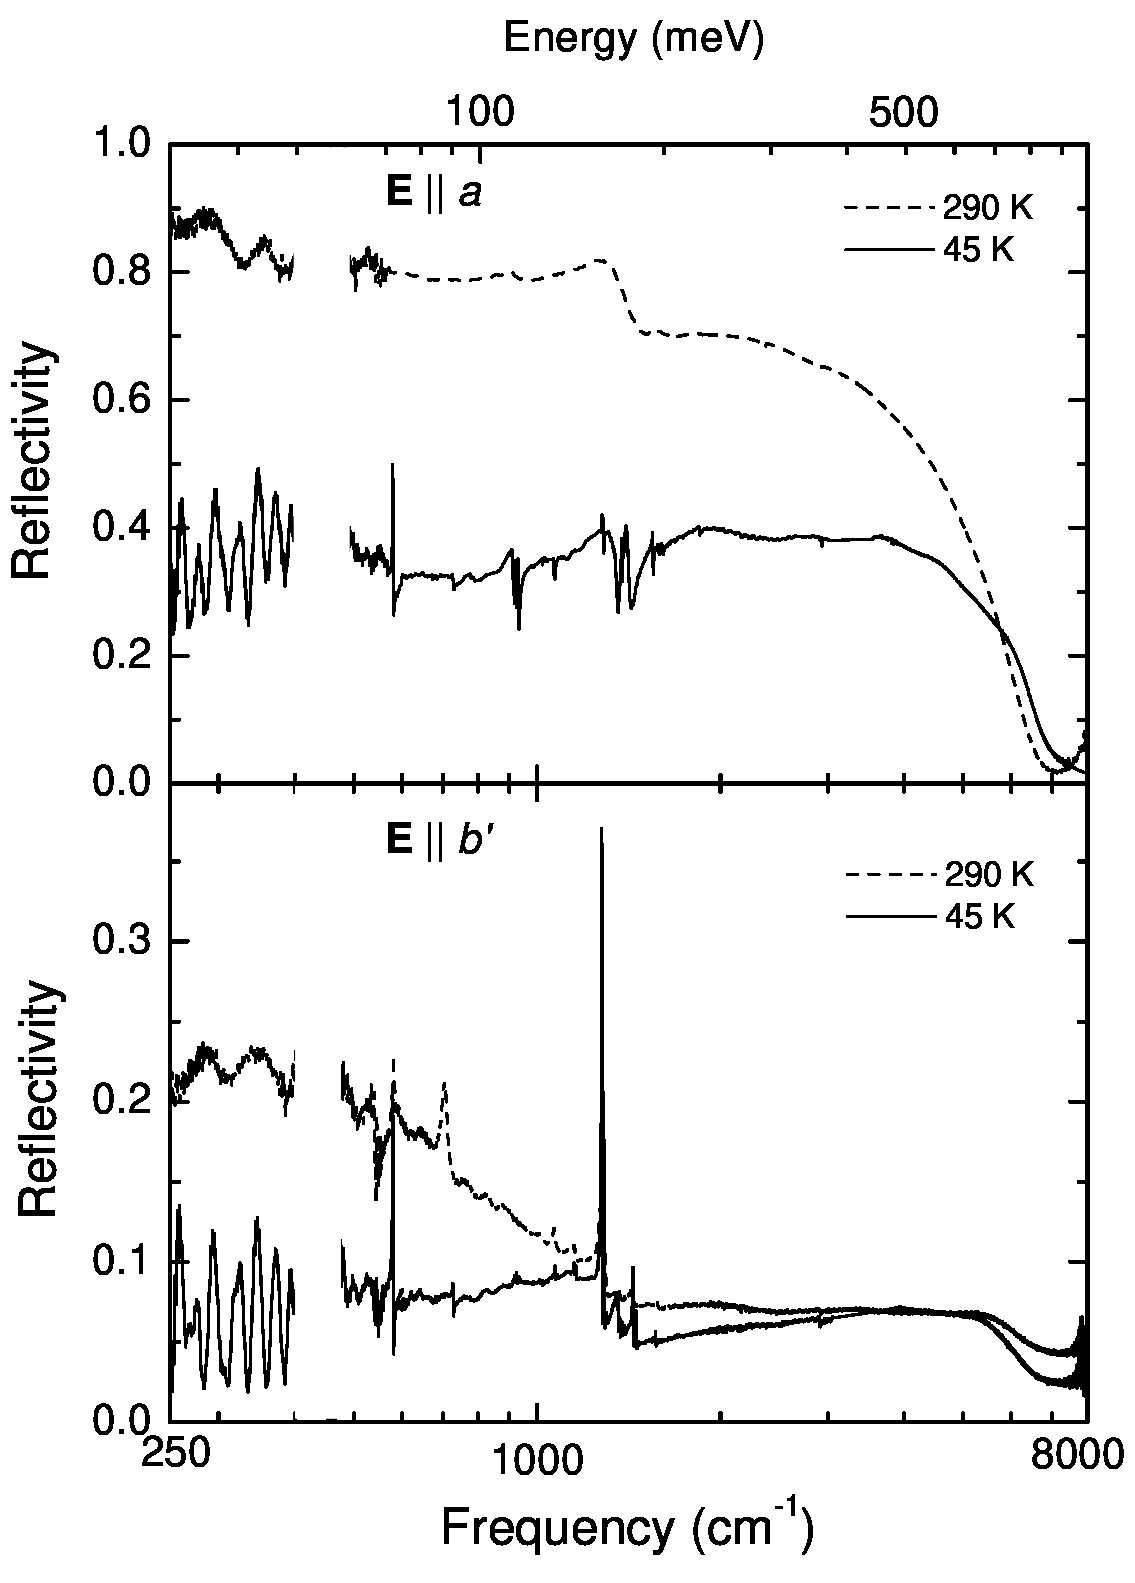 Figure 3
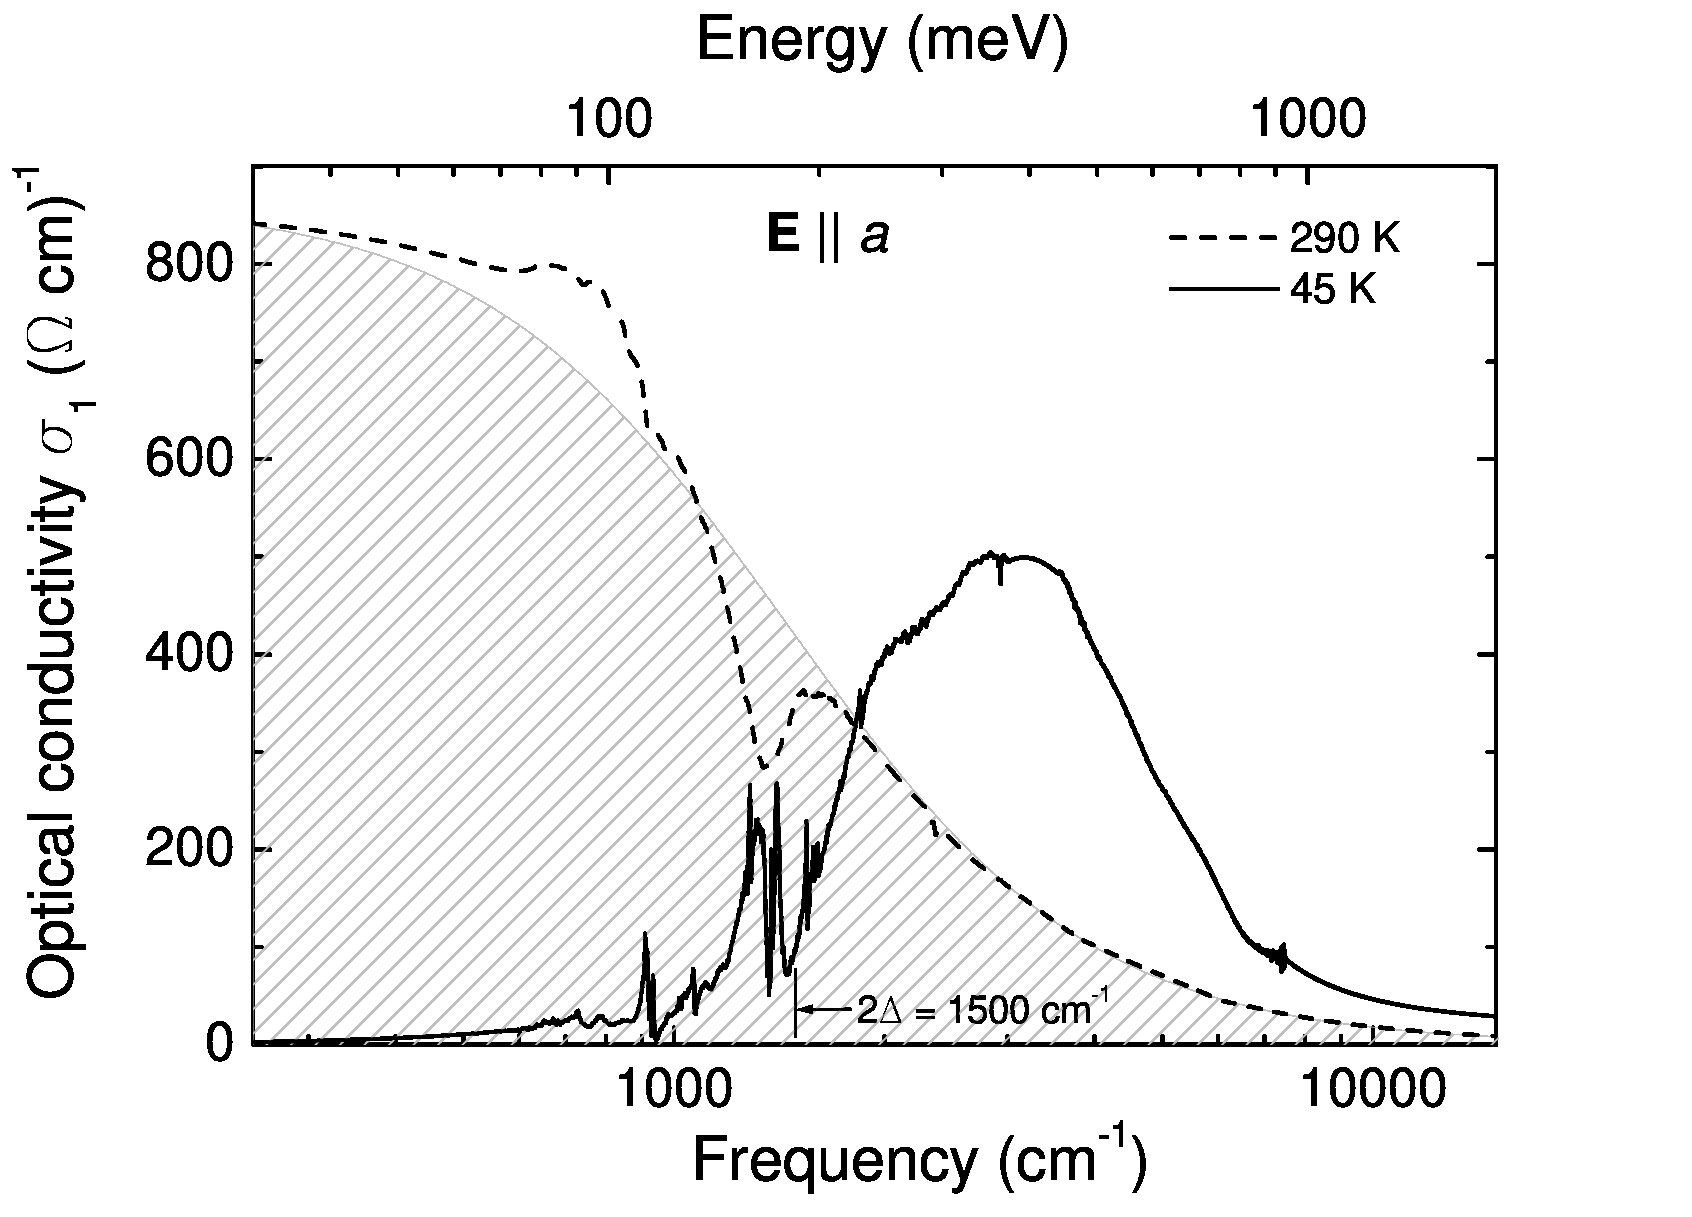 Figure 4
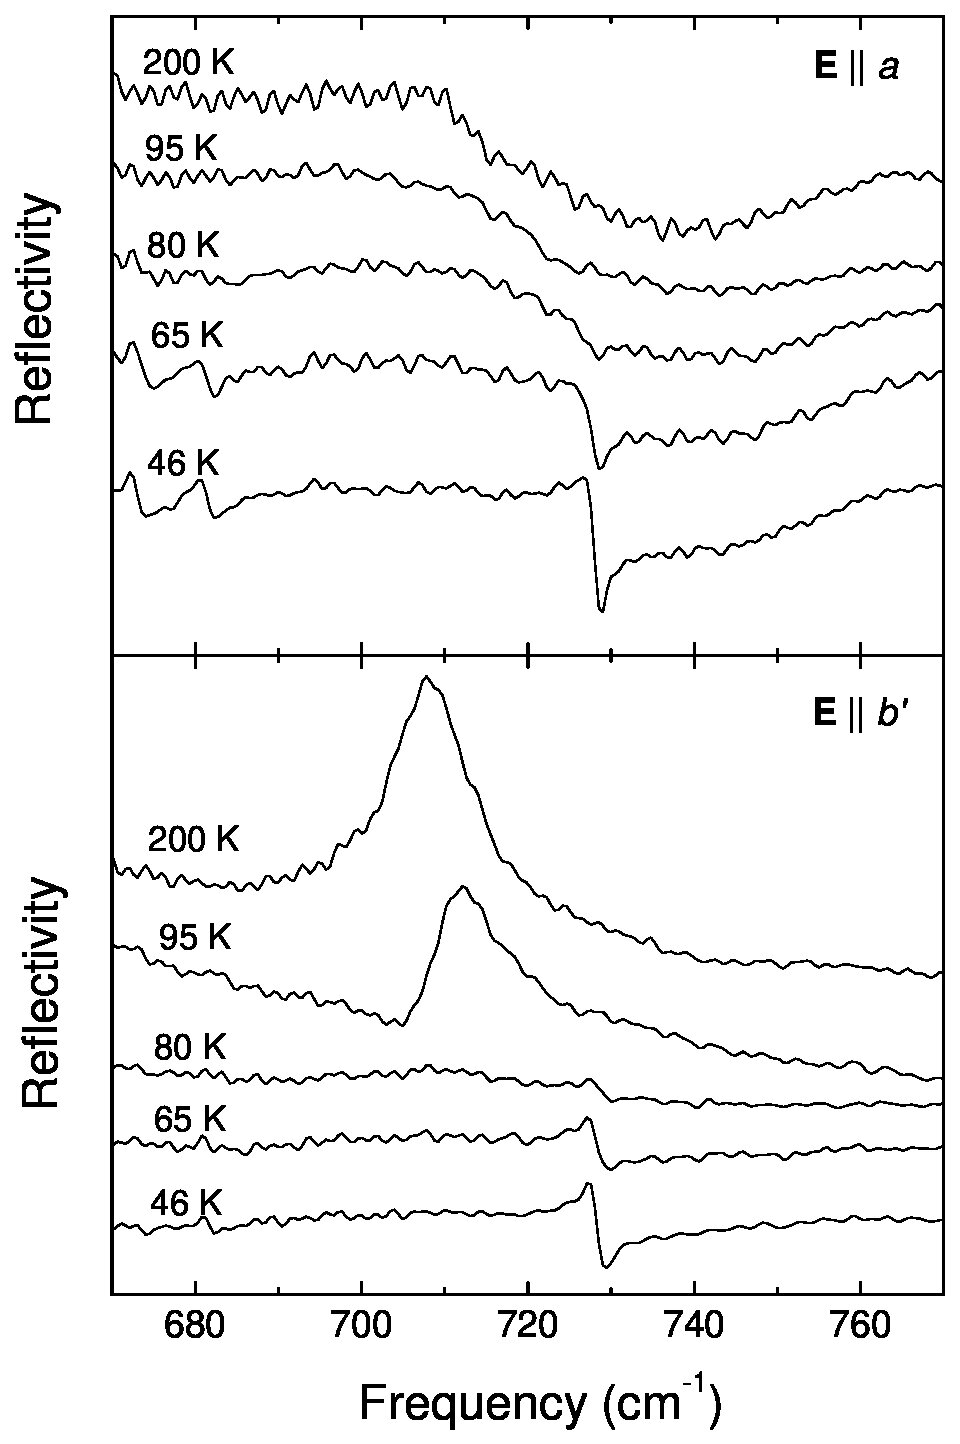 Figure 5
| 45 K | calculated frequency111for TMTSF0.5+ according to Meneghetti84 ; Homes90 , for FSO3 according to Nakamoto86b | assignment |
|---|---|---|
| 580 | 571 | FSO3 |
| 728 | 702 | |
| 902, 911, 915, | 916 | |
| 917, 924, 932 | ||
| 1020, 1031, 1036 | 1060 | |
| 1067, 1072 | 1060 | |
| 1362, 1450222strong antiresonance modes | 1469 | |
| 1354, 1364, 1369 | 1369 | |
| 1373, 1379, 1385 | ||
| 1550, 1584, 1606 | 1596 | |
| 1847, 1854, 1863 | 1863 |
| 95 K | 80 K | 45 K | assignment |
|---|---|---|---|
| 580 (1.3) | 580 (0.9) | 580 (0.8) | FSO3 |
| 710 (7.1) | 728 | 728 (2.0) | |
| 1154 (5.0) | 1150 (3.4) | 1150 (3.3) | |
| 1157 (3.8) | 1158 (2.5) | ||
| 1280 (5.1) | 1276 (4.2) | 1276 (2.1) | FSO3 |
| 1288 (16) | 1286 (4.4) | 1286 (1.7) | |
| 1363 (3.2) | 1361 (2.8) | 1361 (1.3) | |
| 1366 (4.3) | 1367 (2.4) | 1367 (1.8) |
Peer Reviews
No public reviews on file for this paper yet. If you reviewed it on a platform where reviews are public (OpenReview, ICLR, NeurIPS, ICML), you can paste yours below so the community can read it here.
Videos
No videos yet. Explain this paper in a talk, walkthrough, or lecture? Add one.
11institutetext: Experimentalphysik II, Universität Augsburg, 86159 Augsburg, Germany 22institutetext: Institute for Synchrotron Radiation, Forschungszentrum Karlsruhe, P.O. Box 3640, 76021 Karlsruhe, Germany 33institutetext: Department of Physics, Ewha Womans University, Seoul 120-750, Korea
Metal-insulator transition in the low-dimensional organic conductor (TMTSF)2FSO3 probed by infrared microspectroscopy
A. Pashkin email: [email protected]
K. Thirunavukkuarasu 11
Y.-L. Mathis 22
W. Kang 33
C. A. Kuntscher email: [email protected]
(Received: )
Abstract
We present measurements of the infrared response of the quasi-one-dimensional organic conductor (TMTSF)2FSO3 along (E) and perpendicular (E) to the stacking axis as a function of temperature. Above the metal-insulator transition related to the anion ordering the optical conductivity spectra show a Drude-like response. Below the transition an energy gap of about 1500 (185 meV) opens, leading to the corresponding charge transfer band in the optical conductivity spectra. The analysis of the infrared-active vibrations gives evidence for the long-range crystal structure modulation below the transition temperature and for the short-range order fluctuations of the lattice modulation above the transition temperature. Also we report about a new infrared mode at around 710 with a peculiar temperature behavior, which has so far not been observed in any other (TMTSF) salt showing a metal-insulator transition. A qualitative model based on the coupling between the TMTSF molecule vibration and the reorientation of electrical dipole moment of the FSO3 anion is proposed, in order to explain the anomalous behavior of the new mode.
pacs:
71.30.+hMetal-insulator transitions and other electronic transitions and 74.70.KnOrganic superconductors
1 Introduction
The organic Bechgaard salts (TMTSF) consist of stacks of planar TMTSF (tetramethyltetraselenafulvalene) molecules separated by anions ( = PF6, AsF6, ClO4, Br, etc.). The charge transport in these systems is restricted to the direction along the molecular stacks, making the Bechgaard salts prime examples of one-dimensional metals. However, on cooling down most of them undergo a metal-insulator transition which prevents the onset of a superconducting state Ishiguro98 . In Bechgaard salts with noncentrosymmetric anions such as ReO4, BF4 or FSO3 the metal-insulator transition is related to the anion ordering Pouget96 . It was furthermore demonstrated that in some cases the metal-insulator transition can be suppressed by the application of external pressure, leading to a superconducting ground state Jerome04 .
The case of the anions =FSO3 in this class of materials is particularly interesting, since these anions are noncentrosymmetric and in addition possess a permanent electrical dipole moment. The first study of the basic properties of has been reported by Wudl et al. in 1982 Wudl82 . Further studies have shown that this compound has the highest superconducting transition temperature (2.5 K at 8.5 kbar) among the Bechgaard salts. It was proposed that this is due to the interaction of the conducting electrons with the FSO3 anion dipoles Lacoe83 . A recent detailed study Jo03 revealed a very rich pressure-temperature phase diagram of with a variety of different phases, which have not been completely identified up to now. Furthermore, by magnetoresistance measurements a two-dimensional electronic behavior was found in under a pressure of around 6.2 kbar Kang03 .
The interaction of the FSO3 anions with each other via long-range Coulomb forces and with the centrosymmetric surrounding formed by the TMTSF cations tends to order the anions below a certain temperature. The first-order structural phase transition related to this anion ordering occurs at around =89 K in at ambient pressure. The change of the crystal structure modifies the electronic band structure: The effective half-filled conducting band splits into one filled and one empty band separated by an energy gap, leading to a sharp metal-insulator transition Lacoe83 . The structural analysis suggested a modulation of the crystal structure with wavevector q = (1/2, 1/2, 1/2) below the phase transition, which implies an antiferroelectric state Moret83 ; Pouget96 . The ordering of the FSO3 anions modulates the lattice resulting in a new unit cell of size . Thus, there are eight formula units of per unit cell in the low temperature phase. Correspondingly, one can expect a splitting of each vibrational mode into up to eight components Homes89 .
The ratio of the energy gap to the transition temperature in is Wudl82 , which is appreciably higher than the value 3.5 predicted by the mean-field theory for the Peierls transition. Therefore, the metal-insulator in the Bechgaard salts with non-centrosymmetric anions was attributed to a special type of Peierls instability which originates from the anion-electron coupling Jacobsen82 .
In this work we present the results of a temperature-dependent polarized infrared reflectivity study of single crystals in the far- and mid-infrared frequency range, in order to characterize the change of electronic and vibrational properties during the metal-insulator transition at =89 K. This is the first infrared spectroscopic investigation of the compound . Our results allow a direct determination of the charge gap in the insulating state. Furthermore, we determined and analyzed the behavior of the vibrational modes during the metal-insulator transition, which can clarify details of the dipolar ordering.
2 Experimental
single crystals were grown by standard electrochemical techniques from TMTSF molecules and tetrabutylammonium-FSO3. The studied samples have a needle-like shape, with a size of approximately mm3. The samples were mounted on a cold-finger CryoVac Konti-Mikro cryostat. The actual measuring temperature was controlled by a sensor attached in direct vicinity of the sample. The measurements were performed at the infrared beamline of the synchrotron radiation source ANKA. The polarized infrared reflectivity was measured in the range 150
- 10000 using a Bruker IRscope II microscope attached to a IFS66v/S spectrometer. The frequency resolution was 1 for all measured spectra. Optically transparent TPX and KBr cryostat windows were used for the measurements in the far- and mid-infrared frequency range, respectively.
3 Results and discussion
3.1 Electronic properties
The reflectivity spectra of above and below the metal-insulator transition temperature of 89 K for both polarizations E and E (along and perpendicular to the stacking axis, respectively) are shown in Fig. 1. The reflectivity data in the spectral region at around 450 are affected by the absorption features of the far-infrared TPX cryostat window and are therefore not shown.
At 290 K the reflectivity of the sample along the stacking axis E demonstrates a typical Drude behavior (growth up to 1 when frequency tends to zero). In contrast, at 45 K , i.e., below , the reflectivity is almost frequency independent below 1000 , which is typical for an insulating state.
The interference fringes observed below 400 in the spectra for both polarizations are due to the partial transparency of the sample in the insulating phase. Perpendicular to the stacking axis (E), the optical reflectivity and conductivity is much lower than along the axis. Nevertheless, the observed changes during the metal-insulator transition are similar to those of the E direction. These results demonstrate the opening of an energy gap at the Fermi level for both studied directions.
The dramatic effect of the temperature decrease on the electronic properties of are more directly seen in the optical conductivity spectra. The E optical conductivity of in the insulating (at 45 K) and conducting phase (at 290 K) obtained by means of Kramers-Kronig analysis is shown in Fig. 2. The dominating feature of the spectrum at 45 K is a strong charge transfer band due to electronic transitions across the gap. The arrow shows the band gap (1500 ) obtained from the published temperature-dependent dc resistivity measurements Wudl82 . Obviously, the agreement of this value with the onset of the optical interband transition is very good. On the other hand, the optical conductivity at room temperature is mostly dominated by the Drude response of the free carriers. The corresponding fit using the Drude model is shown as the hatched area in Fig. 2. Obviously, the Drude model provides a good description of the measured room-temperature spectrum excluding the electron-molecular vibration (emv) antiresonance modes. The plasma frequency cm*-1* and the scattering rate cm*-1* obtained from the fit agree well with the Drude model parameters reported for other TMTSF salts Jacobsen83 . The obtained value of the dc conductivity, , is in reasonable agreement with the dc and microwave conductivity values of 1600 and 300 , respectively, reported by Wudl et al. Wudl82 .
3.2 Vibrational modes
The TMTSF molecule with the point group symmetry has in total 72 local vibrational modes classified according to the following representations Meneghetti84
[TABLE]
where the vibrations in the first brackets are polarized in the molecular plane (perpendicular to the stacking axis) and the vibrations in the second brackets are polarized out of the plane (along the stacking axis ). The symmetric (gerade) vibrations are Raman active and the asymmetric (ungerade) vibrations are infrared active excluding the silent modes. Some of the totally symmetric Raman modes are expected to appear in the infrared spectra for E due to efficient emv coupling in the modulated stacking structure Jacobsen83 ; Homes90 .
The tetrahedral FSO3 anion has point group symmetry which gives in total nine vibrational modes
[TABLE]
where species correspond to the doublets. Thus, in the infrared spectra one expects six modes, with the and modes being polarized along and perpendicular to the polar axis of the anion, respectively.
In this section we want to concentrate on the changes in the infrared phonon spectra for both polarizations across the metal-insulator transition. For E several vibrations of the TMTSF molecules become infrared active in the insulating phase. This is due to the effective emv coupling of these vibrations to the on-chain charge transfer band in the structure modulated due to the anion ordering. The list of the new modes observed below the transition together with their tentative assignment is given in Table 1. Most of them are emv coupled modes polarized in the molecular plane or their combination as a triplet at around 1850 . The mode involving the central C=C bond stretching is known to have especially strong emv coupling and therefore it appears as a strong antiresonance mode in the optical conductivity spectrum. It should be pointed out that the observed appearance of modes for E in the ordered phase is typical only for (TMTSF) compounds with non-centrosymmetric anions. In comparison, (TMTTF) salts possess a stronger stack dimerization, resulting in the emv coupling of the modes already in the disordered phase, and therefore the anion ordering transition causes only a frequency shift and an intensity change of the emv coupled modes Garrigou84 .
The vibrational mode of the FSO3 anion at 580 is observed for the whole studied temperature range. However, the lineshape of this mode in the metallic phase above is inverted with respect to the insulating phase [see Fig. 3(a)], since the background dielectric constant is negative as expected for highly conducting metals at low frequencies. Such a change is a clear evidence for the suppression of the Drude conductivity in the insulating phase of .
The mode at 728 observed for temperatures below is particularly interesting, since its intensity gradually increases on temperature decrease (see Fig. 4). A similar behavior is found for the polarization perpendicular to the stacks, E. Moreover, above the transition temperature a strong asymmetric mode is seen at 710 . This mode shifts to lower frequencies and gets stronger with increasing temperature. This mode has not been observed in any other earlier study of the Bechgaard salts. Therefore, it would be natural to assign it to a vibration of FSO3 anion. However, such an assignment would be in contradiction to the experimental observations, since: (i) the and vibrations of FSO3 located close to the observed mode have frequencies which are by more than 100 higher or lower Nakamoto86b ; (ii) the intensity of the anion vibration should not vanish at the order-disorder transition point. Thus, one has to attribute the modes at around 710 and 728 to vibrations of the TMTSF molecules. We suggest that both modes originate from the in-plane vibration of the TMTSF molecule. According to the normal-coordinate analysis Meneghetti84 ; Eldridge91 its frequency for a free TMTSF0.5+ cation is 702 .
The corresponding atomic movements involve stretching of the Se-C side bond and rocking of the adjacent methyl group. For the vibration the inversion symmetry of the molecule is not preserved, causing its infrared-activity for the polarization perpendicular to the stacks. However, it is known that in (TMTSF) salts the dipole moment corresponding to the vibration is very small, and therefore this mode can hardly be detected even for E where it should have the strongest intensity Eldridge91 . Nevertheless, in this mode is particularly strong even at room temperature. This finding can be explained by the electrical dipole of the FSO3 anion pointing towards the Se-F bond. Similar to other non-centrosymmetric anions (ReO4, ClO4 etc.) the FSO3 anion has two possible symmetrically equivalent orientations for which the dipole moment points towards the Se atoms of the neighboring TMTSF molecules. This situation is sketched in Fig. 5, where p1 and p2 are two possible orientations of the FSO3 electrical dipole moment. During the vibration the dipole moment of the anion follows the position of the Se atom. Due to the symmetry properties of the vibration the nearest Se atoms on both sides of the anion move in the same direction. Thus, for both possible orientations of the dipole the vibration results in a change of the average polarization along the direction of p (Fig. 5).
The described coupling mechanism between the vibration and the dipole moment of the anion in should lead to a strong enhancement of the infrared strength of the vibration for E, since p has the largest projection along this direction. On the other hand, p is perpendicular to the stacking axis and the mode should not appear for E. This is indeed observed in our experiment above the transition temperature. Below the transition the long-range order of the anion sublattice builds up. Then the anion dipole moment orientation is determined by the modulation of the whole lattice and it is not dependent on the movement of neighboring TMTSF molecules, i.e., the vibration is decoupled from the FSO3 anions. Therefore, its intensity should drop abruptly below , in agreement with our observations (see Fig. 4). Moreover, the observed decrease of the intensity of the coupled mode at around 710 at 95 K compared to higher temperatures can be explained by taking into account short-range order fluctuations above the transition, evidence for which is also given below. Indeed, in the large enough dynamical regions where the anions are ordered, the coupling is suppressed and therefore the strength of the should decrease.
On cooling down below a vibration appears again at somewhat higher frequency (728 ) for E and its strength gradually increases with decreasing temperature. We suggest that this is the same vibration described above. Since it is decoupled from the anion sublattice, its frequency is expected to increase abruptly below the transition. The increase in strength for both polarizations should be obviously related to the temperature dependence of the order parameter (i.e., the degree of lattice modulation). One of the possible mechanisms can be the emv coupling of the vibration to the charge transfer bands along and directions. However, the detailed picture of this emv coupling is not clear, since the symmetry of mode does not allow such kind of coupling. One can speculate that the electric field of the FSO3 dipoles in the ordered phase distorts the TMTSF molecules making them non-centrosymmetric. Then the emv coupling may become allowed for the mode.
Noticeable changes in the phonon mode spectra across the metal-insulator transition are observed for E. The list of the parameters of these modes at temperatures above and below is given in Table 2. An obvious splitting into two components is seen for the mode at 1154 [see Figure 3(b)]. In addition, the damping of the split components directly below is lower than the damping of the single component directly above the transition (see Table 2). This difference is probably related to the precursor short-range order fluctuations above the transition, which can induce a small splitting already in the disordered phase. An evidence for such fluctuations was found in x-ray diffuse scattering experiments Moret83 ; Pouget96 . This effect is even more clearly seen in the splitting of two other modes: the doublet vibration of the FSO3 anion at 1280 [Fig. 3(c)] and the mode at around 1365 [Fig. 3(d)]. For each of these modes above one can resolve two weakly split components. However, below the splitting abruptly increases and the damping decreases (see Table 2) indicating the onset of long-range order. Since the described effect is observed not only for the FSO3 anion vibration but also for two vibrations of the TMTSF cation, we can conclude that the short-range order fluctuations involve the modulation of the whole lattice and not only the anion sublattice.
4 Conclusion
We have performed an infrared spectroscopic study of the metal-insulator transition in . The obtained optical conductivity spectra for E show a Drude-like conductivity above the anion ordering temperature and a charge transfer band formed below the transition. The onset of this band is in agreement with the energy gap value of 1500 obtained from transport measurements Wudl82 .
The analysis of the infrared-active vibrations leads to the following conclusions: (i) the crystal structure modulation below the metal-insulator transition leads to a strong emv coupling of several vibrations which therefore become infrared-active; (ii) short-range order fluctuations of the FSO3 anions and the corresponding lattice modulation exist above the transition temperature, as it is seen from the splitting of some infrared-active modes for E; (iii) a new infrared-active mode located at around 710 with a peculiar temperature behavior is detected and assigned to the coupling between the TMTSF molecule vibration and the electrical dipole moment of the FSO3 anion. The latter feature has not been observed in any other (TMTSF) salt showing a metal-insulator transition. This points out the important role of the electrical dipole moment of the anion on the structural and dynamical properties of the salt.
5 Acknowledgements
We acknowledge the ANKA Angströmquelle Karlsruhe for the provision of beamtime and thank M. Süpfle, D. Moss, and B. Gasharova for technical assistance at the ANKA IR beamline. The financial support of the DFG (Emmy Noether-program) is acknowledged.
The reference list from the paper itself. Each links out to its DOI / PubMed record.
- 1(1) T. Ishiguro, K. Yamaji, G. Saito, Organic Superconductors (Springer, Berlin, 1998)
- 2(2) J.P. Pouget, S. Ravy, J. Phys. I France 6 , 1501 (1996)
- 3(3) D. Jerome, Chem. Rev. 104 , 5565 (2004)
- 4(4) F. Wudl, E. Aharon-Shalom, D. Nalewajek, J.V. Waszczak, J. W. M. Walsh, J. L. W. Rupp, P. Chaikin, R. Lacoe, M. Burns, T.O. Poehler et al., The Journal of Chemical Physics 76 (11), 5497 (1982)
- 5(5) R.C. Lacoe, S.A. Wolf, P.M. Chaikin, F. Wudl, E. Aharon-Shalom, Phys. Rev. B 27 (3), 1947 (1983)
- 6(6) Y.J. Jo, E.S. Choi, H. Kang, W. Kang, I.S. Seo, O.H. Chung, Phys. Rev. B 67 , 014516 (2003)
- 7(7) W. Kang, O.H. Chung, Y.J. Jo, H. Kang, I.S. Seo, Phys. Rev. B 68 , 073101 (2003)
- 8(8) R. Moret, J.P. Pouget, R. Comes, K. Bechgaard, J. Phys. Colloq. France 44 , 957 (1983)