A Comparison between Anomalous 6-cm H$_2$CO Absorption and CO(1-0) Emission in the L1204/S140
Monica Ivette Rodriguez, Tommy Wiklind, Ronald J. Allen, Vladimir, Escalante, and Laurent Loinard

TL;DR
This study compares the distribution of H2CO absorption and CO emission in the L1204/S140 region, revealing differences due to their distinct excitation conditions and susceptibilities to photodissociation, enhancing understanding of molecular cloud structures.
Contribution
It provides a detailed comparison of H2CO and CO distributions in a molecular cloud, highlighting how their differing properties affect their tracing of molecular gas.
Findings
H2CO absorption is offset from CO emission peaks.
H2CO is more easily photodissociated than CO.
CO traces warmer, denser regions more effectively.
Abstract
We report observations of the dust cloud L1204 with the Onsala 25-m telescope in the 6 cm (1) transition of \htco. The observed region includes the S140 H arc. This spectral line is seen here in absorption against the cosmic microwave background, indicating the presence of widespread warm molecular gas at intermediate densities. Overall, the distributions of HCO and CO (taken from the literature) are fairly similar, though significant differences exist at small scales. Most notably, while the CO peak is nearly coincident with the S140 H arc, the maximum HCO absorption is clearly separated from it by a full 10 beam ( 3 pc). We argue that these differences result from differing abundances and excitation requirements. The CO(1-0) line is more optically thick and more biased towards warm gas than the HCO 6 cm line. On the other hand,…
Click any figure to enlarge with its caption.
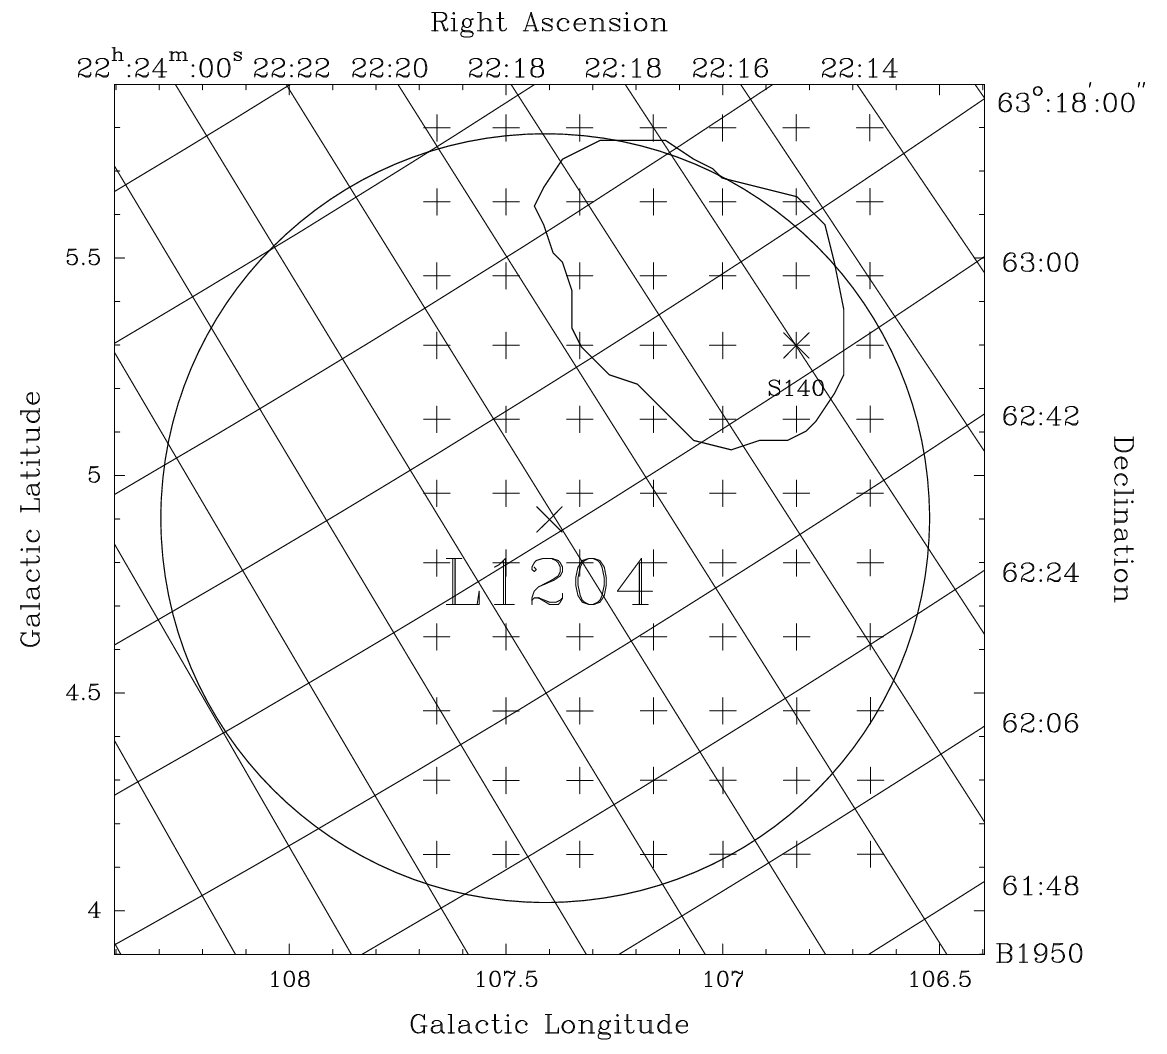 Figure 1
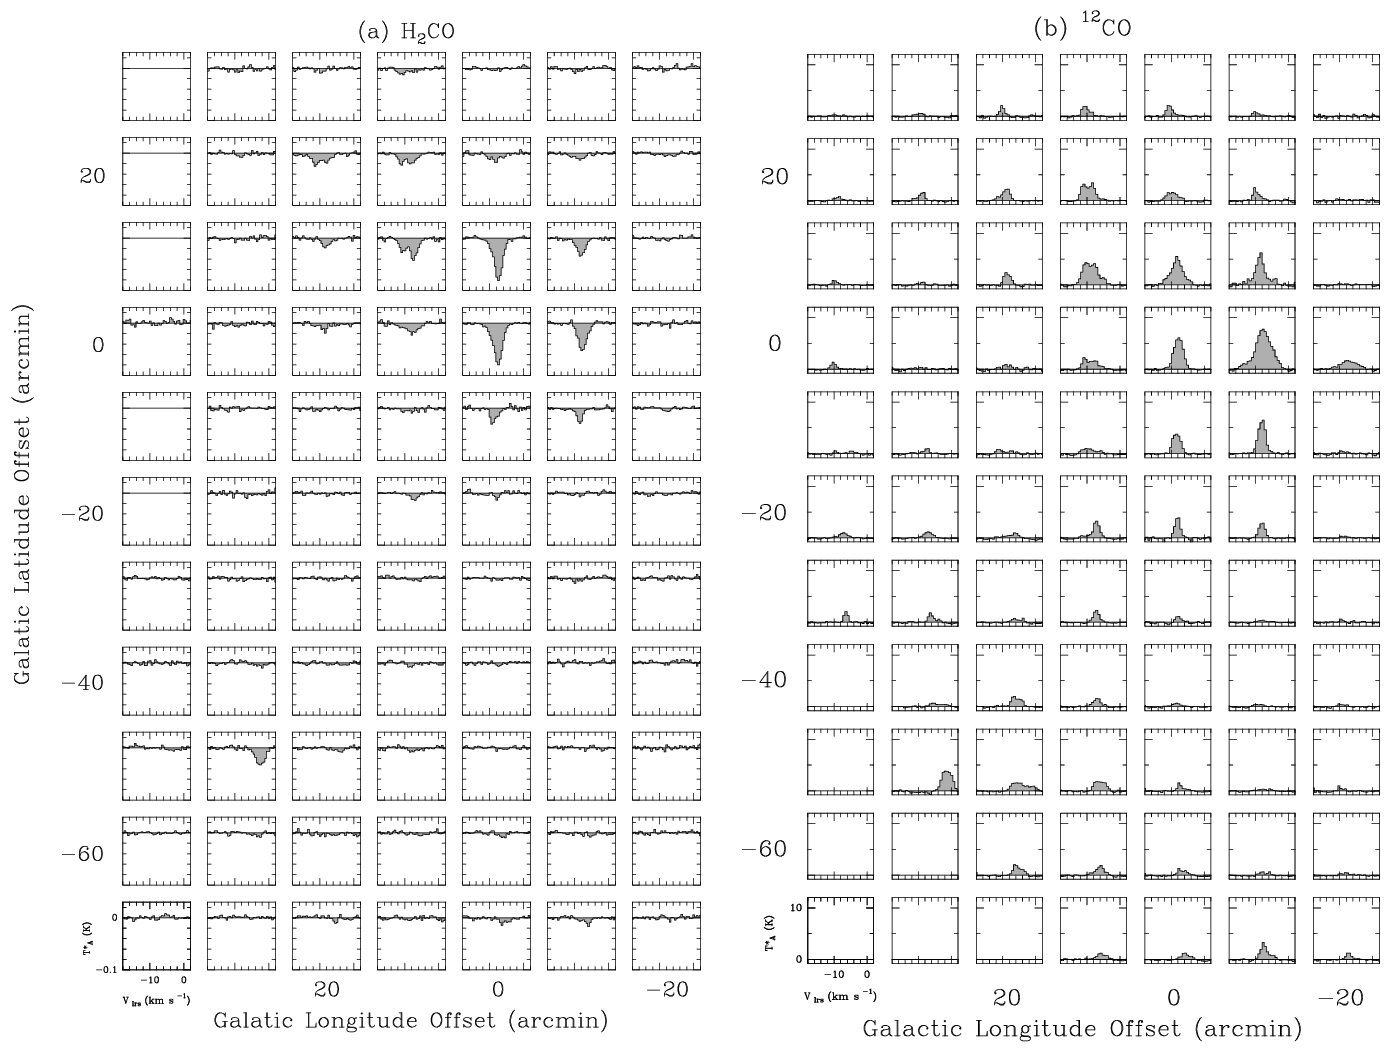 Figure 2
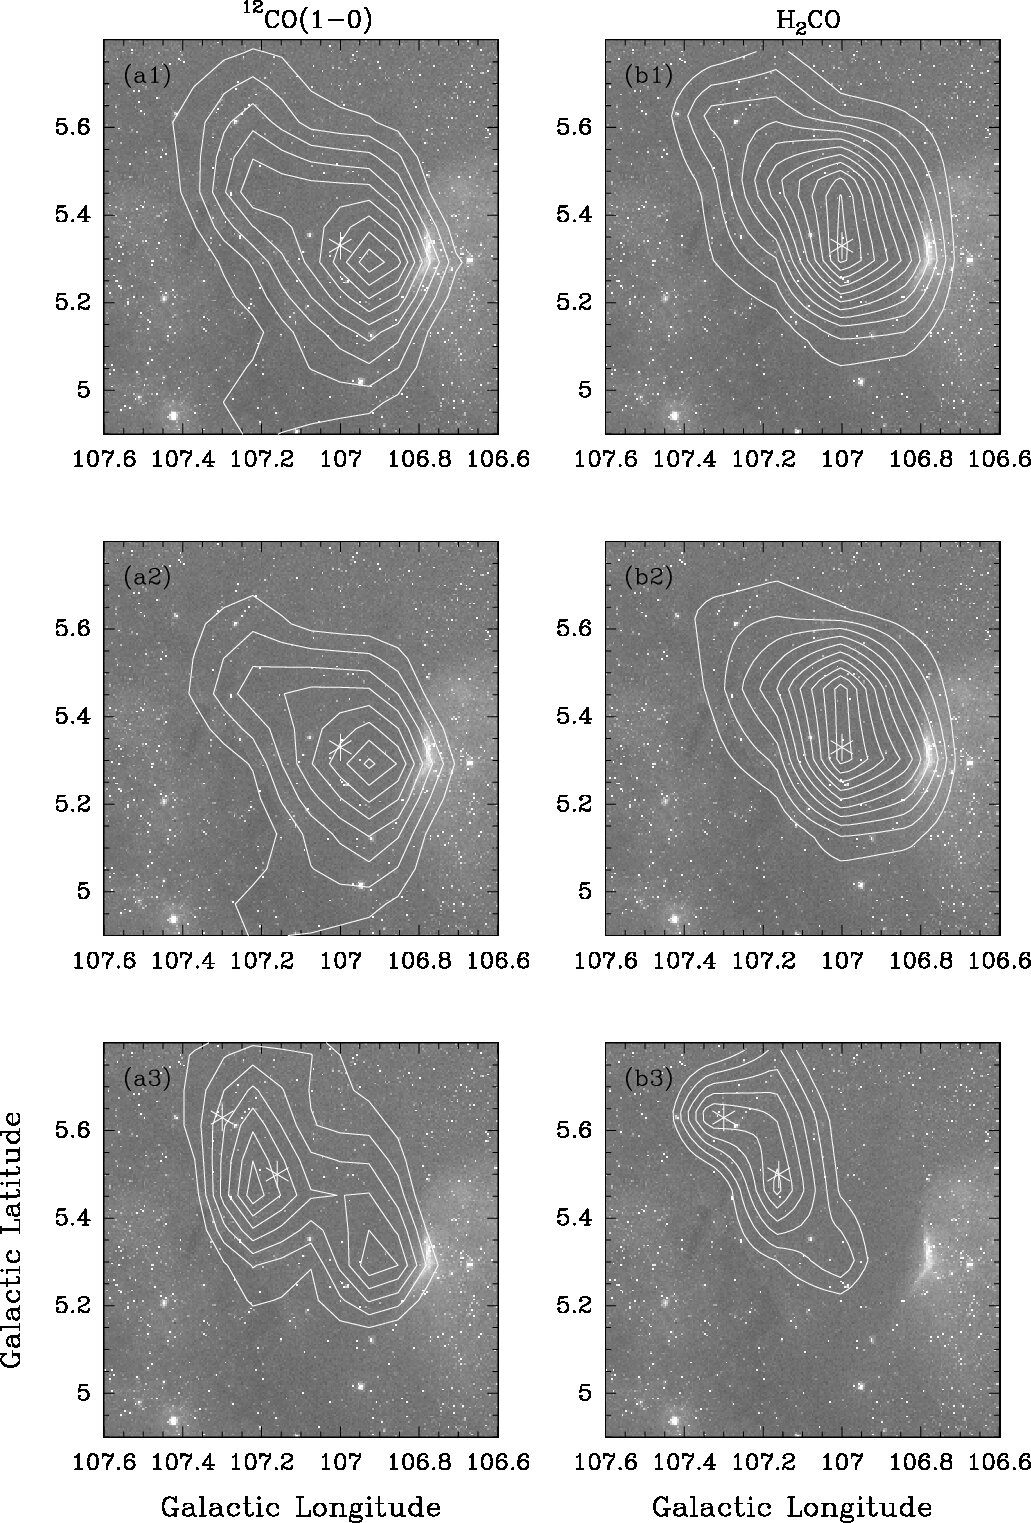 Figure 3
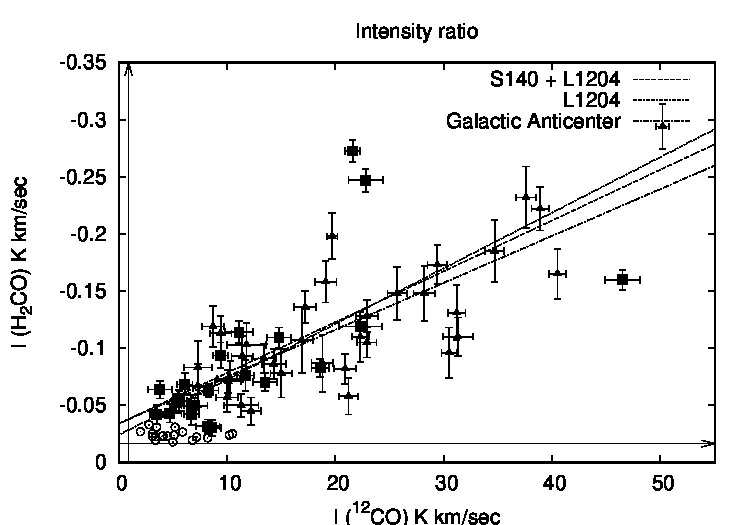 Figure 4
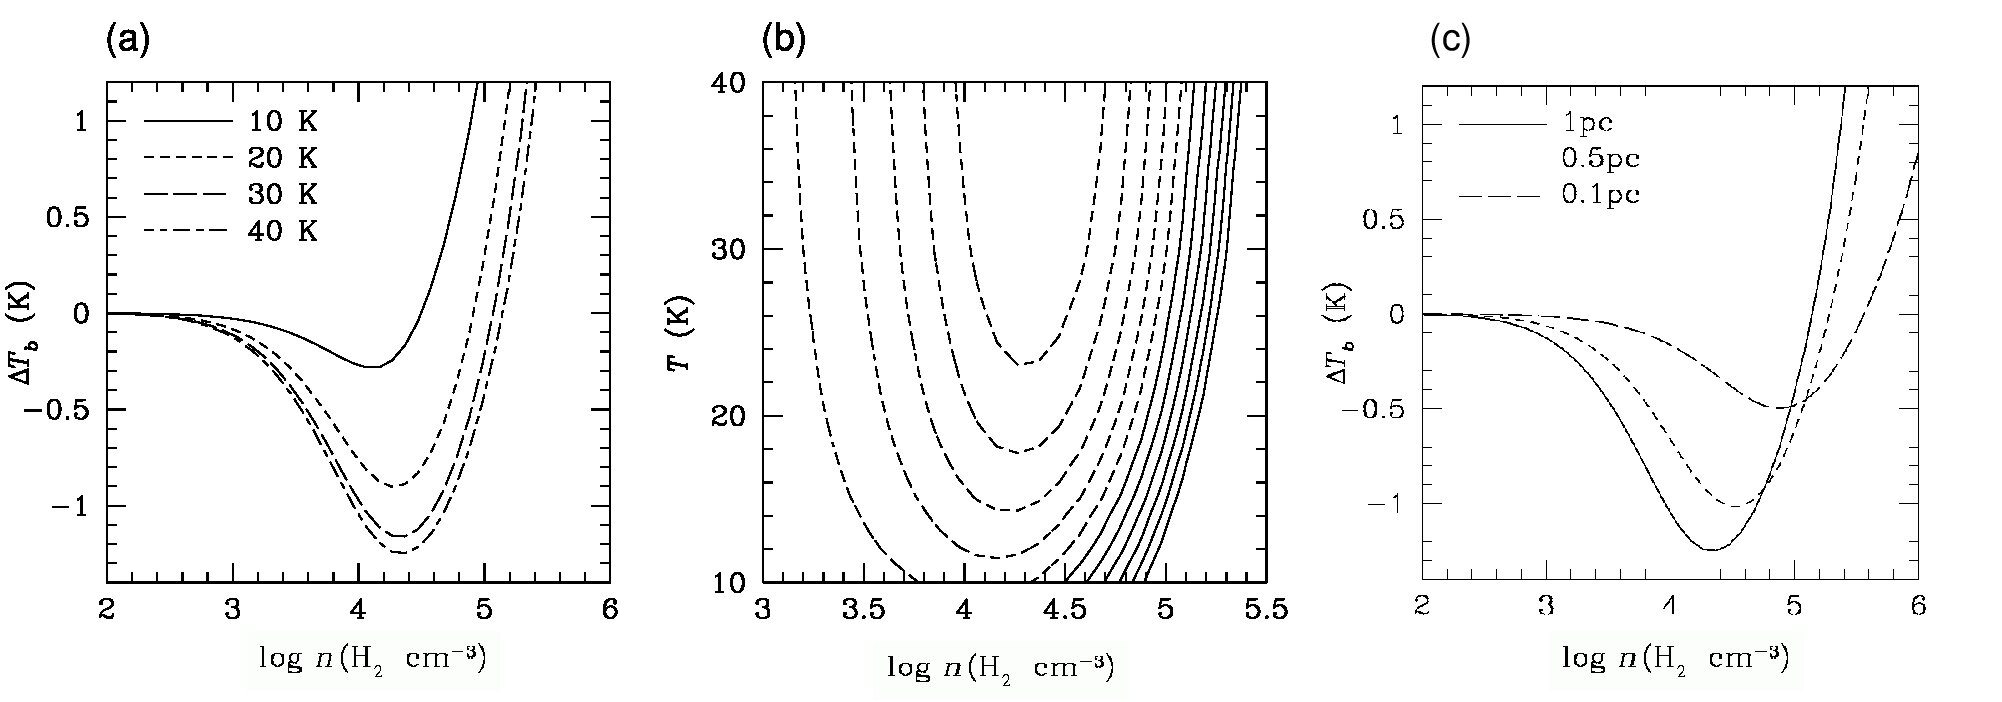 Figure 5
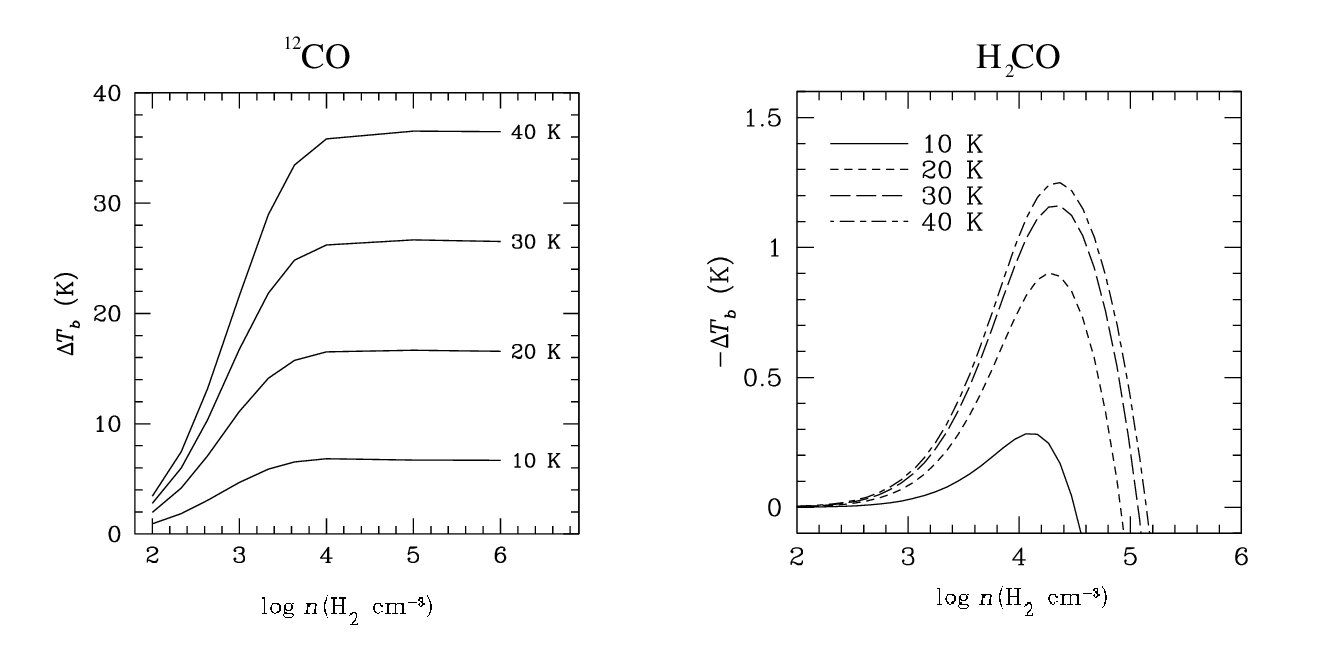 Figure 6
| Source | Position (l, b) | Size () | (J2000.0), (J2000.0) | Reference |
|---|---|---|---|---|
| L1204 | , + | Lynds (1962) | ||
| S140(Hα) | , + | 2′ 6′ | Sharpless (1959) | |
| Our survey | , + | This paper |
| Offset (l,b) | I(H2CO) | I(CO) | Included in | ||
|---|---|---|---|---|---|
| arcmin | K km s-1 | km s-1 | K km s-1 | km s-1 | fits |
| 40, -70 | -24.3 | nf | … | … | |
| 30, -70 | -18.9 | nf | … | … | |
| 20, -70 | -25.8 | nf | … | … | |
| 10, -70 | -23.4 | nf | 4.1 0.7 | -7.6 1.3 | |
| 0, -70 | -42.1 8.4 | -7.5 1.5 | 3.5 0.6 | -8.7 1.5 | yes |
| -10, -70 | -30.3 7.1 | -6.2 1.5 | 8.6 0.8 | -8.3 0.8 | yes |
| -20, -70 | -21.6 | nf | 2.1 | nf | |
| 40, -60 | -22.5 | nf | … | … | |
| 30, -60 | -24.0 | nf | … | … | |
| 20, -60 | -26.7 | nf | 5.9 0.8 | -7.0 1.1 | |
| 10, -60 | -23.7 | nf | 5.1 0.6 | -8.3 1.0 | |
| 0, -60 | -19.2 | nf | 1.8 | nf | |
| -10, -60 | -27.9 7.1 | -6.7 0.5 | 2.1 | nf | |
| -20, -60 | -28.8 | nf | 1.5 | nf | |
| 40, -50 | -25.5 | nf | … | … | |
| 30, -50 | -109.3 8.9 | -2.6 0.2 | 14.8 1.1 | -1.8 0.2 | yes |
| 20, -50 | -25.2 | nf | 10.5 0.8 | -5.0 0.4 | |
| 10, -50 | -21.6 | nf | 8.2 0.6 | -7.0 0.5 | |
| 0, -50 | -18.9 | nf | 2.4 | nf | |
| -10, -50 | -16.5 | nf | 2.4 | nf | |
| -20, -50 | -24.6 | nf | 4.8 | nf | |
| 40, -40 | -23.1 | nf | … | … | |
| 30, -40 | -22.8 | nf | 3.1 0.6 | -6.2 1.2 | |
| 20, -40 | -22.2 | nf | 7.2 0.8 | -7.2 0.9 | |
| 10, -40 | -23.1 | nf | 4.5 0.5 | -8.8 1.1 | |
| 0, -40 | -22.5 | nf | 2.7 | nf | |
| -10, -40 | -26.1 | nf | 2.7 | nf | |
| -20, -40 | -18.6 | nf | 3.0 | nf | |
| 40, -30 | -22.5 | nf | 3.4 0.5 | -9.0 1.5 | |
| 30, -30 | -22.8 | nf | 4.0 0.7 | -8.9 1.5 | |
| 20, -30 | -25.5 | nf | 1.8 | nf | |
| 10, -30 | -30.9 | nf | 5.2 0.6 | -8.6 1.0 | |
| 0, -30 | -20.1 | nf | 4.2 | nf | |
| -10, -30 | -26.7 | nf | 1.8 | nf | |
| -20, -30 | -22.2 | nf | 2.1 | nf | |
| 40, -20 | … | … | 2.7 | nf | |
| 30, -20 | -30.9 | nf | 3.5 0.7 | -9.4 1.9 | |
| 20, -20 | -24.0 | nf | 2.7 | nf | |
| 10, -20 | -31.6 6.0 | -8.2 1.6 | 8.2 1.1 | -8.9 1.2 | yes |
| 0, -20 | -29.1 | nf | 8.5 1.4 | -9.5 1.7 | |
| -10, -20 | -19.5 | nf | 6.8 0.3 | -8.7 0.9 | |
| -20, -20 | -22.2 | nf | 1.5 | nf | |
| 40, -10 | … | … | 1.8 | nf | |
| 30, -10 | -35.7 | nf | 2.4 | nf | |
| 20, -10 | -16.8 | nf | 3.0 | nf | |
| 10, -10 | -43.1 8.2 | -8.1 1.6 | 4.7 1.1 | -10.3 2.8 | yes |
| 0, -10 | -76.2 13.8 | -9.5 1.8 | 11.7 0.8 | -9.0 0.6 | yes |
| -10, -10 | -82.7 7.7 | -8.1 0.8 | 18.6 0.6 | -8.2 0.3 | yes |
| -20, -10 | -24.3 | nf | 2.7 | nf | |
| 40, 0 | -33.0 | nf | 2.8 0.5 | -11.6 2.3 | |
| 30, 0 | -28.8 | nf | 3.3 | nf | |
| 20, 0 | -63.8 7.8 | -7.8 0.9 | 3.8 1.1 | -8.9 3.0 | yes |
| 10, 0 | -93.7 11.3 | -8.7 1.1 | 9.4 0.7 | -9.9 0.8 | yes |
| 0, 0 | -272.6 9.8 | -7.8 0.3 | 21.6 0.7 | -8.0 0.3 | yes |
| -10, 0 | -159.8 8.6 | -8.0 0.4 | 46.5 1.6 | -7.8 0.3 | yes |
| -20, 0 | -24.0 | nf | 10.2 0.7 | -7.7 0.6 | |
| 40,+10 | … | … | 1.7 | nf | |
| 30, +10 | -28.8 | nf | 0.9 | nf | |
| 20, +10 | -52.0 8.2 | -8.7 1.4 | 5.3 0.4 | -9.1 0.7 | yes |
| 10, +10 | -114.1 9.7 | -6.2 0.6 | 11.1 1.3 | -7.1 0.9 | yes |
| -70.3 7.7 | -10.3 1.2 | 13.5 1.1 | -10.6 1.0 | yes | |
| 0, +10 | -247.0 10.1 | -7.6 0.3 | 22.8 1.6 | -8.5 0.6 | yes |
| -10, +10 | -118.9 9.2 | -8.1 0.6 | 22.3 2.0 | -8.6 0.8 | yes |
| -20, +10 | -19.2 | nf | 0.9 | nf | |
| 40, +20 | … | … | 1.2 | nf | |
| 30, +20 | -25.2 | nf | 3.1 0.4 | -8.3 1.7 | |
| 20, +20 | -42.3 9.3 | -7.1 1.6 | 6.7 0.7 | -9.9 1.0 | yes |
| -82.0 7.4 | -11.3 1.1 | nf | nf | ||
| 10, +20 | -49.8 6.9 | -6.9 1.0 | 7.0 1.2 | -8.0 1.4 | yes |
| -63.1 5.5 | -10.8 1.0 | 8.3 0.9 | -11.0 1.4 | yes | |
| 0, +20 | -68.3 9.7 | -8.9 1.3 | 6.1 0.7 | -10.8 1.3 | yes |
| -10, +20 | -56.4 6.8 | -8.6 1.1 | 5.5 0.5 | -10.8 1.1 | yes |
| -20, +20 | -29.7 | nf | 2.7 | nf | |
| 40, +30 | … | … | 1.6 | nf | |
| 30, +30 | -27.9 | nf | 1.6 | nf | |
| 20, +30 | -19.5 | nf | 3.4 0.8 | -11.4 2.7 | |
| 10, +30 | -54.1 8.8 | -9.3 1.6 | 5.6 0.7 | -10.3 1.2 | yes |
| 0, +30 | -18.0 | nf | 5.0 0.6 | -11.1 1.3 | |
| -10, +30 | -27.0 | nf | 2.0 0.4 | -10.2 2.2 | |
| -20, +30 | -23.4 | nf | 3.0 | nf |
Peer Reviews
No public reviews on file for this paper yet. If you reviewed it on a platform where reviews are public (OpenReview, ICLR, NeurIPS, ICML), you can paste yours below so the community can read it here.
Videos
No videos yet. Explain this paper in a talk, walkthrough, or lecture? Add one.
A comparison between anomalous 6-cm H2CO absorption and CO(1-0) emission in the L1204/S140 region
Mónica Ivette Rodríguez1,2
Tommy Wiklind1,3
Ronald J. Allen1
Vladimir Escalante2
Laurent Loinard2
1Space Telescope Science Institute, 3700 San Martin Drive, Baltimore, MD 21218, USA
monica, rjallen, [email protected]
2Centro de Radiostronomía y Astrofísica, Universidad Nacional Autónoma de México, Apartado Postal 72 - 3, C.P. 58091, Morelia, Michoacán, México
m.rodriguez, l.loinard, [email protected]
3Affiliated with the Space Sciences Department of the European Space Agency
Abstract
We report observations of the dust cloud L1204 with the Onsala 25-m telescope in the 6 cm (111-110) transition of H2CO. The observed region includes the S140 H arc. This spectral line is seen here in absorption against the cosmic microwave background, indicating the presence of widespread warm molecular gas at intermediate densities. Overall, the distributions of H2CO and CO (taken from the literature) are fairly similar, though significant differences exist at small scales. Most notably, while the CO peak is nearly coincident with the S140 H arc, the maximum H2CO absorption is clearly separated from it by a full 10*′* beam ( 3 pc). We argue that these differences result from differing abundances and excitation requirements. The CO(1-0) line is more optically thick and more biased towards warm gas than the H2CO 6 cm line. On the other hand, formaldehyde is more easily photodissociated and is, therefore, a poorer tracer of the molecular gas located immediately behind Photon Dominated Regions.
ISM: clouds — ISM: molecules – radio lines: ISM – stars: formation – galaxies: ISM
1 Introduction
Since H2 –the most abundant molecule in space– lacks a permanent dipole moment, its rotational transitions are prohibited. Although the quadrupolar transitions exist, they are of little use for the syudy of the bulk of molecular gas in the ISM because they require high temperature to be excited. Instead, the structure and properties of cold molecular clouds in the interstellar medium are usually studied using low-energy rotational transitions of simple non-symmetric polar molecules. For practical reasons, the first rotational transition (J = 10) of carbon monoxide (CO), at 115.27 GHz has been the most popular choice. This transition, however, has long been known to be nearly always optically thick, so –for a given filling factor– its intensity is expected to increase monotonically with the kinetic temperature of the emitting gas. Clearly, this could have adverse effects on efforts to establish the distribution of molecular gas in the ISM from CO observations alone, because very low temperature gas might go unnoticed in sensitivity-limited CO observations while warm regions ( 20 K) will stand out even if they are not those with the highest molecular content. The sources where these effects might be most noticeable are those with large temperature gradients; for instance in molecular clouds located in the immediate vicinity of hot stars.
While all molecular emission tracers share this temperature dependance to some degree, absorption lines can be detected even in very cold gas, provided sufficiently bright background continuum sources are available. The scarcity of such sources at the wavelength of the common molecular tracers, however, has limited the usefulness of absorption measurements in the study of specific Galactic molecular clouds (e.g Evans et al. 1980). The 6-cm (110-111) transition of ortho formaldehyde (H2CO) offers an interesting alternative. Owing to collisions with neutral particles that selectively overpopulate the lower energy level, the excitation temperature of the 110 111 transition lies below 2.7 K (Townes & Cheung, 1969). This allows the transition to be observed in absorption against the cosmic microwave background (CMB) (Snyder et al., 1969), and makes it a potentially powerful tracer of molecular gas in any direction of the sky. The excitation requirements are such the the 6 cm H2CO line is a good indicator of the presence of cool to warm molecular gas (T 10 K) at intermediate densities (103 cm*-3* n 105cm*-3*). Unfortunately, the absorption line is weak, so very large amounts of telescope time are required to map large areas of the sky.
Recently, Rodríguez et al. (2006) conducted a blind search for H2CO absorption and compared CO emission and H2CO absorption profiles towards the Galactic anticenter. They found a rough, large-scale correlation between these two tracers, and concluded that both lines preferentially trace warm and dense molecular gas. Here, we will examine this relation between CO and H2CO at a somewhat smaller scale using observations of the well-known, nearby star-forming region Sharpless 140 (S140 –Sharpless 1959) associated with the dark dust cloud Lynds 1204 (L1204 –Lynds 1962). L1204 is centered at = 107\mbox{{}^{\circ}\mskip-7.6mu.,}47, = +4\mbox{{}^{\circ}\mskip-7.6mu.,}82 and covers an area of 2.5 square degrees (Lynds 1962). At its southwest edge lies S140, a prominent compact arc-shaped H ii region with an angular size of 2*′* 6*′. The ionization of S140 is maintained by the nearby B0V star HD211880 (Blair et al., 1978). The distance of S140/L1204 deduced from the brightness of the exciting star is 910 pc (Crampton & Fisher, 1974). S140 has been the subject of many observational studies, that have usually focused on the Photon Dominated Region (PDR) on the edge of L1204, and on the embedded infrared sources located right behind it (e.g., Preibisch et al. 2001; Hayashi & Murata 1992; Preibisch & Smith 2002; Bally et al. 2002). Remarkably, while the dust cloud is seen as an extended dark feature covering more than two square degrees, the CO emission peaks immediately behind the H arc (Heyer et al. 1996; Evans et al. 1987; Blair et al. 1978), while only relatively faint emission extends deep within the dust cloud (Helfer & Blitz, 1997). The 6-cm line of H2CO was detected in absorption against the CMB in L1204 near S140 by Blair et al. (1978) with the NRAO 43 m telescope, and unexpectedly by Evans et al. (1987) during VLA observations of the bright condensation just northwest of S140. However neither of those studies provided a extensive mapping of the H2CO CMB absorption in L1204, and the exact extension of the gas traced by H2CO remains unclear. In this article, we will present such a extensive mapping of the 6 cm CMB absorption of H2*CO over most of the large dust complex L1204, and compare our results with existing CO observations taken from the literature.
2 Data
The H2CO observations were obtained during two sessions (January and September-October 2004, respectively) with the 25.6-m telescope of the Onsala Space Observatory (OSO) in Sweden. At 6 cm, the angular resolution is 10*′, and our pointing precision was always better than 20′′. Frequency-switching, with a frequency throw of 0.4 MHz was used, and both polarizations of the incoming signal were recorded simultaneously in two independent units of the autocorrelation spectrometer. Each of these units provided 800 2 kHz-wide channels. At the observed frequency of 4829.660 MHz, this setup provided a total bandwidth of 99 km s-1* and a (Hanning-smoothed) velocity resolution of 8 kHz 0.49 km s*-1*. The spectrometer was centered at the systemic velocity of S140, VLSR = 8.0 km s*-1*. Daily observations of the supernova remnant Cas A were used to check the overall performance of the system. The system temperature during our observations varied from 33 to 36 K.
In order to map the entire region behind S140, we observed 72 positions on a regular square grid with a 10*′* spacing, centered at = 107\mbox{{}^{\circ}\mskip-7.6mu.,}0, = +5\mbox{{}^{\circ}\mskip-7.6mu.,}3; the resulting map uniformly covers a 1\mbox{{}^{\circ}\mskip-7.6mu.,}0 1\mbox{{}^{\circ}\mskip-7.6mu.,}8 rectangular region (Fig. 1) . The off-line data reduction was done with the CLASS program of the GILDAS software package (Guilloteau & Forveille, 1989), and involved only the subtraction of (flat) baselines from individual integrations and the averaging of all spectra taken at the same pointing position. The total integration time for each of these positions was about 10 hours, yielding a typical final noise level of 3 mK (T).
The distribution of radio continuum sources in the region of L1204 has been studied in detail by Allen Machalek & Jia (in preparation), using data from the Canadian Galactic Plane Survey. Fairly bright continuum emission is associated with the H arc and the embedded massive protostars located behind it –but, as we will see momentarily no formaldehyde was detected from either of these regions. In addition, a number of extragalactic background sources as well as diffuse emission associated with the dust cloud L1204 itself contribute to the overall radio continuum. The typical brightness temperature average over the Onsala beam at 6 cm, however, is only about 0.2 K, except towards the H arc and the embedded massive protostars (where again, no absorption was detected). Since the brightness temperature is so small, any H2CO absorption profiles features detected must be absorption of the cosmic microwave background radiation at 2.7 K.
In the analysis of our new observations, we will also make use of 12CO(1-0) observations of L1204/S140 kindly provided by Dr. Tamara Helfer, and published in Heyer et al. (1996), and Helfer & Blitz (1997). These data were obtained with the 14-m telescope of the Five College Radio Astronomy Observatory (FCRAO) in Amherst (MA), and have an intrinsic angular resolution of 45*′′. For comparison with our formaldehyde data, we have smoothed the CO(1-0) observations to 10′*, and resampled them on our observing grid.
3 Results
Formaldehyde absorption was detected in at least 16 of our 72 observed positions (see Fig. 2). The maximum absorption is located 10*′* arcmin behind the S140 H ii region at a LSR velocity of 8.0 km s*-1*, similar to that of the CO emission detected in that area. A second spatio-kinematical structure is detected towards the north-east (here, and in the rest of the paper, north and all other directions refer to Galactic coordinates), at 11 km s*-1*. Both components are presumably associated with L1204, and have clear CO counterparts (Fig. 2 – Blair et al. 1978; Evans et al. 1987; Sugitani & Fukui 1987; Park & Minh 1995). There is also an isolated absorption feature towards the southeast, at 2.5 km s*-1*. Given its low LSR velocity, this feature is likely unrelated to L1204, and is probably a local cloud along the line of sight. Thus, while Sugitani & Fukui (1987) identified three molecular components associated with L1204 in their 13CO observations, we only find two in our formaldehyde data. We do find evidence, however, for a systematic velocity gradient across the cloud. Park & Minh (1995) argued that this complex overall spatio-kinematical morphology was created when S140 and L1204 were swept up by an expanding shell associated with the Cepheus bubble. Our data do not illuminate this assertion any further, and a more thorough study is necessary to understand the detailed structure of this region.
4 Comparison with other molecular tracers
The S140/L1204 region has been observed in many different molecular tracers (e.g. Tafalla et al. 1993, Zhou et al. 1993, Park & Minh 1995), but most of these observations have focused either on the S140 PDR or on the embedded infrared sources located just behind S140, while only a few observations covered the entire dust cloud. Indeed, the first CO observations of S140 (Blair et al., 1978) only covered a limited part of the region. To our knowledge, the only existing large-scale CO map of L1204 is that obtained in the 90s with the FCRAO telescope (see §2) and published by Heyer et al. (1996) and Helfer & Blitz (1997)111The region lies on the edge of, and is only partly covered by, the CfA Galactic plane survey of Dame et al. (2001).. As mentioned earlier, we will use a smoothed version of that dataset here in order to compare with our formaldehyde observations.
In general, the CO emission and H2CO absorption morphologies in this region are quite similar (Fig. 3). This was already noticed by Blair et al. (1978) in their 6*′* observations. It is also in good agreement with the results obtained towards the Galactic anticenter by Rodríguez et al. (2006), and towards the Orion molecular complex by Cohen et al. (1983). There are, however, several noteworthy differences between the CO emission and H2CO absorption in S140. The first difference is the fact that the CO peak and the H2CO absorption maximum are not located at the same position. The CO integrated intensity map (Fig. 3, see also Fig. 2) shows that the maximum CO emission occurs just behind the S140 H arc at the western edge of L1204, while only comparatively fainter emission extends to greater longitudes. The maximum H2CO absorption, however, is located about 10*′* eastward of the CO peak. A second notable difference between the CO and H2CO profile is the existence of a CO emission ”tail” in the south/southeast part of the main cloud with little or no H2CO counterpart (Figs. 2 and 3).
In order to study the relation between H2CO absorption and CO(1-0) emission in a more quantitative way, we have computed the moments of the profiles shown in Fig. 2. The results are listed in Table 2 (Appendix B). When two velocity components are visible at a given pointing, the moments for each were computed separately. Intensities above are shown as squares in Fig. 4, and were used to make least-square fits (see below). The two spatio-kinematical components that we identified in our formaldehyde dataset behave quite similarly with respect to the CO-H2CO relation, and are plotted together in Fig. 4. The best least-squares fit to a straight line for the entire L1204 dataset yields:
[TABLE]
We shall see momentarily that the CO emission near S140 may be particularly bright because of local heating. Ignoring the pointings very near S140, however, yields a fairly similar relation between CO and H2CO:
[TABLE]
The small difference between these relations presumably reflects the differing excitation requirements for the two lines. The relation between CO and H2CO given by Eqs. 1 and 2 for the L1204 region is almost identical to that found towards the Galactic anticenter by Rodríguez et al. (2006):
[TABLE]
It is important to note, however, that, in spite of the agreement between the fits to the Galactic anticenter and S140 data, there is very significant scatter in the CO-H2CO relation, some points lying nearly 10 away from the linear relation. This situation was already noticed by Rodríguez et al. (2006) in their study of the Galactic anticenter. This lack of a detailed correspondence between CO emission and H2CO absorption presumably reflects differences in the excitation conditions of the two tracers, as we will now discuss in the next section.
5 Discussion
The comparison between H2CO absorption and CO(1-0) emission profiles in the Galactic Anticenter and in the L1204/S140 region has led us to three important observational conclusions:
Qualitatively, the morphology of CO and H2CO are quite similar, and quantitatively, the line integrated intensities correlate quite well with one another. 2. 2.
The scatter in the CO-H2CO relation is, however, significantly larger than the observational errors. 3. 3.
In the specific case of S140, the CO emission peak is offset by about 3 pc from the locus of the deepest formaldehyde absorption, and there is a region south of the main cloud where significant CO emission is detected with little or no H2CO counterpart.
From the general large-scale correspondance between the CO(1-0) and H2CO 6 cm integrated maps (Fig. 3), and from the fair correlation between their line intensities (Fig. 4), we conclude that the physical conditions needed for the excitation of both lines are quite similar. The calculations presented in the Appendix A, indeed show that both lines preferentially trace warm gas at intermediate densities (103.6 n 105 for H2CO; n 102.8 for CO). In this scheme, the offset between the CO(1-0) peak and the H2CO maximum absorption may seem puzzling. Note that a similar trend is seen at higher resolution: while the CO peak in the full-resolution CO map published by Heyer et al. (1996) and Helfer & Blitz (1997) is at = 106o.8, = +5o.3, the H2CO absorption feature seen in the high-resolution VLA images published by Evans et al. (1987) is centered around = 106o.9, = +5o.3, again a few arcminutes to the east.
We suggest that a combination of two effects may explain this puzzling result. First, it can be seen from the excitation analysis presented in Appendix A that the H2CO absorption strength ”saturates” for K, whereas the temperature of the CO emission continues to rise at higher kinetic temperature (Fig. 5). For example, while the H2CO line strength increases by only about 30% when the kinetic temperature goes from 20 to 40 K, the CO(1-0) line intensity increases by more than a factor of two. According to Park & Minh (1995), the CO brightness temperature is about 40 K at the peak and 20 K for the rest of the cloud. Thus, the strong CO peak behind S140 may well be largely due to enhanced kinetic temperatures related to local heating (by the external star providing the ionization of S140, and/or by the infrared sources embedded in the cloud). As one progresses into the cloud, the local heating diminishes, and the CO line intensity fades. Also, it should be pointed out that the formaldehyde calculations presented in the Appendix show that the 6-cm line should be seen in emission rather than absorption when the density exceeds 105 cm*-3*. The fact that this is not the case near the CO peak (neither in our low-resolution data, nor in the high-resolution VLA data presented by Evans 1978) suggests that the gas density there is lower than 105 cm*-3*. Other effects that could explain the offset between the CO and the H2CO peaks are the lower dissociation energy, and the lower abundance (and, therefore, lower self-shielding) of formaldehyde compared to CO (see Appendix A.3). In a photo-dissociated region, these effects should combine to create a stratified distribution where CO survives nearer the source of the UV photons than H2CO. This stratification, combined with the heating of the CO, would naturally lead to the offset between H2CO and CO seen in the present data.
Finally, the origin of the other main difference between CO and H2CO in S140, namely the existence of CO emission at the south of L1204 with no or little formaldehyde counterpart, is likely related to another aspect of the excitation differences between the 6 cm line of formaldehyde and the 1-0 transition of carbon monoxide. Fig. 6 of the Appendix A.2 shows that the density detection limit for H2CO line is 10 times larger than the density limit for the CO(1-0) line. We therefore suggest that the gas traced by the CO emission to the south of L1204 is of relatively very low density. It is interesting to note, indeed, that classical high-density molecular tracers (e.g. CS or NH3) have only been detected around the CO peak behind S140, and not in the southern region of the cloud.
Thus, we conclude that the CO(1-0) and H2CO 6 cm lines both tend to preferentially trace warm gas at intermediate densities. There are, however, significant differences related either to differing excitation requirements or to differing abundances. These differences can easily explain the large scatter in the CO–H2CO relation.
6 Conclusions
The main conclusions of this work are the following:
We have mapped a large region (70*′* 110*′) around L1204/S140 in the 6 cm line of formaldehyde, observing a total of 72 regularly-spaced positions every 10′* on a regular grid. The center of our map was at = 107\mbox{{}^{\circ}\mskip-7.6mu.,}0, = +5\mbox{{}^{\circ}\mskip-7.6mu.,}3, and formaldehyde was detected against the cosmic microwave background in at least 16 of our 72 positions (Fig. 2). 2. 2.
The formaldehyde emission can be separated in three spatio-kinematical components (Fig. 3): two (at –11 km s*-1* in the northeast part of the cloud, and at –8 km s*-1* just behind S140) are clearly associated with L1204, whereas the other (an isolated component at –2.5 km s*-1* towards the southeast) is most likely a local foreground cloud unrelated to S140/L1204. 3. 3.
Both qualitatively and quantitatively, the CO(1-0) emission and the formaldehyde 6 cm absorption lines correlate fairly well. An excitation analysis shows that both preferentially trace warm gas at intermediate densities. 4. 4.
There are, however, notable differences between the CO and H2CO lines, that can be traced to differing excitation requirements and abundances. Those differences are most likely the origin of the large scatter in the CO-H2CO intensity correlation.
We thank Professor Roy Booth, director (retired) of the radio observatory at Onsala, for generous allocations of telescope time and for his warm hospitality during our several visits to the observatory. We are also grateful to the observatory technical and administrative staff for their capable assistance with our observing program. We thank Tamara Helfer for supplying us with the CO data cube of S140. We acknowledge the financial support of the Dirección General de Asuntos del Personal Académico (DGAPA), Universidad Nacional Autónoma de México (UNAM) and Consejo Nacional de Ciencia y Tecnología (CONACyT), in México, and the Director’s Discretionary Research Fund at the Space Telescope Science Institute. The Digitized Sky Surveys were produced at the Space Telescope Science Institute under U.S. Government grant NAG W-2166. The images of these surveys are based on photographic data obtained using the Oschin Schmidt Telescope on Palomar Mountain and the UK Schmidt Telescope. The plates were processed into the present compressed digital form with the permission of these institutions.
Appendix A Model calculations
A.1 Collisional pumping
Observations of H2CO in dark clouds show that the anomalous absorption of the 6 and 2 cm lines is due to collisions with H2 that selectively overpopulate the lower levels of the lines (Evans et al., 1975). We calculated the non–LTE equilibrium populations of the first 40 levels of ortho–H2CO assuming excitation by the 2.7 K background and collisions with H2. Green (1991) has calculated excitation rates of these levels for collisions with He taking advantage of the spherical symmetry of the He potential for kinetic temperatures to 300 K. According to Green (1991), excitation rates by H2 collisions could be 2.2 times higher than those by He because of the smaller reduced mass and differences in the interaction potentials. We will show the results of the calculations under the assumption that the H2–H2CO collisional rates are the same as the He–H2CO rates. Probabilities for the radiative transitions were taken from Jaruschewski et al. (1986).
The optical depths of the transitions involved in the pumping mechanism are generally larger than 1 at high densities and a radiative transfer calculation is required. Two limiting approximations in the radiation transport are often considered in molecular clouds: the large velocity gradient (LVG) model and the microturbulent model (Leung & Liszt, 1976). The LVG model assumes that the line profile is dominated by systematic motion of the gas while the microturbulent model assumes that the turbulent velocity is much larger than any systematic motion. S 140 is likely to have several velocity components, but the existence of large systematic motions in molecular clouds and the validity of the LVG model has not been well established in other molecular clouds (e.g. Evans et al. (1975), Zuckerman & Evans (1974), Zhou et al. (1990)). We therefore use the microturbulent model, and for simplicity we will use the escape probability formalism to account for photon trapping in a turbulent medium in plane-parallel slab of mean total optical depth that is perpendicular to the line of sight. In this case the A–value of a transition in the equations of statistical equilibrium is multiplied by a “loss probability” that depends on the mean optical depth in the slab. There are many different ways to define , which can differ by several orders of magnitude for large optical depths. We will use the form suggested by Hummer & Storey (1992) for a uniform medium with no continuum absorption:
[TABLE]
where
[TABLE]
and is the second exponential integral function. The function can be calculated from fits by Hummer (1981) for a normalized Doppler profile, .
Equation (A1) can be viewed as the single flight escape probability through either side of the slab averaged over the line profile. The probability that a photon of an isotropic background reaches optical depth in this slab is also given by equation (A1), and the blackbody continuum is thus attenuated by a factor . The mean optical thickness is given by
[TABLE]
where is the absorption cross section of the transition and is the Doppler width. We assumed a Doppler width of 2 km s*-1* (FWHM = = 3.3 km s*-1*). The level population and its statistical weight are given by and respectively with subindex for the upper and for the lower level.
The emergent line brightness temperature with subtracted background is found by direct integration of the source function throughout the slab as
[TABLE]
where
[TABLE]
is the total mean optical depth of a slab of thickness and is the line–center total optical depth.
Equation A4 gives the correct asymptotic limits: when the density goes to 0 and for high densities. The population densities and the optical depths as a function of position in the slab in equations (A1) and (A3) were calculated iteratively. A convergence of K in was achieved after a few iterations for K and H2 densities . For higher densities and temperatures the procedure becomes unstable. Fig. 5 shows the calculated for a 1 pc–thick slab as a function of the H2 density and a constant H2CO abundance of with respect to H2 (Hasegawa et al. (1992), Leung et al. (1984)). The assumed thickness of the slab has an important effect in the anomalous absorption as shown in Fig. 5. As the thickness of the slab decreases, the effectiveness of the pumping mechanism that cools the line decreases.
Garrison et al. (1975) identified some transitions, like , that produce selection effects in the excitation of some levels that cool the H2CO doublets. We have tested our model for possible variations of the collision rates. An overall increase of collisional rates by a factor of 2.2 decreases in figure 5 by 0.3 to 0.5 K for K and . For lower and there is very little variation in the predicted .
A.2 A PDR model for CO
The UV field has a higher influence on the CO brightness temperature than on the H2CO brightness temperature. Both molecules are quickly photodissociated near the edge of clouds, but the larger abundance of the CO molecule makes its chemistry and interaction with radiation more complex. In order to take into account the variation of CO abundance along the line of sight, we used the Meudon PDR code to calculate the CO brightness temperature of a plane–parallel slab irradiated by a UV field (Le Bourlot et al., 1993). A detailed description of a revised version of the code is given by Le Petit et al. (2006).
The sharp separation between the molecular, atomic and ionized emissions suggests that the L1204/S140 interface is a PDR viewed nearly edge–on (Hayashi & Murata, 1992) irradiated by HD 211880. The angle of incidence of the star’s radiation on the PDR boundary is an unknown parameter but appears to be more-or-less perpendicular. Furthermore, the infrared embedded sources are probably young stars that may also enhance the radiation field (Evans et al., 1989).
We ran the code with its parameters set to represent a plane–parallel slab irradiated from one side by a UV field with an enhancement factor with respect to the Draine (1978) average interstellar radiation field. In a PDR, the gas is heated by the photoelectric emission from grains and PAH’s, H2 formation in grains, UV pumping in the Lyman and Werner bands, gas–grain collisions, photoionization, and photodissociation. As the UV radiation is absorbed deeper into the cloud, other processes like cosmic rays and chemical reaction energies become important. Cooling is produced by fine–structure and molecular line emission. Shocks and turbulence can keep a PDR away from isobaric equilibrium. However in our model the temperature and density of the PDR were kept constant in order to compare the results with our H2CO model in Fig. 6. We used the chemical network given for S140 by the Meudon group at its Internet site222http://aristote.obspm.fr/MIS/pdr/exe.html, which does not include H2CO. Thus the CO and H2CO calculations represent different models, and Fig. 6 is given only as indication of the local conditions that produce the emission and absorption for each molecule.
A.3 Photodissociation of H2CO
The H2CO molecule is quickly photodissociated into CO and H2 or H in the average UV interstellar radiation field with a rate of (van Dishoeck, 1988). Keene et al. (1985) estimated that far–ultraviolet radiation (FUV) from the star HD211880 will have an enhancement factor of with respect to the average interstellar field (Habing, 1968) at the ionization front, although Spaans et al. (1997) found that a more intense radiation field may be needed to explain the H2 rotational emission. H2CO has a dissociation energy of 3.61 0.03 eV (Suto, Wang & Lee, 1986), and a photodissociation rate of 1.0 10*-9* sec*-1* in the interstellar field (van Dishoeck, 1988) while for CO the values are 11.2 eV and 2.0 10*-10* sec*-1* respectively. Thus it is possible that the H2CO will be selectively photodissociated near the S140 ionization front and the bright PDR region, where the CO emission peaks. Detailed PDR model calculations by Li et al. (2002) show that at 20*′* from the ionization front, where we observe the H2CO maximum, and .
We added 62 reactions involving and taken from the UMIST data base (Woodall et al., 2007) 333http://www.udfa.net/ to the chemical network of the Meudon group mentioned above and ran a PDR model with , K and constant density of . We found that has significant abundance only at depths of while CO becomes important at , which shows that photodestruction could explain the offset between the CO and the H2CO peaks.
Appendix B Profile moments in detail
The reference list from the paper itself. Each links out to its DOI / PubMed record.
- 1dummy (2006)
- 2Bally et al. (2002) Bally, J., Reipurth, B., Walawender, J., & Armond, T., 2002, AJ, 124, 2152
- 3Blair et al. (1978) Blair, G. N., Evans, N. J., Vanden Bout, P. A., & Peters W. L., 1978, Ap J, 219, 893-913
- 4Crampton & Fisher (1974) Crampton, D., & Fisher, W. A., 1974, Pub. Dom. Astrophys. Obs., 14, 283
- 5Cohen et al. (1983) Cohen, R. J., Matthews, N., Few, R. W., & Booth, R. S., 1983, MNRAS, 203, 1123
- 6Dame, Hartmann & Thaddeus (2001) Dame, T. M., Hartmann, D., & Thaddeus, P., 2001, Ap J, 547, 792
- 7Draine (1978) Draine, B. T., 1978, Ap JS, 36, 595.
- 8Evans et al. (1975) Evans, N. J., II, Zuckerman, B., Sato, T., & Morris, G. 1975, Ap J, 199, 383.