Complexities of Human Promoter Sequences
Fangcui Zhao, Huijie Yang, and Binghong Wang

TL;DR
This study uses the diffusion entropy approach to analyze 4737 human promoter sequences, revealing scale-invariance with a wide range of exponents and asymmetric Gaussian distributions.
Contribution
It introduces the application of diffusion entropy to characterize scale-invariance in human promoter sequences, highlighting asymmetries in the distribution of exponents.
Findings
Scale-invariance exponents range from 0.3 to 0.9, centered at 0.66.
Distribution of exponents is asymmetric and fits Gaussian functions.
Distinct left and right branches indicate different underlying properties.
Abstract
By means of the diffusion entropy approach, we detect the scale-invariance characteristics embedded in the 4737 human promoter sequences. The exponent for the scale-invariance is in a wide range of , which centered at . The distribution of the exponent can be separated into left and right branches with respect to the maximum. The left and right branches are asymmetric and can be fitted exactly with Gaussian form with different widths, respectively.
Click any figure to enlarge with its caption.
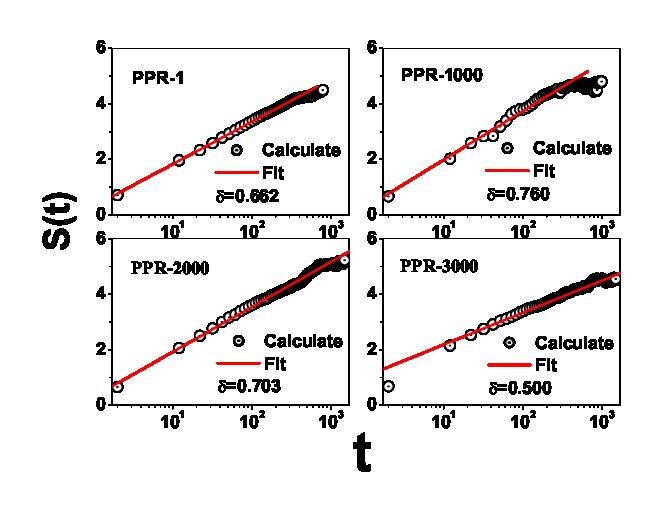 Figure 1
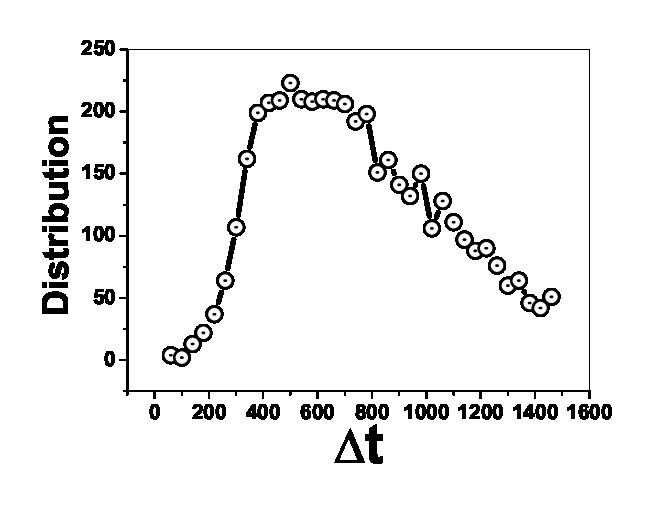 Figure 2
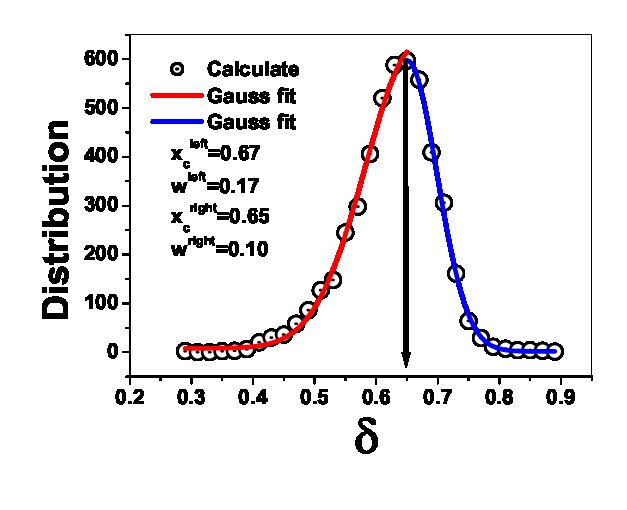 Figure 3
Peer Reviews
No public reviews on file for this paper yet. If you reviewed it on a platform where reviews are public (OpenReview, ICLR, NeurIPS, ICML), you can paste yours below so the community can read it here.
Videos
No videos yet. Explain this paper in a talk, walkthrough, or lecture? Add one.
Complexities of Human Promoter Sequences
Fangcui Zhao1
Huijie Yang2,3
Corresponding author
Binghong Wang4
1 College of Life Science and Bioengineering, Beijing University of Technology, Beijing 100022, China
2 Department of Physics, National University of Singapore, Science Drive 2, Singapore 117543
3 School of Management, University of Shanghai for Science and Technology, and Shanghai Institute for Systematic Science, Shanghai 200093, China
4 Department of Modern Physics, University of Science and Technology of China, Anhui Hefei 230026, China
Abstract
By means of the diffusion entropy approach, we detect the scale-invariance characteristics embedded in the 4737 human promoter sequences. The exponent for the scale-invariance is in a wide range of , which centered at . The distribution of the exponent can be separated into left and right branches with respect to the maximum. The left and right branches are asymmetric and can be fitted exactly with Gaussian form with different widths, respectively.
pacs:
82.39.Pj, 05.45.Tp
††preprint: APS/xxx
I Introduction
Understanding gene regulation is one of the most exciting topics in molecular genetics 1 . Promoter sequences are crucial in gene regulation. The analysis of these regions is the first step towards complex models of regulatory networks.
A promoter is a combination of different regions with different functions 2 ; 3 ; 4 ; 5 . Surrounding the transcription start site is the minimal sequence for initiating transcription, called core promoter. It interacts with RNA polymerase II and basal transcription factors. Few hundred base pairs upstream of the core promoter are the gene-specific regulatory elements, which are recognized by transcription factors to determine the efficiency and specificity of promoter activity. Far distant from the transcription start site there are enhancers and distal promoter elements which can considerably affect the rate of transcription. Multiple binding sites contribute to the functioning of a promoter, with their position and context of occurrence playing an important role. Large-scale studies show that repeats participate in the regulation of numerous human and mouse genes 6 . Hence, the promoter’s biological function is a cooperative process of different regions such as the core promoter, the gene-specific regulatory elements, the enhancers/silencers, the insulators, the CpG islands and so forth. But how they cooperate with each other is still a problem to be investigated carefully.
The structures of DNA sequences determine their biological functions 7 . Recent years witness an avalanche of finding nontrivial structure characteristics embedded in DNA sequences. Detailed works show that the non-coding sequences carry long-range correlations 8 ; 9 ; 10 . The size distributions of coding sequences and non-coding sequences obey Gaussian or exponential and power-law 11 ; 12 , respectively. Theoretical model-based simulations 13 ; 14 ; 15 ; 16 tell us that the parts of the promoters where the RNA transcription has started are more active than a random portion of the DNA. By means of the nonlinear modeling method it is found that along the putative promoter regions of human sequences there are some segments much more predictable compared with other segments 17 . All the evidences suggest that the nontrivial structure characteristics of a promoter determine its biological functions. The statistical properties of a promoter may shed light on the cooperative process of different regions.
Experimental knowledge of the precise 5’ ends of cDNAs should facilitate the identification and characterization of regulatory sequence elements in proximal promoters 18 . Using the oligocapping method, Suzuki et al. identify the transcriptional start sites from cDNA libraries enriched in full-length cDNA sequences. The identified transcriptional start sites are available at the Database, http://dbtss.hgc.jp/. 19 . Consequently, Leonardo et al. have used this data set and aligned the full-length cDNAs to the human genome, thereby extracting putative promoter regions (PPRs) 20 . Using the known transcriptional start sites from over 5700 different human full-length cDNAs, a set of 4737 distinct PPRs are extracted from the human genome. Each PPR consists nucleotides from to , relative to the corresponding transcriptional start site. They have also counted eight-letter words within the PPRs, using z-scores and other related statistics to evaluate the over- and under- representations.
In this paper, by means of the concept of diffusion entropy (DE) we try to detect the scale-invariant characteristics in these putative promoter regions.
II Diffusion Entropy Analysis
The diffusion entropy (DE) method is firstly designed to capture the scale-invariance embedded in time series 21 ; 22 ; 23 . To keep the description as self-contained as possible, we review briefly the procedures.
We consider a PPR denoted with , where is the element at the position and or . Replacing and with and , respectively, the original PPR is mapped to a time series . There is not a trend in this series, i.e., is stationary.
Connecting the starting and the end of , we can obtain a set of delay-register vectors, which reads,
[TABLE]
Regarding each vector as a trajectory of a particle in duration of time units, all the vectors can be described as a diffusion process of a system containing particles. The initial state of the system is \left({{\begin{array}[]{*{20}c}{T_{1}(0)\hfill}\\ {T_{2}(0)\hfill}\\ \vdots\hfill\\ {T_{3001}(0)\hfill}\\ \end{array}}}\right)=\left({{\begin{array}[]{*{20}c}0\hfill\\ 0\hfill\\ \vdots\hfill\\ 0\hfill\\ \end{array}}}\right).
Accordingly, at each time step we can calculate displacements of all the particles. The probability distribution function (PDF) of the displacements can be approximated with p(m,t)\sim\raise 3.01385pt\hbox{{K_{m}}}\!\mathord{\left/{\vphantom{{K_{m}}{3001}}}\right.\kern-1.2pt}\!\lower 3.01385pt\hbox{{3001}}, where and is the number of the particles whose displacements are . It can represent the state of the system at time .
As a tenet of complexity theory 24 ; 25 , complexity is related with the concept of scaling invariance. For the constructed diffusion process, the scaling invariance is defined as,
[TABLE]
where is the scaling exponent and can be regarded as a quantitative description of the PPR’s complexity. If the elements in the PPR are positioned randomly, the resulting PDF obeys a Gaussian form and . Complexity of the PPR is expected to generate a departure from this ordinary condition, that is, .
The value of can tell us the pattern characteristics of a PPR. The departure from the ordinary condition can be described with a preferential effect. Let the element is (or ), the preferential probability for the following element’s being (or ) is . A positive preferential effect, i.e, , leads to the value of larger than . While a negative preferential effect, i.e, , can induce the value of smaller than . Hence, a large value of implies that or accumulate strongly in a scale-invariance way, respectively.
However, correct evaluation of the scaling exponent is a nontrivial problem. In literature, variance-based method is used to detect the scale-invariance. But the obtained Hurst exponent may be different from the real , that is, generally we have. And for some conditions, the variance is divergent, which leads the invalidation of the variance-method at all. To overcome these shortages, the Shannon entropy for the diffusion can be used, which reads,
[TABLE]
This diffusion-based entropy is called diffusion entropy (DE). A simple computation leads the relation between the scaling invariance defined in Eq.2 and the DE as,
[TABLE]
where is a constant depends on the PDF. Detailed works show that DE is a reliable method to search the correct value of , regardless the form of the PDF 26 ; 27 ; 28 ; 29 .
The complexity in the PDF can be catalogued into two levels 30 , the primary one due to the extension of the probability to all the possible displacements , and the secondary one due to the internal structures. Consequently, we should consider also the corresponding shuffling sequences as comparison.
III Results and Discussions
The DEs for all the 4737 PPRs are calculated. As a typical example, Fig.1 presents the DE results for the PPRs numbered and . In considerable wide regions of , the curves of DE can be fitted almost exactly with the linear relation in Eq.4.
For each PPR, there exists an interval, , in which the PDF behaves scale-invariance. Keeping simultaneously the standard deviation and the error of the scaling exponent for the fitting result in the range of and , we can find the maximum intervals for all the PPRs. In the fitting procedure, the confidence level is set to be . The distribution of , as shown in Fig.2, tells us that generally the scale-invariance can be found over two to three decades of the scale . The concept of DE is based upon statistical theory, that is, should be large enough so that the statistical assumptions are valid. To cite an example, we consider a random series, whose elements obey a homogenous distribution in . Only the length of the delay-register vectors, , in Eq.(1) is large enough, the corresponding PDF for the displacements, i.e, the summation value of each delay-register vector, approaches the Gaussian distribution. Consequently, is not a valuable parameter. The values of for different PPRs are not presented.
The resulting scaling exponent distributes in a wide range of . The distribution can be separated into two branches with respect to the center . The two branches are asymmetric and can be fitted exactly with the Gauusian function, respectively. The widths and centers of the left and right branches are , . That is to say, the centers coincide with each other, . Comparatively, the right branch distributes in a significant narrow region.
The PPRs are shuffled also. For each PPR, the shuffling result is obtained by averaging over ten shuffling samples. The scaling exponents are almost same, i.e., . The detected scale-invariant characteristics are internal-structure-related.
How to understand the asymmetric characteristic of the distribution of the complexity index is an interesting problem. In literature, some statistical characteristics of DNA sequences are captured with evolution models, such as the long-range correlations and the over- and under-representation of strings and so on 31 ; 32 ; 33 . From the perspective of evolution, perhaps the distribution characteristics may favor a stochastic evolution model. The initial sequences have same complexity . With the evolution processes the sequences diffuse along two directions, increasing complexity and decreasing complexity, i.e, the index increases and decreases, respectively. The diffusion coefficients for the two directions are significantly different, denoted with . Based upon the widths of the two branches we can estimate that, \raise 3.01385pt\hbox{{D^{left}}}\!\mathord{\left/{\vphantom{{D^{left}}{D^{right}}}}\right.\kern-1.2pt}\!\lower 3.01385pt\hbox{{D^{right}}}=\raise 3.01385pt\hbox{{\delta^{left}}}\!\mathord{\left/{\vphantom{{\delta^{left}}{\delta^{right}}}}\right.\kern-1.2pt}\!\lower 3.01385pt\hbox{{\delta^{right}}}=1.7. It should be noted that, the complexity is regarded as the departure from the ordinary condition, . In the totally values of , only a small portion of them are less than . Accordingly, the PPRs may be catalogued into two classes, the PPRs with high complexity and the PPRs with low complexity. The former class evolves averagely with a slow speed while the later one with a high speed.
In summary, by means of the DE method, we calculate the complexities of the 4737 PPRs. The distribution of the complexity index includes two asymmetric branches, which obey Gaussian form with different widths, respectively. A stochastic evolution model may provide us a comprehensive understand of these characteristics.
IV Acknowledgements
This work is funded by the National Natural Science Foundation of China under Grant Nos. 70571074, 10635040 and 70471033, by the National Basic Research Program of China (973 Program) under grant No.2006CB705500), by the President Funding of Chinese Academy of Science, and by the Specialized Research Fund for the Doctoral Program of Higher Education of China. One of the authors (H. Yang) would like to thank Prof. Y. Zhuo for stimulating discussions.
The reference list from the paper itself. Each links out to its DOI / PubMed record.
- 1(1) Ohler,U. and Niemann,H. (2001) Identification and analysis of eukaryotic promoters: recent computational approaches. Trends Genet., 17 , 56-60.
- 2(2) Werner,T. (1999) Models for prediction and recognition of eukaryotic promoters. Mammalian Genome, 10 , 168-175.
- 3(3) Pedersen,A.G., Baldi,P., Chauvin,Y., Brunak,S. (1999) The biology of eukaryotic promoter prediction - a review. Comput. Chem., 23 , 191-207.
- 4(4) Zhang,M.Q. (2002) Computational methods for promoter recognition. In: Jiang T, Xu Y, Zhang,M.Q., editors. Current topics in computational molecular biology. Cambridge, Massachusetts: MIT Press; p. 249-268.
- 5(5) Narang,V., Sung,W.-K., Mittal A. (2005) Computational modeling of oligonucleotides positional densities for human promoter prediction. Art. Intel. Med., 35 , 107-119.
- 6(6) Rosenberg, N. and Jolicoeur, P. (1997) Retroviral pathogenesis. In Retroviruses (Coffin, J.M. et al., eds), pp. 475–586, Cold Spring Harbor Press.
- 7(7) Buldyrev,S.V., Goldberger,A.L., Havlin,S., Mantegna,R.N., Matsa,M.E., Peng,C.-K., Simons, M. and Stanley,H.E. (1995) Long-range correlation properties of coding and noncoding DNA sequences: Gen Bank analysis. Phys. Rev. E 51 , 5084-5091.
- 8(8) Peng,C.K., Buldyrev,S., Goldberger,A., Havlin, S., Sciortino,F., Simons,M. and Stanley,H.E.(1992) Long-range correlations in nucleotide sequences. Nature 356 , 168-171.